For enjoyment or use, a US postage stamp featuring All Birds Barcoding Initiative (ABBI) and the Consortium for the Barcode of Life (CBOL) is available at zazzle.com.
For enjoyment or use, a US postage stamp featuring All Birds Barcoding Initiative (ABBI) and the Consortium for the Barcode of Life (CBOL) is available at zazzle.com.
Paul Waggoner helpfully led the preparation of a Forest Identity Tutorial taking a novice step-by-step through the equation, the Forest Identity, at the heart of our November 2006 PNAS paper. The tutorial, Defining and Using the Forest Identity, includes some new analyses (for example, about Mediterranean forests), some new Forest Identity slides showing the power of the Forest Identity, and refers to a growing stock spread sheet with growing stock data for 144 countries in 1990 and 2005. Finally, the tutorial introduces our new phrase “Carbon Orchards,” which updates the notion of forests for the 21st century.
In a May 2006 workshop in the Netherlands we helped join the Census of Marine Life and the Consortium for the Barcode of Life to advance barcoding of marine organisms. The presentations from the meeting are now posted, including Jesse’s. In general, we are excited and delighted by the recent series of events indicating DNA barcoding’s progress.
In early online J Zool Syst Evol Res researchers from Natural History Museum and Imperial College, London, scrutinize “recent advances in DNA taxonomy…that follow the dramatic increase in data generation“. Authors Vogler and Monaghan provide a scientific update to
 what has been learned so far: “a key finding from recent studies in animals is that variation in mitochondrial DNA is partitioned as tight clusters of closely related genotypes, which group specimens largely according to traditionally recognized species limits, and which are congruent with nuclear markers”,
the durability of clustering: “it can be expected that denser geographic and taxonomic sampling may result in the discovery of new clusters, and perhaps reduce their divergence from each other, but they are unlikely to erode the clustering altogether”,
the significance of incongruence between DNA-based and morphology-based methods for delimiting species: “the high degree of congruence of mtDNA groups and traditionally defined taxa appears to contradict the reported mismatch of established species boundaries…even well-studied groups may be in need of taxonomic revision before accurate tests of incongruence can be conducted”,
what the future holds: “a standard DNA taxonomic analysis will include broad sampling..followed by large-scale sequencing, and algorithmic procedures for delineating species limits. The taxonomic system will be derived from the data rather than expert opinion“,
 and what is needed to harness DNA taxonomy in general and DNA barcoding in particular to speed description of the estimated 80% of earth’s biodiversity that is at yet undescribed: “a feedback loop that [uses] discrepancies between DNA and other data to refine species descriptions..founded in existing theory of evolutionary biology and phylogenetics”
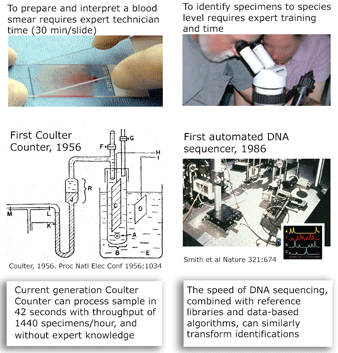
I close with a pictorial analogy. The Coulter counter uses electrical sensing to gain the same information as morphologic diagnosis of blood smears, with dramatic improvements in speed, cost, and necessary expertise. In some situations, DNA sequencing may provide similar improvements over morphologic diagnosis for species-level identification.
PHE’s geneticist and artist, Mark Stoeckle, has prepared a beautiful stamp for the All Birds Barcoding Initiative, available for viewing at Zazzle.
Why DNA barcoding works as well as it does is an unsolved scientific puzzle. It is long observed that mitochondrial DNA differences within animal species are generally much smaller than those among species and, in the landscape of phylogenetic trees, mitochondrial DNA sequences of most species form single clusters distinct from those of other species. As a result “mtDNA data and traditional taxonomic assignments tend to converge on what may be “real” biotic units in nature” (Avise and Walker 1999 Proc Natl Acad Sci USA 96:992). Although Avise and Walker’s original observation was largely based on terrestrial, temperate zone vertebrates, growing barcode libraries demonstrate similar patterning in diverse invertebrates, vertebrates, and protists in marine and terrestrial environments, and in tropical and temperate zones, and in at least some fungi and plants (see last week’s post on COI barcodes in red algae)
 What underlies the usual patterning of small differences within and large differences among most animal species? The unsolved puzzle is how to reconcile these two findings. Large differences among closely-related species indicates mitochondrial DNA undergoes rapid sequence evolution, and there are reasonable mechanistic explanations for why this might be so. On the other hand, rapid sequence evolution should also lead to accumulation of sequence diversity within species over time and in those with large populations. Instead the data shows a relative absence of variation within most species, including those thought to be ancient and those with enormous population sizes. I will set aside two of the usual suspects: population bottlenecks and small effective population size. Population bottlenecks are implausible given the diversity of species showing this pattern. Postulating a small effective population size is a restatement of the finding of absence of variation, not an explanation.
This table-napkin analysis leads me to selective sweeps as pruning mitochondrial diversity within species (eg Bazin et al 2006 Science 312:570, see also editorial and reader commentary). If selective sweeps restrict mitochondrial diversity, then the question becomes what is being selected for? Environmental adaptation seems unlikely, as restricted variation is seen in species that are as best one can tell morphologically and ecologically unchanged (eg see earlier posts on horseshoe crabs, salamanders). It might be there is little tolerance for genetic variation due to interactions of mitochondrial proteins with other cellular components, but if so there should be species with genetic stasis in mitochondrial DNA, just as there are many species with apparent morphologic stasis. However, in simple distance trees most species show roughly similar genetic distances.
I am intrigued by a time series of influenza A hemagglutinin gene evolution which reflects competition between virus and host and wonder if there might be some kind of competition that helps drive mitochondrial sequence evolution forward and at the same time suppresses variation. It is exciting there will be an EMBO workshop “Molecular Biodiversity and DNA Barcodes” May 2007 in Rome which may help answer scientific questions posed by DNA barcode data.
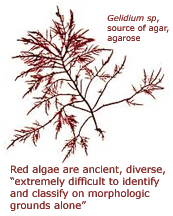 Red seaweeds, kingdom Rhodophyta, are “weird, wonderful, and extremely ancient” organisms distantly related to plants (Tudge 2000 The Variety of Life). Multicellular red algae arose at least 1.2 billion years ago, predating the earliest multicellular animals by 600 million years. Visual identification is challenging, as “morphology can be highly variable within and between species, and conspicuous features with which they can be readily identified are often lacking. In addition, highly convergent morphology is commonly encountered. …Identification is further compounded by the complexities of red algal life histories, many of which have a heteromorphic alternation of generations. Different life history stages of species have frequently been described as separate species and have only been linked through observations of life histories in culture and use of molecular techniques” (Robba et al 2006 Am J Botany 93:1101). Red seaweeds call out for DNA-based identification.
In a preliminary appraisal, COI barcodes “resolved accurately and unequivocally species identities” in three morphologically confusing species complexes of red algae (Saunders 2005 Phil Trans Royal Soc B 360:1879). In September 2006 Am J Botany, researchers from Natural History Museum, London, and University of Bristol, analyzed COI sequences of 79 specimens from 37 red algae, chosen to span 6 orders and represent species “extremely difficult to distinguish morphologically”. All species could be discriminated and intraspecific variation was generally much lower (0.0-0.7%) than interspecific differences (5.2-27.3%). Large intraspecific distances suggested the presence of cryptic species or incipient speciation in two cases. COI outperformed a commonly used genetic marker, the plastid Rubisco spacer, in revealing cryptic diversity. As is generally observed, “a good taxonomic foundation coupled with extensive sampling of taxa is essential for the development of an effective identification system.” A holiday wish for red algae identifiers: a well-curated DNA barcode library.
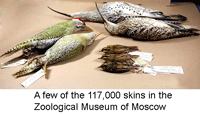 Labelling specimens helps make natural history museum collections valuable. Once specimens have been carefully examined by an expert, a species label can be applied. Labelled specimens can then be re-found and re-examined. Unsorted specimens lacking species designations are more raw material than scientific resource.
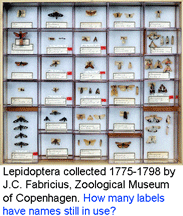
As in all sciences, taxonomic knowledge undergoes continuous revision. Changes in names and understanding of species boundaries may mean that specimen labels need to be updated in light of current knowledge. Partly to compensate, there is enormous effort to link current taxonomic understanding to historical species descriptions. Nonetheless, the accuracy of specimen labels may decay over time. In one study, a revision of predatory flies (Euscelidia) (Meier and Dikow Conservation Biol 2004 18:478), 83% of 1383 specimens from 19 collections were found to be incorrectly identified.
DNA sequences offer a simple approach to help keep specimen labels up to date. DNA sequences are an intrinsic, unvarying characteristic of a specimen. A DNA sequence from a standardized locus (ie a DNA barcode) can serve as a permanent “name” for a specimen. Results so far with more than 20,000 invertebrate and vertebrate species show it is generally straightforward to use a COI barcode to assign specimens to known species. Future taxonomic revisions may change 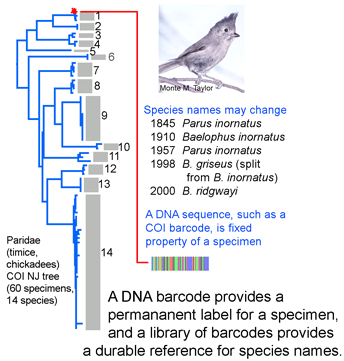 species names or boundaries, but that will not change DNA barcodes of specimens or the clustering patterns of barcode sequences. Thus it should be simple to use a specimen’s barcode sequence “name” to search a regularly revised public database for the current species name it corresponds to. A public database of sequences, specimens, and associated data as is BOLD can undergo continuous refinement, whereas revising labels in every collection around the world is impractical. Given that assigning specimens to species involves sorting among millions of species names, this approach does not have to give 100% resolution to species level to be valuable. It will be useful both for those species with unique barcode clusters or characters and for those sets of closely-related species with overlapping or indistinguishable barcodes.
Finally, on a related note I observe that diagnostic keys are unwieldy and not easily amenable to computerization. For example, Dragonflies of North America (Gainesville: Scientific Publishers, 2000) by Needham, Westfall, and May covers 350 species in 939 pages, or about 2.7 pages per species, which by my count is typical for diagnostic keys. At this rate, a world key for the 5500 known Odonates would run to 15,000 pages. The recondite language that is required to describe morphologic detail in this and other keys makes the tools inacessible except to highly-trained persons. On the other hand, anyone can interpret a DNA sequence. It is exciting that taxonomists and others are increasingly taking up the challenge of translating taxonomic knowledge into a much more widely-accessible format, namely DNA barcode libraries.
Todays Wall Street Journal has an article “Back to the Future: Mixing Work, Home Is a Very Old Dilemma” that quotes Jesse and references our work “Working Less and Living Longer.”
The Census of Marine Life released its annual highlights, now called the “Showcase Public Report” (5 MB). Jesse Ausubel and Paul Waggoner prepared the report with Darlene Crist and Darrell McIntyre of the University of Rhode Island, drawing on the remarkable work of the thousands of contributors to the CoML. The CoML highlights 2006 Site also enables visitors to: