Blog

Building DNA libraries: one-quarter world birds so far

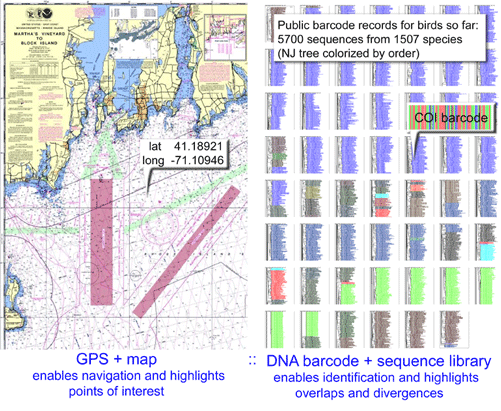
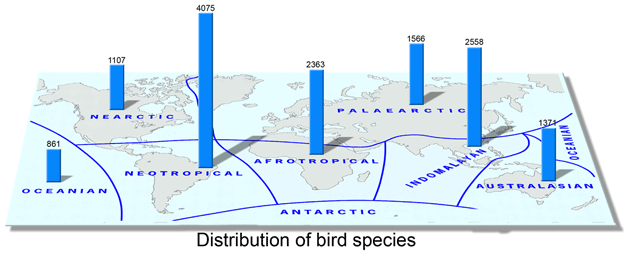
As of October 11, 2008 researchers have deposited 14,594 DNA barcodes in BOLD representing 2,586 avian species, 26% of world’s 9,933 birds. You can browse taxonomic coverage to date at All Birds Barcoding Initiative (ABBI) and BOLD taxonomy browser sites. Coverage includes representatives of all 27 orders and 159 families of world birds and nearly half of avian genera [1,014/2,101 (48%)]. To uncover possible hidden diversity, most researchers are sampling species across their geographic ranges rather than focusing on named subspecies, many or most of which appear to represent clinal variation (see for example Zink 2004Phillimore and Owens 2006).

How far along are researchers toward mapping COI barcode resolution of avian species? Birds are of particular interest because species limits are generally well-defined, supported by a wealth of morphologic, ecological, behavioral, and other genetic data. Looked at regionally, there is good coverage in northern North America, parts of Central and South America, western Europe, Korea, and New Zealand, so it should be possible to see how well COI barcodes distinguish among local species in these areas. Published studies so far show >95% resolution of named species and have identified genetically divergent clusters which may represent unrecognized cryptic or “hidden” species (Vilaca et al 2006, Yoo et al 2006, Nyari 2007Kerr et al 2007). As an aside, “cryptic” is an awkward term for genetically divergent populations of birds since most of these have diagnostic differences in morphology or behavior; “hidden” is more accurate to my ear. On a separate note, COI surveys have regularly revealed misidentified voucher specimens of birds, suggesting routine application of DNA barcode analysis could enhance quality of avian collections. 

Looked at globally, there is 100% coverage of 104 polytypic genera (having 2 or more species) representing 324 birds, so this should include the sister species and/or “nearest neighbors” for these, plus there are 853 monotypic genera (having only 1 species) in world birds, which are likely or known to be genetically divergent from birds in other genera. In addition, there are likely many other sister species or “nearest neighbors” within the remaining 1,982 birds with DNA barcodes so far (for example, BOLD includes 28 of 29 Dendroica sp wood warblers). It would be interesting to look at the nearest neighbor differences within the global data set. To my knowledge, comparisons among regions with COI barcode data have been not been published. My impression based on other avian genetic work is that named taxa in different biogeographic regions are genetically distinct, plus there are many unrecognized genetic divisions within species that range across biogeographic regions. I look forward to trans-regional and global comparisons!

New places to find DNA

In 29 july 2008 Fish Biology scientists from Macquarie University, Sydney describe successful recovery of mitochondrial DNA from contemporary and historical shark teeth and jaws. After developing the method on 11 recently collected teeth from Gray nurse shark Carcharias taurus and Ornate wobbegong (excellent name!) Orectolobus halei, Ahonen and Stowe applied it to 20-40 year old museum specimens, including 5 jaws from 3 species and 19 individual teeth from 2 species. They collected approximately 0.02-0.06 g of “tooth powder” by drilling several small holes into a tooth or jaw; DNA was extracted using a standard silica-based method or Qiagen DNAeasy tissue kit.

The authors are interested in historical population sizes for sharks; following the theory that genetic variation within species is an indicator of population size, they picked the hypervariable control region as their target. As an aside, results so far with mitochondrial surveys including DNA barcoding generally show very low variation within most animal species and no relationship between intraspecific variation and census population size. In any case, a 700 bp fragment of mtDNA control region was amplified with a single pair of primers. The two extraction methods gave similar results.  DNA was amplified and sequenced from 100% of the contemporary samples and 15/34 (44%) historical samples. 700 bp is a relatively long sequence to amplify from historical samples, suggesting it may be possible to obtain standard COI barcodes (648 bp) from museum skeletons of sharks and bony fish, which would be particularly useful for those species which are rare or otherwise difficult to collect. A standard set of fish primers (see for example Hubert et al June 2008 PLoS ONE) amplifies COI barcode region from most fish (more than 5,000 species so far, including including representatives of all major divisions of Chondrichthyes (cartilaginous fish) and Osteichthyes (bony fish), both marine and freshwater).

To date most fish specimens are preserved in formaldehyde, which makes routine DNA recovery difficult or impossible. If DNA can be recovered from skeletons, there are many museum specimens that might be used. For example, the American Museum of Natural History Icthyology Department collection includes over 35,000 fish skeletons as compared to about 2,500 tissue samples so far.

DNA differences first step in describing new spider species

In August 2008 Sys Biol (open access!) researchers from East Carolina University apply mtDNA analysis as the necessary first step in defining three new species of trapdoor spider, previously subsumed as a single species Aptostichus atomarius. According to Bond and Stockman, “the genus Aptostichus is species rich, consisting of 30+ species (most undescribed) found predominantly throughout southern California.” I note that online World Spider Catalog version 9.0, 2008, lists four Aptostichus species, all described between 1891 and 1919, so apparently there is a lot of more work to be done, including updating the reference lists. One of the new names is A. stephencolberti, which led to what must be the first appearance of a spider taxonomist on national television (link to TV episode).

The authors describe the challenge for delimiting species in these California trapdoor spiders: “Highly structured, genetically-divergent, yet morphologically homogeneous species (eg nonvagile cryptic species[my note: nonvagile refers to organisms with limited dispersal]), although often ignored or overlooked, provide one of the greatest challenges to delimiting species. Populations, or very small groups of populations constitute diverent genetic lineages but present somewhat of a contradiction because they lack the “requisite” characteristics” often used when delimiting species. Morphological approaches to species delimitation in many of these groups grossly oversimplify and underestimate diversity; in short these traditional applications fail if our interests extend beyond what can simply be diagnosed with a visual and/or anthropormorphic-based assessment.”

So on the one hand, these spiders comprise multiple genetically distinct lineages (up to 24% sequence difference in 12S/16S mtDNA) with geographically restricted ranges; on the other hand, they all look more or less alike. How to decide which are species? The authors apply “cohesion species concept” by asking if the lineages are “genetically and/or ecologically interchangeable.” The authors provide helpfully provide explicit details of their decision making process. The short version is that genetically distinct, geographically disjunct lineages are counted as separate species, and parapatric or sympatric lineages are counted as different species only if they are NOT “ecologically interchangeable (EI).” EI is calculated from a defined set of ecological and climatic parameters.

Under some criteria, the authors note these spiders could be split into “more than 20” [or even] “~60” groups, which they describe as “an unreasonable number of species-level lineages.” This conjecture may be true; I hope that more scientists apply similarly explicit criteria for species delimitation as described here so we can learn more about how finely divided biodiversity is, in addition to our judgment about what is a “reasonable” number of species. Genetics is a powerful window into biology, of course. In birds the frequency of extra-pair matings (up to 96% pairs and 75% offspring in fairy wrens, for example (Double and Cockburn 2000)) was unsuspected until genetic testing was applied to parents and offspring. 

The genetic framework in this study is based on 1300 bp of 12S/16S mtDNA (167 individuals, 75 locations), plus 905 bp nuclear ITS sequence in a subset of 22 individuals. Looking ahead, I hope that in their next study of spider phylogeography the authors include COI as an mtDNA locus (full-length sequence is 1500 bp, so that would likely have given the same phylogenetic signal as 12S/16S); this would enable the authors and others to combine their data with the reference COI DNA barcode databases.

I close with an observation about spider genetic data. To my eye, there are surprisingly few genetic data on spiders so far. A search in GenBank for Order Araneae (spiders) shows 9,445 sequences (representing any gene) from 1,852 species (4.6% world total of 40,432 species (World Spider Catalog)). Looking at mitochondrial genes, there are 2,629 COI sequences from 1,071 species (2.6% world) and 2,268 12S/16S sequences from 1,041 species (2.6% world). Thus it appears that only about 1/40th of world’s spiders have a uniform gene locus deposited in GenBank, and on average, only 2 individuals per species have been sequenced. The Spider Tree of Life project plans to sequence 50 loci (including COI and 12S/16S) from about 500 species, so that will help. I hope that arachnologists will follow the approach in this paper and include a standard genetic locus (most usefully COI) as part of species descriptions and analyze multiple individuals per species. Among other applications, this might help identify currently unidentifiable juvenile forms, like the wind-blown “little aeronaut[s]” that arrived on silk threads in vast numbers on the Beagle when it was sixty miles distant from land, November 1, 1832 (Voyage of the Beagle).

Wired, Scientific American highlight DNA-based future of species identification

In October 2008 Wired reporter Gary Wolf profiles birth and rapid growth of standardized DNA-based species identification (ie DNA barcoding). His article centers around time spent in Costa Rica with Dan Janzen, Winnie Hallwachs, and their band of parataxonomists in Area de Conservacion Guanacaste; additional legwork includes visits to worried taxonomists at University of California Berkeley (“Honestly, I never thought it would get this far,” says Kipling Will), and University of Guelph, Ontario. He concludes with an evocative analogy: “barcodes are not just devices to put names on animals; they are also clever traps to catch all the people in the world whose curiosity impels them toward data as if toward light.”

An article in October 2008 Scientific American, with Sci Am’s trademark excellent illustrations, (web version; pdf) examines hows and whys of DNA-based future of species identification (I am co-author with Paul Hebert). After discussing the many practical applications for identifying known species, we  conclude with our own analogy: “Just as the speed and economy of aerial photography caused it to supplant ground surveys as the first line of land analysis, DNA barcoding can be a rapid, relatively inexpensive first step in species discovery.”

DNA plus morphology speeds taxonomy

In May 2008 PLoS One researchers from California Academy of Sciences and University of Guelph analyze morphology and COI barcodes of Madagascar ants in genera Anochetus and Odontomachus.  Their taxonomic revision is “based on arthropod surveys in Madagascar that included over 6,000 leaf litter samples, 4,000 pitfall traps, and 8,000 additional collecting events…from 1992 to 1996”–phew!  Researchers Fisher and Smith used COI sequence data of 501 individuals to speed their analysis and provide an accessible reference for future work. 

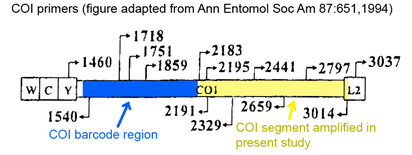
First, COI barcodes enable associating the various caste forms including males and females within species. Second, DNA barcodes provide an additional tool for matching names with type specimens. For example, Meusnier et al have recently applied broad-range primers to amplify a 130 base pair “universal mini-barcode” (this lies within the 648 full-length COI barcode sequence). The mini-barcode can more easily be amplified from older museum material with partly degraded DNA, and usually contains enough sequence information to associate older specimens with more recently collected material. Third, distinct genetic clusters within morphologically undifferentiated ant species suggest avenues for future study. Fourth, DNA barcodes establish a method for future workers, not skilled in ant morphology, to identify specimens. For example, not many persons will be able to recognize males of Malagasy Anochetus by “shortest distance between lateral ocellus and margin of compound eye smaller than maximum length of ocellus. Petiolar node as seen from front or rear with lateral corners rounded, without acute spine or sharp tooth.” There are multiple high-resolution photos of each described species posted on AntWeb; I find these just as mysterious as the text descriptions.

As a test of how DNA barcoding might work for the interested ant novice, I collected the tiny specimen at left in Rincon, Puerto Rico, and submitted its COI barcode to BOLD ID engine. This gave 100% match to Paratrechina longicornis, and on the corresponding  Encyclopedia of Life page, I learned the common name is “Crazy ant”, an invasive species found worldwide, plus found many interesting links including to AntWeb P. longicornis pages. It was amusing to learn that Crazy ants overran Biosphere II and were one factor leading to demise of the project (link to NYT article). Of course not all 100+ Paratrechina spp are in BOLD, and there may be a closely-related species with similar or identical COI barcode sequences as P. longicordis, so more work is needed to build up the database!