The Barcode Blog

A mostly scientific blog about short DNA sequences for species identification and discovery. I encourage your commentary. -- Mark Stoeckle

Subscribe to this blog

Sign up for email notifications

DNA reveals panoply of tiny fish

March 1st, 2011

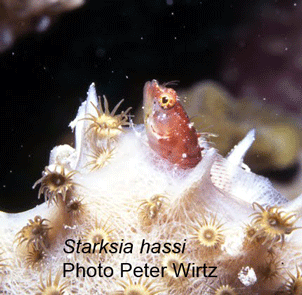
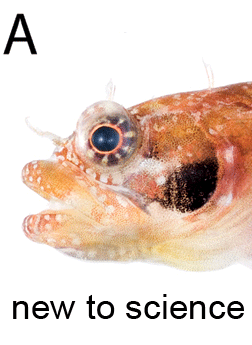
Starksia is a genus of tiny (most less than 2 cm) blennoid fishes found in rocky inshore areas and coral reefs along the Atlantic and Pacific coasts of North and South America and the Caribbean. In 11 February 2011 ZooKeys (open access) researchers from Smithsonian Institution, Ocean Science Foundation, and Nova Southeastern University describe 7 new western Atlantic Starksia species which they first discovered through DNA barcoding.

DNA barcoding revealed divergent clusters within four previously described species and careful re-inspection revealed morphologic characters associated with each genetic cluster.  It is interesting that many of the distinguishing characters are around the head, which may fit with fact that these fish often spend their time largely hidden with only the head exposed. The ZooKeys article is about 51 pages, or about 7 pages per new species, which I think is about average for a species description. If there were a similar printed key for all fishes (about 25,000 named species so far) that would be 175,000 pages long, which is one reason that methods for non-specialists are needed! Of course keys can be posted on the web, as this is, but it is still a challenge to find the right key, especially if you don’t already have a good idea of what you are looking at.

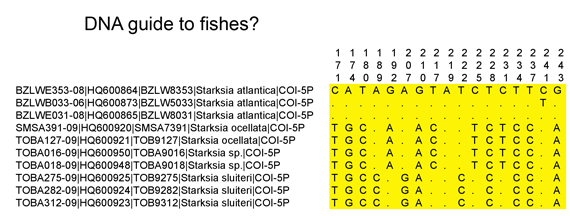
I was surprised that the key did not include barcode sequences of the holotypes (primary specimen chosen to represent the species) (of course these are in GenBank). Even better might be a table of the diagnostic barcode differences among these species, a molecular key.  To try this out, I downloaded the Starksia sequences from Public Projects section of BOLD www.barcodinglife.org, opened in MEGA (free sequence analysis software available at www.megasoftware.net), highlighted all positions that differed among the set, and exported these to Excel including the position numbers which are shown at the top. An excerpt of the output is shown below.

This sort of display could be useful including in a legal setting when you need to document the basis for identification by barcode. The NJ tree gives the right answer of course but it is an abstract representation of the data. A table such as above would show the actual nucleotide sequence differences which are used to generate the tree.

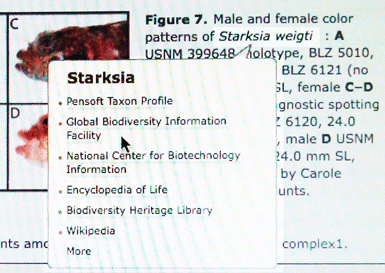
Addendum: I meant to include this very neat feature reading the ZooKeys article online, which is a menu of links that appears if you place your cursor over any species name!


Mexico barcode surprises

February 11th, 2011

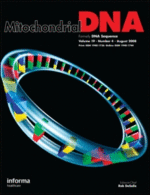
In December 2010 Mitochondrial DNA special issue (open access!) devoted to the Mexican Barcode of Life Initiative (MexBOL), Mexican scientists and colleagues report on barcoding explorations of their megadiverse fauna and flora. A few highlights:

Martínez-Salazar and León-Règagnon from University of Guelph and Universidad Nacional Autónoma de México respectively, examined two morphospecies of Langeronia lung flukes that parasitize Mexican frogs, finding three deeply divergent clusters (approximately 8% uncorrected sequence divergence among specimens from the different regions and 0.3% within). Surprisingly, these clusters were observed in both morphospecies (and did not differ among host species). Based on their results, the researchers conclude that the morphospecies are conspecific, perhaps representing alternative developmental pathways, but it may also be that there are species-level biological differences among the clades not yet recognized. Of note, the 368 bp COI fragment analyzed only partly overlaps the standard barcode region; primers effective for Trematodes are needed.

Cervantes and colleagues (same institutions as above) demonstrated that Common Opposum (Didelphis marsupialis) and Virginia Opposum (D. virginiana), which are sympatric (live in the same area) in Mexico, are readily distinguished by COI barcode (average K2P distances between species are approximately 8%, and within are 1.5%). These species have diagnostic skull morphology but external characters are unreliable, making field identification inaccurate and even museum specimens can be misidentified, including 4 museum specimens in this study.

Zaldívar-Riverón and colleagues from Mexico, Canada, and Argentina applied DNA barcoding to braconid wasps collected during three field trips during 2009 in the Chamela-Cuixmala biosphere reserve, near the Pacific coast. Braconidae is an extraordinarily rich (50,000 -150,000 species) family of tiny parasitoid wasps that attack butterfly larvae, with many species exquisitely specialized to a single host. The researchers obtained barcode sequences from 407 of 483 specimens, and applied computer software (Yule coalescent model) to estimate how many species were present, which turned out to be 185! I’m guessing they sorted specimens to select different morphospecies before sequencing, as it seems improbable that there could be 185 different species among 407 randomly-collected specimens. In this short report, the researchers did not comment on how many of the “barcode coalescent species” correspond to known wasp species. The rate of species discovery did not plateau over the course of the study, pointing to many, many more braconid wasps in just this one area.

At the beginning of the barcode initiative, there was worry from some taxonomists that it wouldn’t work. After 8 years, we know now that a comprehensive library built around taxonomic reference specimens unambiguously names 95% of animal species from mayflies to mammals, and resolves the remainder into small sets of closely-related species. Looking ahead, it seems obvious that one or another analytic approach, such as coalescent modeling described above, will enable construction of a provisional species and higher-level taxonomy from barcode data alone which will be particularly useful for impossibly diverse or poorly-studied groups, such as nematodes. Experts will improve this draft taxonomy as other information becomes available.

I have long thought that the biggest scientific challenge raised by DNA barcoding is not that it doesn’t work to distinguish some closely-related species, but that it works too well–it reveals biodiversity is much more finely divided and highly-specialized than we knew. Even in birds, the best studied large taxonomic group, a comprehensive DNA barcoding survey demonstrated that 24% of bird species that live in Europe and North America are comprised of isolated populations that have been diverging for more than a million years, likely representing distinct species (Johnson J Ornithol 2010; open access). To my mind, the big picture results so far are an exciting provocation–we need to better understand specialization–how do organisms navigate their environment—for example what signals (chemical, behavioral, acoustic, electric, visual?) enable a wasp to find and distinguish one butterfly larvae from another, or to determine whether the larva is already parasitized? Animals can be viewed as highly-discriminating and sensitive detectors of other life forms. A genetic approach might identify parts of the nervous system or sensory system that enable these feats. With better understanding we might construct highly-specific biosensors, say to detect pathogens.

Addendum: Correcting my supposition about whether specimens were sorted prior to barcoding, Dan Janzen tells me that high species counts are the norm when collecting braconid wasps in tropical sites, such that 185 braconid wasp species from 483 specimens is not unusual.


Breath tests for DNA

January 18th, 2011

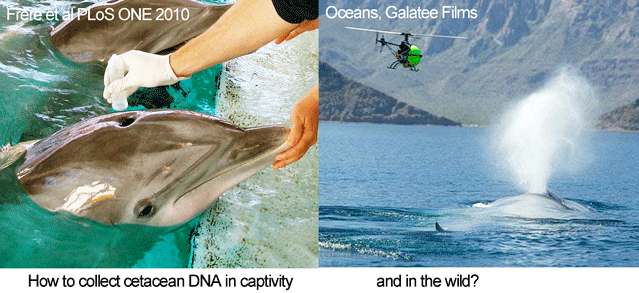
In August 2010 PLoS ONE, researchers from University of Queensland, Georgetown University, and National Aquarium look at feasibility of genotyping cetaceans (whales, dolphins, and porpoises) by sampling blow, the exhalations from blowholes. The standard method for collecting cetacean DNA, dart biopsying, is considered inappropriate in some settings, particularly for young animals. Blow sampling has been used to assess disease in free-ranging cetaceans (Acevedo-Whitehouse et al Anim Cons 2009).

In the PLoS ONE report, Frère and colleagues studied six bottlenose dolphins (Tursiops truncatus) housed at the National Aquarium from which they were able to collect both blood and blow samples. Blow sampling involved holding a 50 mL polypropylene tube inverted over the blowhole of “dolphins trained to exhale on cue.”  Tubes were placed on dry ice for transport to the laboratory, where the presumably adherent blow material was resuspended in 500 μL of TE buffer (this worked better than ethanol), and centrifuged at 3000 rpm for 3 min. Excess TE was removed, and DNA was extracted using a Qiagen DNeasy Blood and Tissue Kit. For all six individuals, mitochondrial and microsatellite DNA profiles from blow matched those from blood. The researchers applied this approach to a wild population of bottlenose dolphins in the eastern gulf of Shark Bay, Australia, using “a modified embroidery hoop with sterile filter paper stretched over its centre,” with successful recovery of mitochondrial DNA from one individual so far.

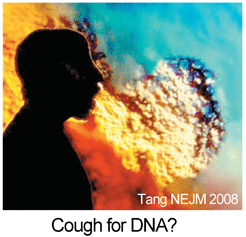
Looking ahead, small, remote-controlled devices might be used for sampling, as were employed in filming cetaceans in Oceans. There may also be applications of DNA breath-testing in land animals (see Schlieren image of extensive turbulent flow following a cough). More generally, the increasing sensitivity of DNA techniques opens a dizzying array of possibilities for DNA-based identification. For example, forensic laboratories now routinely employ “touch DNA” methods sensitive enough to detect the tiny number of cells that are routinely shed when we touch objects, and the presence of amphibians in a pond can be determined by DNA testing a 15 mL water sample (Ficetola Biol Lett 2008).


Expanding access to DNA secrets

January 3rd, 2011

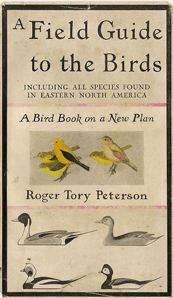
When Roger Tory Peterson’s “A Field Guide to the Birds” was published in 1934, it opened the door to a multitude of persons being able to identify birds, helped create small industry of birding guides and optics, and was a driving force in the much larger social transformation in awareness of the natural world and human impact. I see the library of DNA barcodes as a (near) universal field guide to the immense diversity of multicellular life, with similar potential for large scientific and societal benefits. Of course the library is not complete (so far, >1 M records, >92 K species), but enough work has been done in diverse taxonomic groups to be confident that a library of standardized, short DNA sequences linked to named, vouchered specimens (i.e. DNA barcodes) will enable species-level identification of most multicellular animals and narrow identification to one or few plant species.

So far, it is mostly only scientists who have direct access to DNA secrets. A future in which non-professionals analyze DNA is creeping closer. You can mail a cheek swab to a DNA lab to reconstruct your personal ancestral genealogy ($150) or check paternity ($400). Whole genome sequencing is available too, but to my reading this is too expensive for now ($20,000) and the results and interpretation are not generally useful. Kits for DNA analysis are already in use in high school classrooms and, closer to home, educational DNA barcoding looks to be around the corner. In December 20, 2010, Bio-Rad Laboratories, a scientific supply company, announced a partnership with Coastal Marine BioLabs (CMB) to develop “DNA barcoding instructional activities for classrooms.” CMB has been active in engaging high school students in generating and submitting reference data to the BOLD database. I expect the potential market for DNA barcoding kits in education is large.


Cool new barcode app

December 14th, 2010

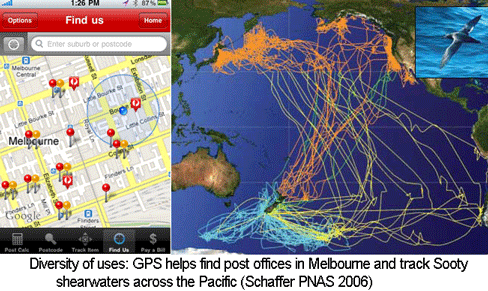
The US Global Positioning System (GPS), consisting of 24 to 32 satellites in medium earth orbit, cost $32 billion to develop and is supported by an annual budget of $1 billion. When the high resolution GPS signal was first made available to the public in May 2000 by President Bill Clinton, I imagine that few persons anticipated how useful it would be. Ten years later there are numerous, diverse applications, ranging from a smartphone app for finding the nearest post office in Australia to tracking animals across the Pacific. Like GPS, the Barcode of Life Database (BOLD) is a public, large-scale technology infrastructure resource. Similar to the trajectory with GPS, I expect that over the next 10 years BOLD will enable an expanding array of applications useful for students, consumers, commercial entities, regulators, researchers, and probably some just for fun.

In November 2010 Molecular Ecology (request pdf from author) researchers from University of Guelph, Canada and Institut National de la Recherche Agronomique, France report on “molecular analysis of parasitoid linkages (MAPL)”. As background, parasitoid insects–many or most are wasps (order Hymenoptera)–lay eggs in the larvae of other insects, primarily Lepidoptera (butterflies and moths) and  Diptera (flies). Host mortality may exceed 90%, and many parasitoids serve as useful biocontrol agents for agricultural pests. Parasitoid wasps are generally tiny and hard to distinguish morphologically, and identifying hosts may take years of patient observation. Recent molecular data show unexpected diversity and host specificity, i.e. many parasitoid species thought to be generalists are in fact comprised of multiple distinct lineages each limited to a single host.

In this study, Rougerie and colleagues looked at whether it was possible to identify the hosts by looking for leftover DNA in the abdomen of adult wasps. As an aside, the general approach in building up the barcode reference library for animals is to use broad-range primers that amplify COI from a wide taxonomic array of specimens. Now that parts of the library are established, it is possible to make use of the accumulated data to design primers that amplify specific taxonomic groups. Such taxon-restricted primers can help address interesting questions. In this study, researchers utilized two sets of primers, one set (primarily LepF1/LepR1) that amplified COI from the wasps and one set (LepF1/MLepR1) with a reverse primer that was specific to the potential hosts, namely Diptera and Lepidoptera. The first set successfully amplified COI from single legs of 297 adult wasp specimens thought to comprise more than 90 species and 20 genera. Using the same DNA extracts, the host-specific primers yielded PCR products from only 9 (3%) of these specimens, demonstrating good selectivity. Rougerie and colleagues then prepared DNA extracts from the abdominal segment of 3 species of hand-reared wasps (so that the host species were known), collected immediately after emergence. 29 (24%) of 120 specimens yielded readable PCR products, of which all except one matched to the known lepidopteran host species.  The authors conclude that “MAPL has immediate applications in the agricultural sciences by facilitating selection of biological control agents” and that it “will drastically accelerate the registration of host-parasitoid associations and that the development of similar approaches for other orders of insects with complete metamorphosis will  be equally productive.” I look forward to these new apps!


How to make an indentification machine

November 4th, 2010

Successful automation often involves machines that carry out tasks differently than persons. For example, a Coulter counter (developed by Wallace H. Coulter, an American engineer), analyzes blood cells by electrical charge, producing a detailed report of red and white cell types faster and more cheaply than does a technician examining a blood smear under a light microscope.  As another case, machine identification of commercial products is enabled by a UPC bar code, which represents a product name in a digital format that can be “read” almost instantaneously by a laser scanner. In a similar way, DNA barcoding “reads” the digital code of DNA, associating that with species names in a reference database, opening the door to fully or partly automated identifications. In 9 September 2010 Nature, scientists from London Natural History Museum, Louisiana State University, and University of Plymouth, UK, propose a different route to automate taxonomic identification, namely, teaching computers to do morphologic pattern recognition. Now that we are on the threshold of “anyone, anywhere, anything” identification with DNA barcoding, this seems a step backward.

I see three major challenges that limit any morphology-based identification system: naming an organism from bits and pieces, recognizing look alikes and life stages, and the diversity of diagnostic features requiring specialized equipment. On the other hand, DNA is the same whether from an intact specimen or an unrecognizable stomach fragment, readily distinguishes look alikes in any life stage, and can be analyzed using the same equipment regardless of specimen. More generally, at the end of the day, little scientific insight will have been gained from a system that distinguishes life forms by the multitidinous particulars of appearance, whereas a library of DNA barcodes linked to named specimens offers a broad view of species-level differences across the diversity of life.

According to MacLeod and colleagues, “a [DNA] bar code isn’t useful until the reference species has been identified by experts”. This makes no sense to me. All large barcode surveys of animals, from ants to fish, have revealed hidden genetic divergences, in many cases leading to recognition of new species.  In fact, DNA barcoding is fast way of screening existing collections for unrecognized species. In this same section, as part of discounting a DNA approach, they state “researchers frequently need to identify non-living objects as well as living ones”. I don’t understand how this is an objection, since, for example, DNA barcodes from ancient bone fragments have been used to define species of extinct flightless Moa (Lambert et al J Heredity 2005).

I know from iPhoto’s remarkable ability to recognize individuals that computers are getting better at pattern recognition. Further development focused on taxonomic specimens may lead to useful tools. However, this seems unlikely to lead to a widely applicable automated system. In a study cited by the authors, phytoplankton identifications by 16 marine ecologists were compared to those with DiCANN, a machine learning system (Culverhouse et al Marine Ecol Prog Series 2003). The authors of that study conclude what is likely to be generally true about morphology based identification:   “In general, neither human nor machine can be expected to give highly accurate or repeatable labeling of specimens”.


One biodiversity database to the next

October 13th, 2010

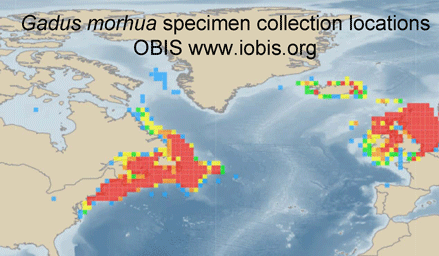
Jumping between biodiversity databases is getting easier. For example, typing in “Atlantic cod” at Ocean Biogeographic Information System (OBIS) takes you to a Gadus morhua species page summarizing 616,444 records, a zoomable map of its geographic range based on specimen collection locations, and direct links to G. morhua pages in other databases, including, for example, Barcode of Life (BOLD), Encyclopedia of Life (EOL), Catalog of Life, World Register of Marine Species (WorMS), and Google images, among others. Having all that, inspired by Matt Damon’s character in The Bourne Ultimatum, we want to take more leaps–perhaps to G. morhua pages in Arkive, Biodiversity Heritage Library, FishBase, and/or GenBank?

Something new is having links to Encylopedia of Life species pages embedded in research articles (so far in some papers in PLoS ONE; for an example, see shark names in Ward-Paige et al 2010 PLoS ONE). Having direct links to literature sources is a wonderful enhancement of research articles, and I believe that species name links will be equally valuable, particularly for biodiversity literature, so I hope this catches on. Species name links have potential to increase the audience and impact of research papers, since many otherwise interested persons will not recognize scientific names or will be entirely unfamiliar with the organisms being studied.


Ground beetles join in

September 27th, 2010

On September 25, 2010, BOLD passed 1 M barcode records, and the International Barcode of Life ( iBOL) was officially launched in Toronto, Canada, with a goal of 5 M records representing 500 K species in 5 years, the largest biodiversity genomics project to date. In terms of DNA sequencing, the iBOL targets (5 x 10⁶ barcodes x 650 bp/barcode = 3.3 x 10⁹ bp) are equivalent to the Human Genome Project (human genome = 3.4 x 10⁹ bp). However, whereas HGP involved sequencing DNA samples from a few individuals, the DNA barcode library is built by thousands of scientists examining thousands of individual specimens, one by one.  So a big challenge is obtaining, identifying, tracking, processing, and preserving millions of specimens.

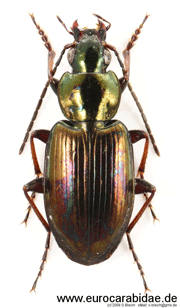
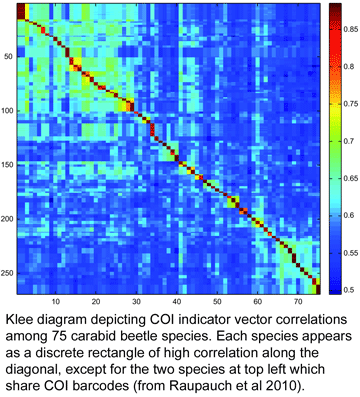
What are recent arrivals to library? For one example, in current Frontiers Zool, researchers from Germany and US (I am co-author) report on DNA identification of Central European ground beetles (family Carabidae). This family comprises “no less than an estimated 40,000 described species that inhabit all terrestrial habitat types from the sub-arctic to wet tropical regions,” making identifications a challenge for taxonomists and non-specialists alike. Raupach and colleagues successfully amplified and sequenced COI barcodes and nuclear ribosomal DNA expansion segments D3, V4, and V7, from 344 specimens representing 75 species in 28 genera (average 4 specimens/species, range 2-13). Most specimens were preserved in 96% alcohol for 1-2 years; some were stored as dry pinned specimens for up to 12 years. 73 (97%) species were resolved by COI, whereas the 3 nuclear markers individually resolved a smaller proportion, 81% (D3), 57% (V4) and 87% (V7), and combining the 3 nuclear markers gave 95% discrimination. The one species pair with shared COI haplotypes also showed identical nuclear markers.  Two species exhibited distinct COI clusters (intra-specific p-distances 2.7%, 3.8%), 1 of which also had distinct nuclear haplotypes.

To my knowledge, this is the first taxonomic paper  with a “Klee diagram” depicting indicator vector correlations among COI barcode sequences. As developed by mathematician Larry Sirovich and his colleague Yu Zhang (Sirovich et al PloS ONE 2010), indicator vectors are digital representations of DNA sequences that “preserve diagnostic character probabilities, enable automated classification of test sequences, and generate high-information density single-page displays” such as Klee diagram shown here. According to BOLD Taxonomy Browser, there are DNA barcodes for 495 carabid beetle species so far, so I look forward more of the remaining 39,505 or so species joining the barcode library, and dream of a comprehensive indicator vector/Klee analysis of ground beetle family.

In closing, professional and non-professional insect specialists alike may may enjoy recently released film “Beetle Queen Conquers Tokyo” by Jessica Oreck, a lyrical look at beetle and insect fanciers in Japan.


Don’t barcode alone

September 10th, 2010

Barcoding is a standardized approach to DNA-based species identification. The essence of standardization is an agreement among researchers and practitioners to rely on one or a few defined gene region(s). Standardization makes it possible for researchers to work together to build comprehensive sequence libraries–it is simply not possible for any single group of researchers to collect and analyze the millions of specimens needed to establish a widely-useful reference database. And, looking at the application side, standardization enables species-level identifications without having to know in advance what taxonomic group the specimen belongs to. The standard regions so far are Hebert 2005 COI segment for animals and defined segments of matK and rbcL for land plants. Agreeing on standard barcode regions is a social as well as scientific process–achieving consensus on COI and matK/rbcL are major achievements.
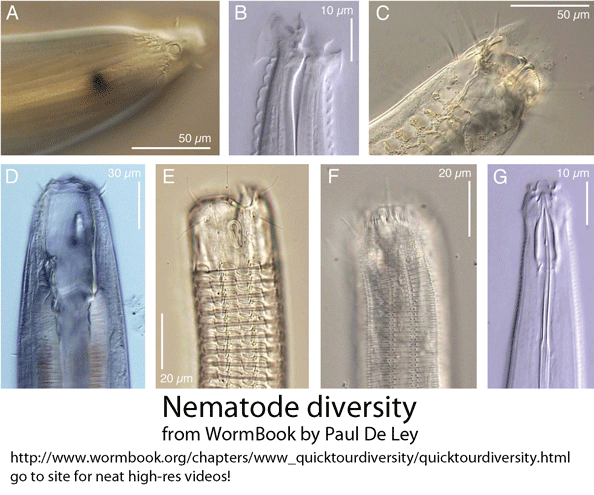
In March 2010 Hydrobiologia, researchers from Indian Institute of Science Education and Research-Kolkata, India, and Plymouth Marine Laboratory, England, report on new primers for amplifying 18S rRNA as a means of barcoding marine nematodes from environmental samples. As background, nematodes are an enormous phylum of mostly tiny and often parasitic worms, including important human, plant, and animal pathogens, and are comprised of many deeply divergent lineages, challenging species-level identification. Despite their ubiquity, diversity, and biological importance, I imagine that most persons are unfamiliar with nematodes. Small subunit (SSU) rRNA (also known as 18S rRNA) is the backbone for nematode molecular phylogeny (Holterman et al 2006). For species-level identification, to my knowledge no single standard has emerged (Blaxter et al 2005, De Ley 2005). SSU/18S rRNA often does not distinguish among species, and so far it has been difficult to reliably amplify COI barcode region from nematodes, presumably due to sequence diversity at primer binding sites. If not COI, then standardizing on a nematode barcode will involve researchers agreeing on defined segment(s), perhaps somewhere in the 7.2 kb ribosomal RNA gene complex.

Back to the paper under discussion–Bhadury and Austen compared two 18S rRNA primer sets: one, previously described (by same authors), which amplifies approximately 345 bp near the 5′ end of 18s rRNA gene, and a new set, which amplifies a 427 bp segment from near the middle of the gene. According to my analysis, these two amplicons, which each represent about 1/5 of 18S rRNA gene, have no overlap. Why select a segment of 18S rRNA as a potential barcode, given that full-length 18S is known to show limited species resolution? In the 2006 paper cited above, the authors explored possible DNA barcoding loci, reporting that “further evaluation with the 28S rRNA, 16S rRNA and COI genes was abandoned as a result of unreliable PCR amplification with several representative marine nematode taxa.” Designing broad-range primers for barcoding nematodes is certainly challenging; this 2006 analysis, based on single specimens of 26 nematode species in 13 families, seems too sparse to make useful conclusions. As to species resolution with 345 bp 5′ 18S fragment, although the abstract states “over 97% of specimens sequenced were correctly assigned,” this turns out to refer to assignments at species OR genus level, and by my reading includes cases that matched to two different genera (with identical 345 bp 18S sequences).

To evaluate the 18S primers, DNA was isolated from two 0.5 g samples of estuary sediment collected in New Jersey, pooled, amplified, and cloned. 60 and 40 clones generated with first and second primer sets, respectively, were sequenced. From first set, 16 haplotypes (comprising 45 clones) showed 89-97% BLAST identity with known nematode sequences and the remaining 4 haplotypes (15 clones) were most similar (88-96% BLAST identify) to non-nematode 18S sequences. This led the researchers to design the second set of primers to reduce co-amplification of non-nematode sequences. The second set produced 6 haplotypes (40 sequenced clones); all were similar or identical (90-100% by BLAST) to published nematode sequences.

Designing primers that selectively amplify barcodes from certain taxa is important in some situations, particularly when analyzing mixtures, such as environmental samples as done here, and also to selectively amplify hosts vs parasites, or ingested DNA in stomach contents vs organism, for example. The authors conclude that “the databases…need to be populated with new full-length 18S rRNA nematode sequences from different biogeographic locations.” More data is always good, but it remains to be seen where efforts should be placed. In nematodes it may be there is a trade-off between having broadly-applicable primers and achieving good species resolution; here more exploration is needed. Agreeing on barcode region(s)s might help lift nematodes, which likely outnumber insects, from obscurity!

Addendum 10 sept 2010 4:10 PM: Dan Janzen points out that there is more to barcoding standards than the above might imply. To whit, the COI barcode is a precisely defined 648-bp segment of COI, and, for inclusion in reference library, barcode sequences need to be accompanied by voucher specimen information, bidirectional trace files with a minimum quality score, and primer sequences.

Bees conduct floristic survey

August 30th, 2010

As in last week’s post on what deep-water sharks eat, DNA-based species identification helps reveal how animals live, not just what species they are. Diet analysis can also provide a survey of what prey/food species are in the local environment. In April 2010 Diversity, researchers from Université Grenoble, France, apply standardized DNA identification targeting chloroplast trnL intron P6 loop and massively parallel sequencing to examine plant DNAs in honey. The traditional approach for determining geographic and botanical origins of honey is microscopic examination of pollen, which requires expert training.

As previously described, the trnL P6 intron is tiny (10-143 bp) and has highly conserved flanking sequences, enabling successful amplification of DNA from many or most plants, including from degraded samples. The major disadvantages are relatively low taxonomic resolution, which is improved if sequences are matched to local rather than global flora, and a modest reference library.  Interpreting PCR-based results from mixed samples can be complicated, as there may be preferential amplification of some sequences and not others.. To my knowledge, this has not been studied for trnL P6 approach in general or as applied to honey in particular.

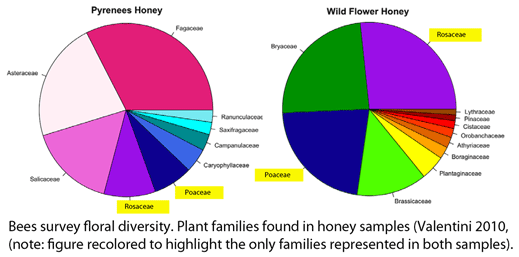
Valentini and colleagues extracted DNA from 10 mg samples of honey (one from a commercial “wild flower” blend and a one from local Pyrenean region) using a standard kit (Qiagen), amplified the P6 loop with broad-range primers, and performed pyrosequencing on a Roche Diagnostic G20 system. Different nucleotide sequence tags were applied to the two samples, enabling both to be analyzed in a single pyrosequencing run; the authors point out that tagging could be expanded to enable analyzing hundreds of samples in a single run. A total of 3,671 and 2,191 sequences represented at least 3 times were obtained from Pyrenean and mixed wild flower honey, respectively, which were matched to 22 and 26 plant taxa, respectively. In terms of taxonomic resolution, these were mostly family or generic level assignments: 9 families/subfamiles/tribes, 7 genera, and 6 species (Pyrenean), and 14 families/subfamilies/tribes, 8 genera, and 4 species (mixed wild flower). In both samples, the five most abundant taxa comprised about 75% of total sequences.

Valentini and colleagues note that “several of the plant taxa identified were not the result of nectar collection” (moss, fern, pine), and were presumably due to wind transport from nearby plants. The fern species identified, Athyrium vidalii, which comprised 1.9% of sequences, is distributed in China, Japan, Korea, and Taiwan, evidence for the geographic origin of the honey. Documenting geographic origin of honey products is of commercial interest.

A primary advantage and rationale for DNA barcoding is that standardizing on one or a few regions enables a comprehensive reference library and broadly-applicable testing methods. The trnL P6 target utilized in the present study is not part of the published community standard of rbcL + matK targets (A DNA barcode for land plants, Hollingsworth et al PNAS 2009), so it remains to be seen when this will be widely used. In any case,  authors conclude that their method is “fast, simple to implement, more robust than classical methods” and “opens new perspectives in the analysis of honey diversity.” I look forward to learning more!


Contact: mark.stoeckle@rockefeller.edu

About this site

This web site is an outgrowth of the Taxonomy, DNA, and Barcode of Life meeting held at Banbury Center, Cold Spring Harbor Laboratory, September 9-12, 2003. It is designed and managed by Mark Stoeckle, Perrin Meyer, and Jason Yung at the Program for the Human Environment (PHE) at The Rockefeller University.

About the Program for the Human Environment

The involvement of the Program for the Human Environment in DNA barcoding dates to Jesse Ausubel's attendance in February 2002 at a conference in Nova Scotia organized by the Canadian Center for Marine Biodiversity. At the conference, Paul Hebert presented for the first time his concept of large-scale DNA barcoding for species identification. Impressed by the potential for this technology to address difficult challenges in the Census of Marine Life, Jesse agreed with Paul on encouraging a conference to explore the contribution taxonomy and DNA could make to the Census as well as other large-scale terrestrial efforts. In his capacity as a Program Director of the Sloan Foundation, Jesse turned to the Banbury Conference Center of Cold Spring Harbor Laboratory, whose leader Jan Witkowski prepared a strong proposal to explore both the scientific reliability of barcoding and the processes that might bring it to broad application. Concurrently, PHE researcher Mark Stoeckle began to work with the Hebert lab on analytic studies of barcoding in birds. Our involvement in barcoding now takes 3 forms: assisting the organizational development of the Consortium for the Barcode of Life and the Barcode of Life Initiative; contributing to the scientific development of the field, especially by studies in birds, and contributing to public understanding of the science and technology of barcoding and its applications through improved visualization techniques and preparation of brochures and other broadly accessible means, including this website. While the Sloan Foundation continues to support CBOL through a grant to the Smithsonian Institution, it does not provide financial support for barcoding research itself or support to the PHE for its research in this field.