Thanks to David Craig, editor of RealClear Defense, for publishing on 20 June 2026 Jesse’s piece about the late Andrew W. Marshall, The Questions of Andy Marshall.
Andrew W. Marshall (1921 – 2019) developed methods to analyze long-term geopolitical and military competitions at the RAND Corporation (1949-1973) and then as founding director of the U.S. Department of Defense’s Office of Net Assessment (ONA) from 1973 to 2015. This essay is based on one of a series of interviews conducted by Melissa Flagg and Smiljana Antonijevi? of the Andrew W. Marshall Foundation to help build a picture of Marshall’s work and influence.
The Istituto Superiore di Sanità (Italy’s equivalent of the USA National Institutes of Health) convened an International High Level Forum, whose website is here. Thanks to ISS director Dr. Andrea Piccioli for involving Jesse, some of whose remarks are included in this 4-minute video summary of the forum. Below is Jesse’s abstract.
Human Health and the Anthropocene Ocean draft 2 June 2026Jesse H. Ausubel
Abstract: I will consider the oceans and human health in two ways. I will speak of the natural oceans as a source of risk and trauma, even death, for the millions who work or travel on or below the ocean surface. The good news is humanity has greatly reduced the danger of the natural oceans to our health. The pillars of healthy maritime practice are safety, environment, education, and working conditions. Many opportunities exist to reduce illness, fatigue, and accidents further, for example, by wearable sensors and biodiaries. Then, I would like to speak about ways humans are changing the oceans, creating an “Anthropocene Ocean” full of products and by-products of human industry. The worrisome news is that we may be introducing and lifting threats to the well-being of the billions who live near the Anthropocene ocean, especially through pollution coming from land-based and atmospheric sources and from the sea itself. Major maritime nations need to lead in identifying and accelerating development and adoption of technologies to promote a clean ocean. These could range from cleaner, more efficient motors and fuels to new forms of remediation and waste management; better ways to monitor, track, and map marine pollutants and progress toward a clean ocean such as aerial remote sensing, genomics, and hydrophone arrays; and better technologies for emergency cleanup.Key words: biosurveillance; biodiaries; Anthropocene ocean; healthy ocean
In a 9-minute episode of The Miller Report: Real Clear Journalism, Maggie Miller sits down with Jesse Ausubel, Director of the Program for the Human Environment at Rockefeller University, to discuss the future of energy, environmental realism, and what America’s energy system could look like in 2030 and 2050.
The Intergovernmental Panel on Climate Change has recently retreated from its fantastical “8.5” scenarios, as reported in a recent column by Michael Shellenberger on the capture of the IPCC by those with an alarmist bias that cites Jesse Ausubel. The 8.5 scenario originated in the year 2000. But the Business-As-Usual scenario in the first IPCC report in 1990 was equally extreme. As a reviewer of the first IPCC report, Jesse critiqued the BAU scenario as “Brezhnevite” but his review was totally ignored.
Below are a few paragraphs that repeat Jesse’s 1990 critique of the IPCC BAU scenario from Jesse’s 1994 paper Technical Progress and Climatic Change published in Energy Policy 23 (4/5): 411–416 1995 (also pp. 501-512 in “Integrated Assessment of Mitigation, Impacts, and Adaptation to Climate Change,” N Nakicenovic, WD Nordhaus, R Richels, and FL Toth (eds), International Institute for Applied Systems Analysis, Laxenburg, Austria, 1994).
Excerpt: This possibility is illustrated by the final technological trajectory discussed here, that of decarbonization, or the decreasing carbon intensity of primary energy, measured in tons of carbon created per kilowatt year of electricity (or its equivalent) (Figure 8). As is evident, the global energy system has been steadily economizing on carbon. Without gloomy climate forecasts or dirty taxes.
Figure 8. Carbon intensity of primary energy, 1900-1990, with projections to 2100. The projection stopping the historic trend of decarbonization is the IPCC 1990 “Business as Usual” (BAU) scenario; IPCC IS92a and ISP2c are high and low energy scenarios from the 1992 Supplement. Sources: Intergovernmental Panel on Climate Change (IPCC), 1990, 1992; Ausubel et al., 1988.
In a peculiar choice of words, the Intergovernmental Panel on Climate Change in 1990 designated as “Business-as-Usual” its scenario which stifled and even reversed the 130-year trend. “Business as Usual” was a scenario of technical regression. It essentially ignored the scientific and technical achievement of the past 300 years, including the achievements that make identification and estimation of the greenhouse effect possible. [End of excerpt.]
It’s good to see the lunatic BAU and 8.5 scenarios put in their proper place, if only after 35 years and a lot of harm. All this was in the open literature. Science is not always scientific.
Texas geologist Scott Tinker interviews Jesse Ausubel on “Enduring Environmental Realities” for 20 minutes beginning at 6:25 of this recording of the annual Energy Future Forum of the National Center for Energy Analytics (NCEA). Iddo Wernick is a Fellow of the NCEA. The Forum was presented by RealClearEnergy in partnership with the U.S. Chamber of Commerce on Friday 1 May in Washington DC. The agenda and entire program are here.
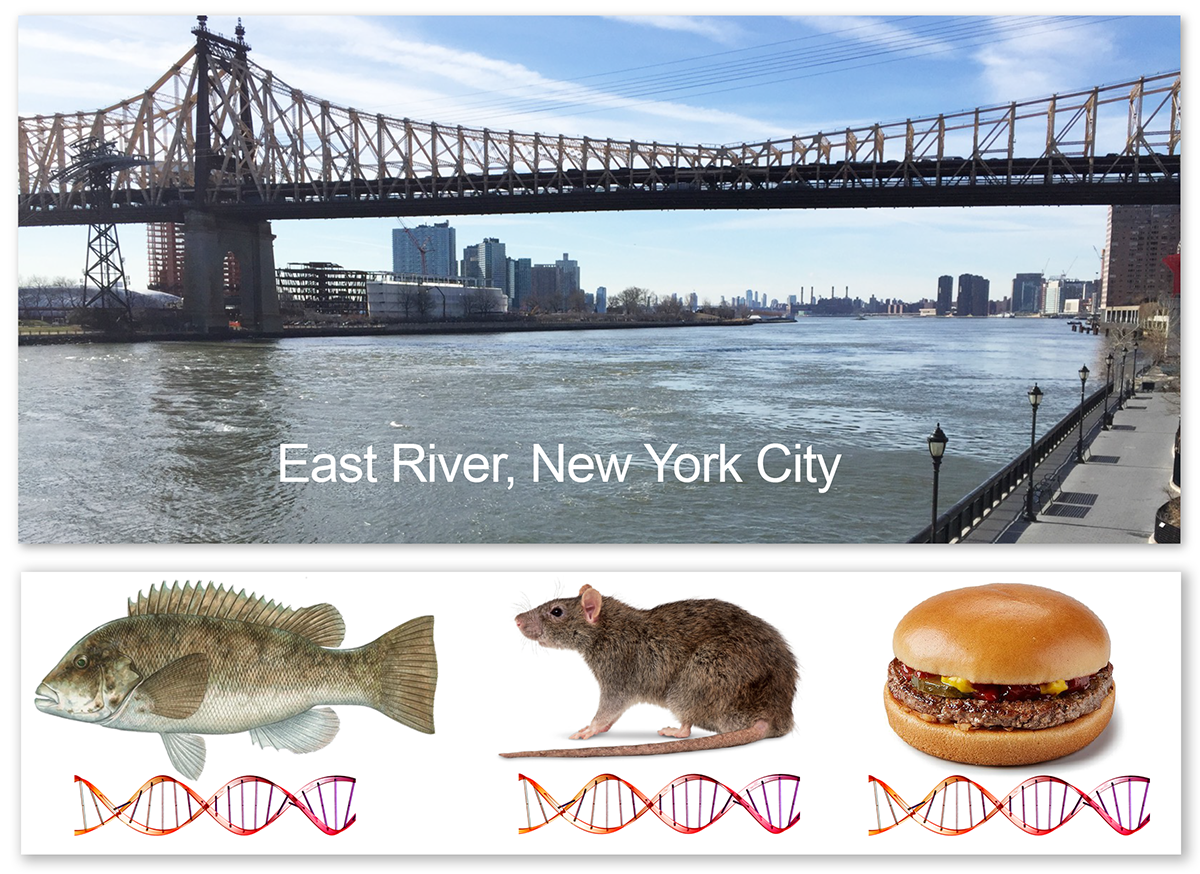
Mark and Jesse’s year-long study of East River eDNA “Biomonitoring in the Anthropocene: Urban estuary environmental DNA tracks marine fish, terrestrial wildlife, and human diet” is published today in PloS ONE. The findings suggest that urban waterways anywhere could become continuous biosensors, tracking biodiversity, habitat restoration outcomes, and human impacts in real time. Among the most novel results of the weekly East River sampling were genetic indicators of human food consumption, of rat and other terrestrial wildlife populations, and the discovery of newly abundant fish species, thought to reflect the success of habitat restoration efforts. Our lively press release is posted here and graphic highlights here.
We post Jesse’s talk on “Power and Climate” delivered to executives of the US electric power industry in 2019. The 30-page pdf includes text (13 pages) followed by 17 pages of figures. Some highlights were excerpted here in February 2025, which makes us think the talk is standing the tests of time and earns posting.
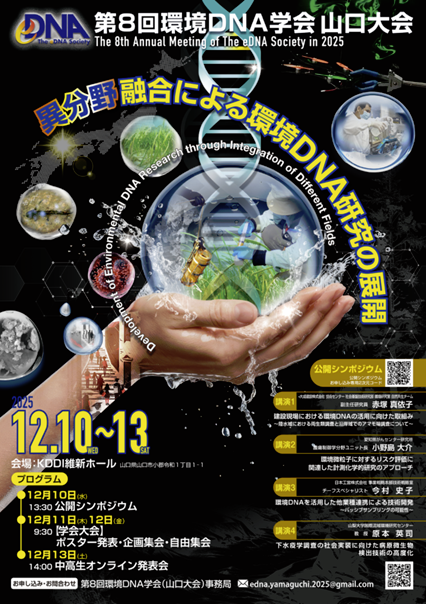
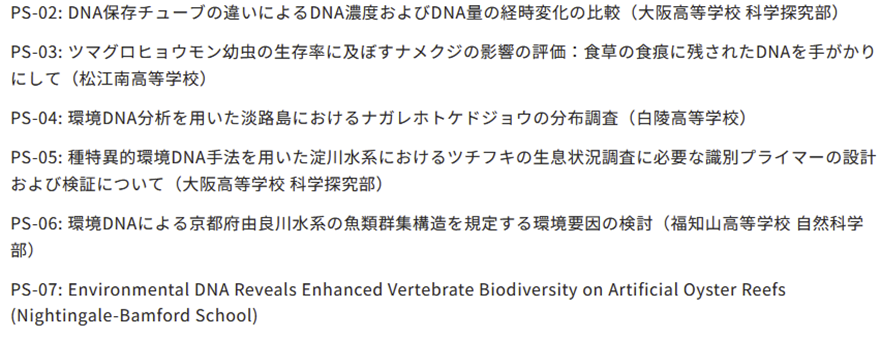
Arya Kambhampati, Manhattan high school senior mentored by PHE’s Mark Stoeckle, presented on 13 December remotely to the 8th Annual Meeting of The eDNA Society in Yamaguchi, Japan on using eDNA to measure vertebrate biodiversity on oyster reefs such as those now being encouraged in New York Harbor. Congratulations, Arya, on your first talk to a major scientific conference.