More on BARCODEs as BIG DATA: Visualizing evolutionary constraint (II)

Last week’s post looked at amino acid variation among avian BARCODEs (11,000 sequences, 2,700 bird species). The findings were that common variants (present in >0.1% of sequences) are few and restricted in terms of types of amino acid substitutions, while rare variants (present in <0.1% of sequences) are many and diverse, the latter consistent with our published observation (PLoS ONE 2012 e:43992) that most rare variants in this dataset are sequencing errors.

Here I follow-up on this observation to look more closely at the same dataset, this time asking what is the relationship between variant frequency and number? For this analysis I separated probable biological rare variants (found in 2 or more individuals of a species) from those that were likely sequencing errors or contained in pseudogenes (more details in PLoS ONE paper).

As shown in figure below, this analysis gave what looks like a surprisingly simple relationship between variant number and frequency, which presumably reflects some evolutionary principle assuming it is not an accidental feature of this particular dataset. It may be of interest to analyze amino acid variant frequency and number among BARCODE datasets from other taxonomic groups.

A larger version of this figure is available here.


Indicator Vector (Klee Diagram) software

Mark Stoeckle and Cameron Coffran have posted the software for the indicator vector/Klee method to analyze and display large sets of aligned sequences–it readily displays patterns among >10K sequences in a single-page figure.  See https://phe.rockefeller.edu/barcode/klee.php  The Klee diagrams beautifully show the genetic structure of biodiversity for DNA barcode and other sequences.

Visualizing amino acid variation in a large BARCODE dataset

In PLoS ONE 2012 e:43992 Kevin Kerr and I reported that most of what appeared to be rare nucleotide and amino acid variants in avian BARCODEs were in fact sequencing errors, based on finding these were strongly concentrated at the ends of the amplified barcode segment. Here I look at the nature of common and rare amino acid substitutions in this same dataset of 11,333 avian BARCODEs from 2,709 species. Do these support our inference that rare variants are mostly errors?  I believe the large figure below says yes.

The more common variants (present in >0.1% sequences) are shown at top and the rare variants (present in <0.1% sequences) at bottom. The left shows variants at each of the 216 amino acid positions, sorted according to the mode amino acid (shown in gray) and grouped by codon 2nd position nucleotide. At right, the proportion of substitutions for each amino acid is shown, weighted according to the modal amino acid frequency.

The main observation is that common variants are relatively few in number (69) and type (mostly isoleucine (I) <–> valine(V)), suggesting strong biological constraints on allowable variation.  On the other hand, rare variants are many (377) and diverse, which is what one would expect if these are largely sequencing errors.

A larger version of the figure is here, and the Excel file used to generate the figure is here.

I think there is potentially more of interest here in terms of allowable substitutions. For example, Breen et al Nature 2012 490:535 recently demonstrated that molecular evolution is highly constrained by epistasis, such that most mutations are not allowed in a given context, which is presumably what underlies the restricted variation in avian COI. (Breen and colleagues calculations were based on alignments of 2 nuclear and 14 organellar genes, the latter including COI.) In a general way this makes sense–birds can have different kinds of feathers but none have scales like fish. It might be of interest to compare COI amino acid variation in birds to other barcode datasets such as fish or lepidoptera.

Happy Thanksgiving!

PW AutoBiography

We are privileged to post Paul Waggoner’s superb autobiography, “Appanoose to Connecticut.” Appanoose is the Iowa county where Paul was born. The memoir includes extraordinary accounts of the drought and hard times of the 1930s and development of agricultural research in the U.S.

Kingdom of the Oceans

The spectacular 4-hour video series with English narration deriving from the 480 hours of film taken by Jacques Perrin & Co. for the Galatee Oceans project will begin to air 15 December 2012 in the UK as “Kingdom of the Oceans” on the National Geographic Channel.  See https://natgeotv.com/uk/kingdom-of-the-oceans

The show will air in the US on the Nat Geo Wild Channel on Sunday March 10th & 17th 2013 from 8-10pm Eastern.  The show is also airing globally on the Wild Channel but each region does its own scheduling (hence the UK broadcast on Dec 15) .  Later in 2013, Nat Geo will re-air the show in the US on the National Geographic Channel during the  Friday night expeditions programming time slot.

We would expect the English-version DVD will also be available soon.

No footage is repeated between the original 90-minute film and the 4-hour series, so prepare to be dazzled again. Francois Sarrano and Stephane Durand prepared an excellent narration. The series generously acknowledges the Census of Marine Life and the Alfred P. Sloan Foundation.

The series offers great opportunities for education about the oceans and marine life, for example, panel discussions or question-and-answer sessions, after viewing the segments.

Thanks to our colleagues at Nat Geo.

Macroscopes for Science lecture

On Tuesday 6 November Jesse Ausubel delivered the Enrico Fermi Colloquium on “Macroscopes for Science” at the University of Florence, Italy, hosted by laser expert Roberto Bini. The hour-long audio of the lecture is at the link above, with the slides also showing once their turns come.

Barcode stats reveal progress, challenges, opportunities

As Dirk Steinke’s recent blog post demonstrated, since the seminal 2003 Proc Royal Soc London B Biol Sci paper by Hebert, Cywinska, Ball, and DeWaard, barcoders around the world have been generating scientific papers at a steadily growing pace. For more on the big picture, here I share three barcode stat visuals put together in preparation for the Third European Congress for the Barcode of Life (ECBOL3) in September.

Q: How many specimens have been barcoded?

A: A lot.

As of September 2012, about 600,000 specimens have barcode records in GenBank, about half of which qualify for BARCODE[keyword] based on CBOL data standards. This reminds me to recognize the special challenges barcoding has as a genomics project–the target number of specimens is enormous and each requires expert identification and long-term storage in a museum or herbarium.

In addition to GenBank/BOLD public records, at the time of the survey there were another 1.2 million barcode records in BOLD  which lack species names. Probably most represent what Rod Page called “dark taxa“–difficult to identify specimens from undescribed species. It is an unsolved puzzle how much effort to devote to barcoding specimens that can’t or haven’t been identified to species. On the one hand this approach speeds species discovery, as documented in blog post cited above; on the other hand, many specimens will wait a very long time for the right taxonomist to come along and in the meantime the sequences alone may not be very useful to science. I should point out that for many dark barcodes, the sequences are public, are labeled with an order level identifier (e.g. Vertebrata) and BIN (see below), and include specimen photographs.

One possible solution is assigning “names” based on barcode sequences themselves, such as Barcode Index Number (BIN) system instituted in BOLD. This sidesteps the wait for an expert human to assign a traditional Latin binomial but does not link the sequence to other biological information about the organism the way a species name does. Researchers recently estimated there are about 8.7 million eukaryotic species, of which about 2 million are named  (Mora et al PLoS Biol 2011). Given the very large array of undescribed (mostly small) life, how should barcoders proceed?  The Human Genome Project seized on what was a radical idea and technologically difficult at the time–namely,  sequencing the whole genome rather than just the expressed genes. Does an analogous approach of sequencing the whole eukaryotic biome of 8.7 million predicted species make sense?  Let’s say we had sequences for all these forms–what new knowledge or capabilities would we have? I favor a stepwise approach focused on barcoding organisms already named, particularly those are already in collections and those important to society. There will be plenty of species discovery along the way.

Other dark barcodes are simply records for which the researchers have assigned a species name but are not posting it publicly. The importance of making sequence data public quickly was recognized at the 4th International Barcode of Life Conference held in Aidelaide last year (for one example of rapid publication of DNA barcode data see Schindel 2011 ZooKeys). Open access, data sharing, and transparency have been embraced by many scientific fields and their funders and I hope barcoders already have or are moving to adopt these principles.

Q: How many species have been barcoded?

A: A lot.

GenBank holds barcode sequences for about 100,000 species, mostly insects, vertebrates, and plants, and about 40,000 qualify for BARCODE keyword. Nearly all BARCODE records so far are from animals, mostly lepidoptera and vertebrates.


Q:  What groups important to science or society have few barcodes?

A: Quite a few.  

These suggest opportunities for scientific progress and grant support. They include human and animal disease vectors, agricultural pests, threatened and endangered species, and notable marine groups.

Powerpoint of slides available here.

How accurate are BARCODE databases?

DNA barcode databases are a kind of wikipedia of DNA identifiers, with contributions by thousands of researchers. How accurate are they?  How do records that meet the BARCODE standard compare to routine GenBank records? How many BARCODE records represent pseudogenes masquering as their functional counterparts?

In case you missed this, Kevin Kerr and I recently analyzed sequencing error among 11,000 avian BARCODEs representing 2,700 bird species (PLoS ONE e43992 2012), using a frequency matrix approach to look at patterns of variation. As illustrated below, we found that very low frequency nucleotide variants (VLFs) found in single individuals of a species (labeled “singletons” in figure) are strongly concentrated at the ends of the barcode segment, consistent with sequencing error.

In contrast, very low frequency variants found in two or more individuals of a species (labeled “shared” in figure) provided a nice control–these were relatively evenly distributed, consistent with biological origin. Not surprisingly, given that most of the very rare nucleotide variants were associated with amino acid substitutions, very rare amino acid variants showed the same distribution patterns.

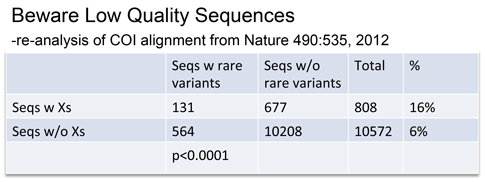
In addition to analyzing sequencing error, we closely examined the small fraction (0.1%) of BARCODEs with multiple very low frequency variants shared among individuals of a species. Based on review of trace files deposited as part of BARCODE standard, these unusually divergent versions of COI turned out to be overlooked cryptic pseudogenes lacking stop codons!

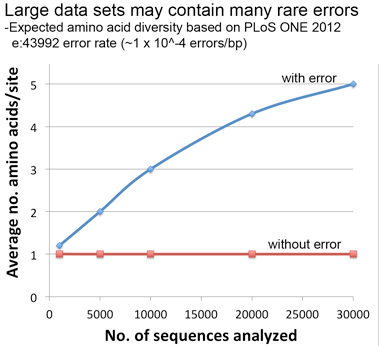
We were able to calculate an error rate for the dataset, using observation that most (94%) second codon positions were >99.9% conserved, which meant that nearly all sequencing errors at second position sites would be detectable as very low frequency (<0.1%) variants. The calculated upper limit of sequencing error was 8 x 10⁻⁵ errors/nucleotide, which is 1-2 orders of magnitude higher than generally cited for direct Sanger sequencing of amplified DNA, but unlikely to compromise species identification.  Overall, we found about 3% of BARCODEs have 1 or more errors (ave 1.4). To our knowledge, this is the first assessment of sequencing error for a large public sequence database with multiple contributors. It might be useful to annotate those records with probable sequencing errors or that represent cryptic pseudogenes; I believe that annotation is possible in BOLD and not in GenBank.

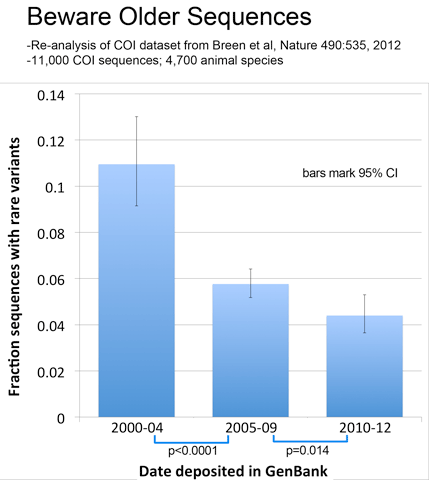
In addition to confirming the high quality of the avian BARCODE database we were able to demonstrate significant quality improvement in avian BARCODE and non-BARCODE COI records deposited in GenBank over the past decade as shown at right (bars indicate 95% confidence interval).

The frequency matrix we describe has potential application for genetic database quality assessment, discovery of cryptic pseudogenes, and studies of low-level variation.

Our results were presented at the Third European Congress for the Barcode of Life (ECBOL3) held at Royal Flemish Academy of Belgium for Sciences and the Arts (KVAB) in Brussels in September (group photo below).

Powerpoint based on PLoS ONE article is available here: freq matrix stoeckle 8nov2012