An oil analyst makes creative use of Loglet Lab to analyze oil production and the peak oil question:
News
Exploring unicellular eukaryotic universe with mtDNA
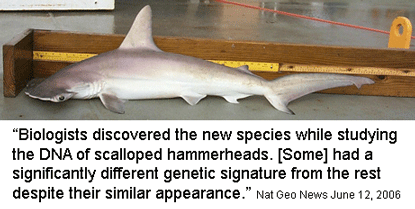
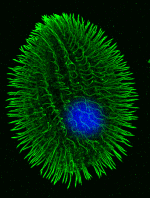
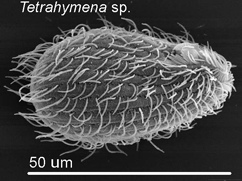
Most DNA barcode research to date analyzes multicellular animals, but why stop there? Unicellular eukaryotes or “protists” probably comprise most of Earth’s biomass and encompass more genetic diversity than all multicellular animals and plants combined. In current J Eukaryot Microbiol 2006 53:385 Denis Lynn and Michaela Struder-Kypke report on mitochondrial cytochrome oxidase I sequences in Tetrahymena, a ciliate protozoan genus related to Paramecium which includes T. thermophila, a model organism and the first free-living unicellular eukaryote genome sequenced. The authors analyzed 14 isolates of T. thermophila from 2 geographically distant locations, and 4 pairs of Tetrahymena sister species selected because they show NO sequence difference in nuclear small subunit ribsomal (SSrRNA) genes. They found less than 1% intraspecific sequence variation within T. thermophila isolates. Differences between species ranged from 1%-12% and the sister species pairs which have identical SSrRNA genes showed differences in mtCOI sequences. 
This early study suggests further exploration of unicellular eukaryotic biodiversity with COI barcodes will be fruitful.
Growing libraries reinforce mtDNA sequence clustering
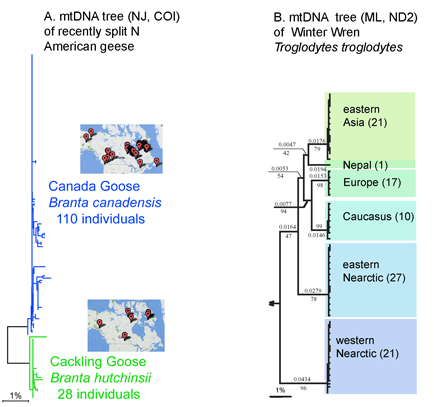
Growing barcode libraries confirm distinct clustering of mtDNA sequences. In early surveys of mtDNA differences, it seemed possible that as larger numbers of individuals were sampled, there would invevitably be many overlaps between closely-related species. The accumulating barcode data show this supposition is incorrect. Instead, further sampling reinforces the observation that most animal species correspond to distinct mtDNA sequence clusters, as for example, in the tree of Canada and Cackling Goose mtDNA sequences below (Figure A generated with public data files and software on Barcode of Life Database site https://www.barcodinglife.org/). Where large differences within species are found, they generally reflect the distinct sequence clusters of geographically restricted populations which have other identifiable biological differences, as in tree of Winter Wren mtDNA sequences below. Such clusters are probably best regarded as separate species (Figure B adapted from Drovetski et al 2004 Proc R Soc Lond B 271:545; number individuals sequenced shown in parentheses).

An emerging corollary is that most named subspecies do not represent evolutionary significant units. Large-scale surveys are revealing many genetically distinct clusters within named species, but these clusters generally do NOT correspond to described subspecies. For example, none of the 39 subspecies of Winter wren correspond to the geographic clades reported by Drovetski et al. and grouping by subspecies did not account for any variance. Robert Zink reports that “97% of continentally distributed avian subspecies lack the population genetic structure indicative of a distinct evolutionary unit” (Zink 2004 Proc R Soc Lond B 271:564). Regarding mtDNA sequence clusters, Zink states “it is these unnamed units and not named subspecies that should play a major role in guiding conservation efforts and in identifying biological diversity” Large-scale DNA barcode surveys of multicellular animals and plants can provide a foundation for intelligent conservation efforts.
What needs explanation is the absence of variation
Results so far show most animal species correspond to clusters of closely-related mtDNA sequences, distinct from clusters of neighboring species. This patterning is so striking that if a neighbor-joining tree of mtDNA sequences were shown on the SAT, high school students could likely recognize the branches that correspond to species. For example, below is a nj tree of mtDNA sequences showing cryptic species of long-tailed shrew tenrecs in Madgascar (Olson et al 2004 Biol J Linnaean Soc 83:1). For an invertebrate example, see last week’s post.

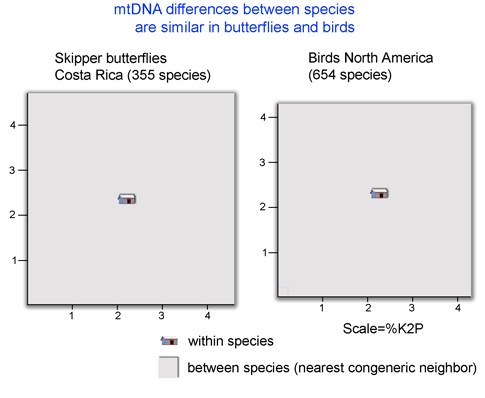
The remarkably widespread pattern of restricted intraspecific sequence variation in mtDNA in animals calls out for better scientific understanding. To my reading, most of the genetic taxonomic literature is focused on sequence differences because sequence differences are the necessary grist for reconstructing evolutionary history. Absence of variation means no characters, and no ability to generate evolutionary hypotheses. When absence of variation within species is found, it is often given the ad hoc and untestable explanation of being due to a recent population bottleneck. In individual cases this might seem plausible, but the hypothesis becomes absurd when applied to the large number of animal species that show low intraspecific variation. For example 97% of the 263 world cowrie species show constrained intraspecific variation (Meyer and Paulay 2005 PLoS Biol 3: e422); it is nonsensical to suppose all went through recent population bottlenecks. Low intraspecific variation is often said to indicate a small “effective population size”, but this is simply a restatement of the finding. As far as we know, many species are ancient and have enormous population sizes, factors that should permit variation. The burgeoning barcode libraries demonstrating limited intraspecific mtDNA variation in most animal species prompt the question, what erases history within species?
In April 2006 Science, researchers at Universite Montpellier, France (Bazin et al 2006 Science 312:570) report that population size does not influence mitochondrial diversity in animals, and hypothesize that mitochondrial DNA “probably undergoes frequent adaptive evolution”. Perhaps because this report threatens the foundation of many lines of research based on the assumption that mtDNA is a neutral marker whose diversity reflects population size, this study has elicited cautious commentary. Science’s own Perspectives piece concludes weakly “the diversity of mitochondrial DNA does not appear to reflect population size…and may be of only limited utility in understanding ecological, genetic, and evolutionary processes. It is ironic that the lack of recombination, once seen as a great asset of mitochondrial DNA, may be something of a problem in this context”. May be something of a problem? This study and the growing barcode surveys demonstrating limited mitochondrial sequence variation within most animal species overturn the assumptions of population biology and phylogeography and call for a new look at mitochondrial genetics.
Goldilocks finds mtDNA COI barcode length “just right” for distinguishing most animal species, asks why
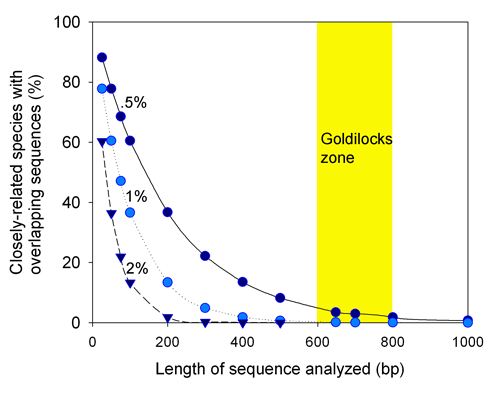
The standard animal barcode 648 bp of mitochondrial gene COI seems “just right” for delimiting most animal species. If it were “too short”, then closely-related species would not be resolved. If it were “too long” then sequencing effort would be wasted. Here I examine what might underlie the Goldilocks effect.
The following figure looks at how often closely-related species (differing by .5%, 1%, or 2%) are predicted to have overlapping sequences. With the assumptions examined below, above 600 base pairs all but the most-closely-related species will be distinguished, and above 800 base pairs, there is little gain in sensitivity.

The assumptions underlying this table-napkin analysis appear supported by data so far:
First, mitochondrial DNA sequence differences between closely-related species are widely and relatively evenly distributed throughout the protein coding and ribosomal genes. For example, see an earlier post with percent identity plots comparing whole mitochondrial genomes for congeneric salamanders. Further support is provided by a plot of parallel sequence differences in the 2 most commonly utilized mitochondrial genes, COI and cytB.
Second, most closely-related animal species have COI sequences that differ by at least 1%. For example more than 98% of 13,320 congeneric pairs from a wide array of invertebrate and vertebrate species showed greater than 2% sequence difference (Hebert et al 2003 Proc Biol Sci 270:S96).
Third, intraspecific sequence variation in mtDNA is generally very low, less than 1% in most animal species.
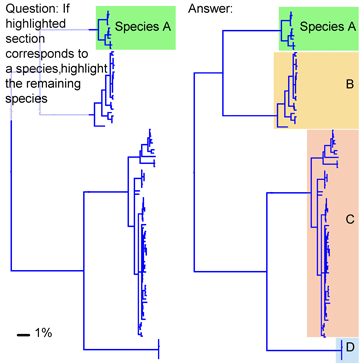
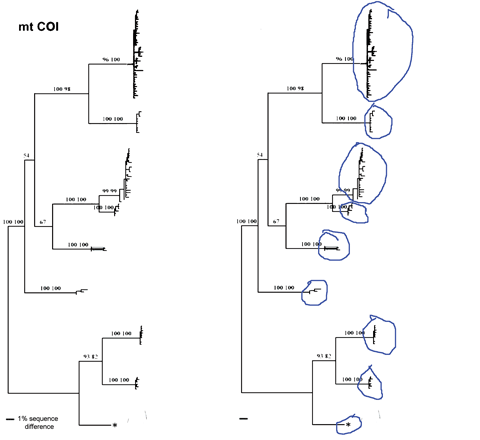
If most closely-related species can be distinguished by short mtDNA sequences, then recognizing the sets of mtDNA sequences that make up species, ie species delimitation, should at least sometimes be simple. Using the neighbor joining tree of mtDNA barcodes below, an untrained person might pick out the groups of sequences that correspond to species. The top 5 groups represent previously unrecognized cryptic species of scorched mussel Brachidontes exustus (Lee and Foighil 2004 Mol Ecol 13:3527)
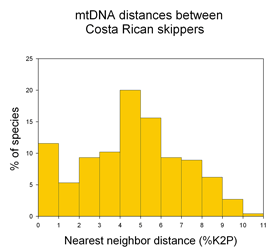
Goldilocks leaves us with the scientific questions: why are differences within most species so small, and why are the distances between most nearest neighbor species so large?
“Tag sequencing” reveals vast microbial diversity
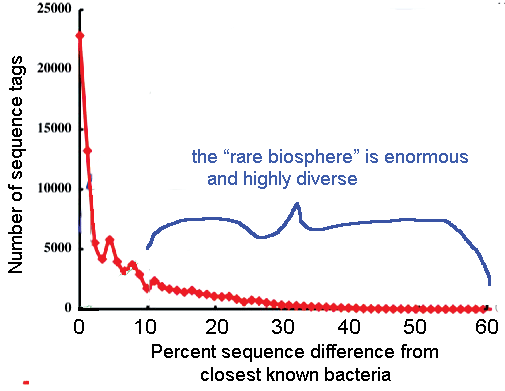
A “tag sequencing” approach analogous to mtCOI sequencing for barcoding multicellular organisms reveals vast numbers of very rare, highly divergent, deep sea microbes. In August 2006 PNAS (Sogin et al Proc Natl Acad Sci USA 32:12125), researchers from Marine Biological Laboratory at Woods Hole and Royal Netherlands Institute for Sea Research report on pooled bacterial samples collected at 550-1,710 meters in the Atlantic Ocean. To enable detection of rare populations, they focused on a short hypervariable region of 16s rRNA (only 79 bases) and analyzed a large number of PCR amplicons (118,000!) using 454 Life Sciences technology. This approach makes it economical to analyze enormous numbers of sequences from pooled environmental samples and avoids possible selection artifacts due to biases in amplifying longer PCR products and in cloning. Remarkably, the very short 79 base pair “tag” captured about 90% of the sequence differences in full-length 1500 base pair 16s rRNA sequences.

The results were compared to a V6 hypervariable region database, which contains about 40,000 unique V6 sequences extracted from the nearly 120,000 published bacterial rRNA gene sequences. A small number of sequence tags similar to known bacteria made up most of the samples, including 25% that were identical to sequences in the database and 40% that were no more than 3% different. Overall 75% of “total tags” were less than 10% different from previously sequenced bacteria. The remaining 25% was comprised of thousands of low abundance, extraordinarily diverse populations. The authors conclude the “rare biosphere” is “an ancient and..nearly inexhautible source of genomic innovation..[that] at different times in earth’s history..may have had a profound impact on shaping planetary processes.” There is a lot more we will learn through standardized genetic analysis using short sequences, including mtCOI barcodes and v6 rRNA tags, applied to vast numbers of organisms.
Oggi
The Italian weekly magazine Oggi published a colorful spread about the Census of Marine Life in its 26 June 2006 edition entitled “ET swims in the abyss.” The opening page includes a photo of Jesse about to go to work on an arctic ice floe.
CoML Marine Microbes
The Census of Marine Life announces discovery of a rare microbial biosphere. Jesse notes that a swallow of seawater might contain 1000 kinds of bacteria.
Scientific American SuperGrid
The Continental Supergrid is featured in the July 2006 issue of Scientific American:
ENERGY
A Power Grid for the Hydrogen Economy
By Paul M. Grant, Chauncey Starr and Thomas J. Overbye
Cryogenic, superconducting conduits could be connected into a
“supergrid” that would simultaneously deliver electrical power
and hydrogen fuel.
We are delighted that the Supergrid concept has advanced strongly from the November 2002 and October 2004 feasibility workshops.
Elektron Splicer
Our 1996 paper Elektron introduced the notion of an appliance, “The Splicer”, a multipurpose minigenerator at the level of the individual consumer that could produce heat, electricity, and cold on demand, and help the electric power system for peaking and standby and thus reliability. We are delighted to find engineer Andreas Gratzer of the Austrian company OMV has developed a working splicer of 70,000 rpm and 115 kw. A German report details his thinking.