 A dream of many came to life this week with launch of Encyclopedia of Life. In the words of E.O. Wilson, “imagine an electronic page for each species of organism on Earth available everywhere by single access on command”. Encyclopedia of Life is a global effort to document all 1.8 million named species of plants and animals on Earth in a free online resource. With support from the John D. and Catherine T. MacArthur Foundation and the Alfred P. Sloan Foundation, scientists from many institutions including Field Museum of Natural History, Harvard University, Marine Biological Laboratory, Smithsonian Institution, and Biodiversity Heritage Library have joined together to initiate the project. Like Wikipedia, the Encyclopedia of Life aims to draw on the global pool of expertise, allowing users to add information and details, such as species sightings and photos, with the content authenticated by scientists. From EOL’s home page:
“Comprehensive, collaborative, ever-growing, and personalized, the Encyclopedia of Life is an ecosystem of websites that makes all key information about life on Earth accessible to anyone, anywhere in the world. Our goal is to create a constantly evolving encyclopedia that lives on the Internet, with contributions from scientists and amateurs alike. To transform the science of biology, and inspire a new generation of scientists, by aggregating all known data about every living species. And ultimately, to increase our collective understanding of life on Earth, and safeguard the richest possible spectrum of biodiversity.”
To highlight just one component of the project, the Scanning and Digitization Group is addressing the critical need for wider access to published literature, including older works. At present, “to identify a rare specimen, a biologist may need to consult a 100 year-old text because that was the last time the species was found, described, and recorded. This essential historical reference gives exceptional value to the libraries encompassed by the partners of the Biodiversity Heritage Library [a colloboration of ten natural history museums, herbaria, and research institutions]. Today, mainly those few who can enter their library doors can read the wealth of the world’s publications held within. This effectively hides this storehouse of knowledge about biodiversity from a range of applications, including research, education, taxonomy, disease control, and the maintenance and protection of ecosystems.”
 The Scanning and Digitization Group will accelerate the work of the Biodiversity Heritage Library, an ongoing effort which has already digitized 1.25 million pages, enabling “citizens unaffiliated with major institutions to search, read, and download articles previously unavailable to them. Educators can guide students’ biological research with a wealth of examples incorporated in lesson plans and assignments. Illustrations in rare taxonomic works can inspire artists. The openly available Biodiversity Heritage Library will link the great biodiversity in tropical and developing countries to literature about biodiversity primarily held in a few North American and European libraries, a significant intellectual repatriation.”
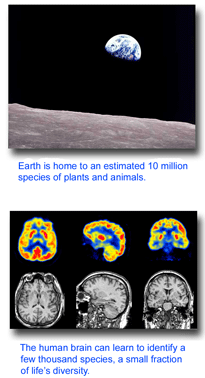
I believe DNA barcode libraries will provide an essential genetic “index” for locating species pages in the Encylopedia of Life. The best-trained human mind can identify a few thousand species. Comprehensive DNA barcode libraries and inexpensive, portable sequence devices will enable anyone to find EOL’s home page for multimillions of species, regardless of life stage, gender, or whether the specimen is in bits and pieces.
There is a thrilling launch video–do not miss it!
 In
In 
 The results show a “variegated picture of the taxonomic status of publicly indexed fungal sequences“. Taxonomic coverage is sparse: of the estimated 1.5 million fungi, less than 1% (9,684 species) are represented. Taxonomic data is lacking for many sequences (27% are not identified to species level), and most of the species-level identifications are unverifiable (82% are not linked to voucher specimens, 63% are not tagged with specimen country of origin, and 42% are marked as unpublished). Sequence comparisions suggest mislabeling is common (11% show best matches to congeneric but heterospecific sequences, and another 7% match among species of a different genus. Overall 10-21% of the INSD sequences have incorrect or unsatisfactory annotations.
 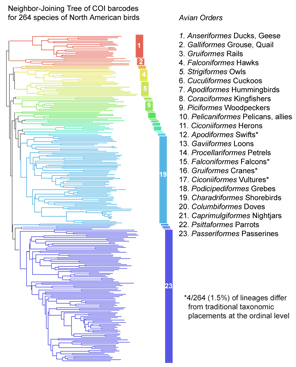 COI barcoding is a standardized approach to identifying species by DNA, helping resolve the “leaves” on the tree of life. Will the growing arrays of COI sequences also help provide insight into evolutionary history, the “branches” of the tree? I am struck that in some cases, simple genetic arithmetic with COI sequences creates trees very similar to modern phylogenies painstakingly created from multiple nuclear and mitochondrial genes, multiple morphologic characters, and exhaustive computerized analysis. Shown at right, a neighbor-joining analysis of