Almost 4 years ago, in October 2005 Philos Trans R Soc Lond B Biol Sci researchers from American Museum of Natural History examined the then nascent DNA barcoding effort, looking at what methods were best for integrating the growing pool of DNA barcode data into systematics, the science of classifying organisms based on evolutionary history. Using real-world examples, authors DeSalle, Egan, and Siddall argued strongly for “characters” and against “distances” when using DNA barcode data to identify species, ie assigning specimens to known species and discovering new species. Of course, sequence data was already the backbone of modern systematics but it had primarily been applied to reconstructing evolutionary branching patterns (eg what pattern of divergences led to the various orders of birds) and less so to the definition of species. For example, most phylogenetic work included single examplars of each species. Analyzing sequence differences among and within closely-related species was more the domain of phylogeography which generally did not explicitly aim to define new species.
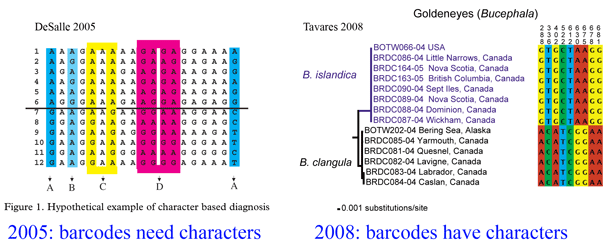 Here a brief aside. In analyzing sequences, “characters” refer to specific nucleotides (eg guanine (G) at position 138 in COI gene) and “distances” refer to per cent differences between sequences. So right away you can see that “characters” are intrinsic to the specimen’s DNA, whereas distances are defined only in relation to sequences from other specimens. Systematists like characters; for one, this enables integrating sequence and morphologic data. Characters are the grist for the computational workhorses of systematics, Parsimony and Maximum Likelihood. Meanwhile, beginning with the first paper published in 2003, distances displayed in neighbor-joining trees have been the usual heuristic approach for analyzing DNA barcode differences among and within species. A crucial advantage of neighbor-joining distance analysis is speed. Creating a NJ distance tree from 1000 648 bp barcode sequences might take a minute on a desktop computer whereas Maximum Likelihood reconstruction might take several weeks. Unlike reconstructing the Tree of Life, DNA barcoding is a recurrent exercise that repeatedly involves submitting new data from multiple known and unknown specimens, so a fast analytic method is essential.
Four years later, where are we? Most DNA barcoding analyses continue to rely on NJ distance trees, and this approach has proven to be a durable heuristic, enabling one to distinguish among most species analyzed so far. Regarding species discovery, NJ distance trees demonstrate continued value as a first step in flagging divergent lineages that may represent new species. Here there is something of a roadblock, in that defining new species is a human judgement, sort of like a medical diagnosis, while sequences differences are like medical laboratory results. Community standards do not accept divergent mtDNA sequences as sufficient evidence to define a new species, although at the same time it is generally acknowledged that such sequences do indicate it is new, albeit one that hasn’t been officially defined yet. For example, in Nov 2008 news item researchers confidently assert “DNA tests identify new dolphin species,” (based on published article in Nov 2008 Mol Phylogenet Evol), yet include statement “it is awaiting a scientific name after a formal description.” I expect the researchers knew they had a new species with the first mtDNA sequence from a single individual! For DNA barcoding effort it should not be necessary to wait for final taxonomic decisions; we can proceed with publicly-disseminating a broad-range, fine-scale map of biodiversity, which can then be annotated with taxonomic information as it arrives. Like sky surveys and the human genome project, we should aim to make the “barcode biodiversity map” public as quickly as possible.
On the other side, it is now a commonplace observation that a 10X threshold (10 times the average intraspecific variation) is NOT a universal dividing line between intra- and inter-specific variation. To get technical, this was originally proposed as a screen for new species, but it has been taken as a dividing line between intra- and inter-specific distances, which it certainly is not; in the original 2004 paper (I am co-author) there are many sister species separated by distances less than the threshold. It has been a useful rhetorical target so maybe this issue won’t disappear just yet.
On the character front, there are more publications defining discriminatory DNA barcodes characters (eg Tavares and Baker 9 march 2008 BMC Evol Biol). It seems obvious to me that if, as is usually the case, sister species show large differences among and small differences within, then there must be diagnostic characters that distinguish them. The process of “translating” distances into characters should perhaps be a standard practice for nearest neighbor taxa in NJ trees; this would certainly give confidence (or not) as to whether one can reliably distinguish those species with less than 1% sequence difference. There is exciting development in character-based software tools (eg Ahrens et al 2007, Rosenberg 2007, Abdo and Golding 2007, Munch et al 2008) aimed at distinguishing the leaves (ie species) in addition to those already available for reconstructing the branches on the Tree of Life. I look forward to one that is friendly for non-specialists and works speedily on desktops!
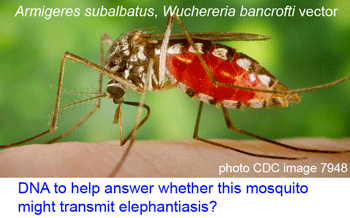 Human filariasis, caused by various species of insect-transmitted parasitic nematodes, affects more than 120 million persons in Africa, South America, and Southeast Asia, and includes elephantiasis and river blindness. In
 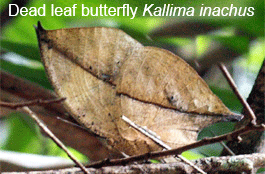 Just as new telescopes reveal previously hidden details of the universe, genetic surveys regularly reveal previously hidden (aka cryptic) species. Of course these species are cryptic only in the sense that morphological analysis is not the right tool to “see” them with. To my ear the word “cryptic” suggests camouflaged organisms that blend in with the environment, such as the Dead leaf butterfly Kallima inachus. Unlike camouflage, which is presumably a protection adaption, it is my impression there is nothing biologically special about morphologic crypsis except for the difficulty we have in recognizing it; that is, what we call cryptic species exhibit the same sorts of distinct ecological and behavioral adaptations found in those whose differences are more visible to the human eye.
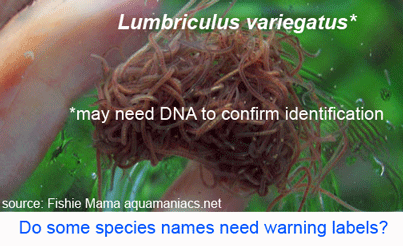 Gustafsson and colleagues were initially studying a neuropeptide gene FMRFamide using L. variegatus purchased from a commercial supplier in California, with puzzling results suggesting polyploidy with multiple gene copies. This lead them to further characterize approximately 50 individuals collected at multiple sites in Europe and North America. Sequencing of COI, 16S, and ITS sorted the specimens into 2 phylogenetically distinct (maximum parsimony and Bayesian analysis) clades with 17% mean difference in COI, with the same genetic structure in mitochondrial COI/16S as nuclear ITS. Both clades were found in North America and Europe, sometimes at the same site. The authors conclude “it thus seems reasonable to regard these two main lineages within the L. variegatus complex as different species, regardless of which species concept one adheres to.” Of course, it may be they have rediscovered a named species; they caution that more study needs to be done including sampling the other named species in genus Lumbriculus (
 In
In 
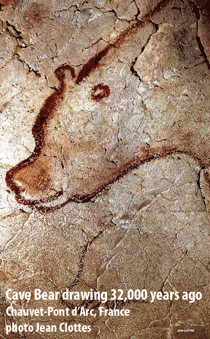 In another seeming step towards Jurassic Park, two groups of researchers recovered full-length mitochondrial DNA sequences from 22,000 to 44,000 year-old bones of extinct European and North American bears. Full-length mtDNA has been recovered from similarly ancient specimens, but in those cases frozen tissues preserved in permafrost were used. Both groups used specialized PCR protocols employing several hundred primer pairs designed to recover short fragments, rather than one of the newer sequencing technologies, demonstrating the continued power of DNA amplification.
 sister to Tremarctos ornatus (Spectacled bear). Of course it would be difficult to recover a full-length sequence–what about the
 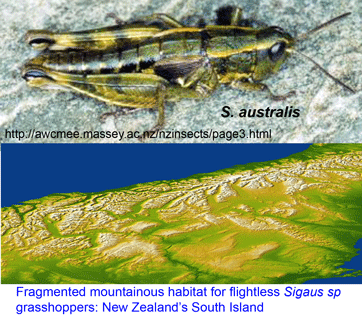 Trewick focused on Sigaus australis species complex, which includes the apparently widely-distributed S. australis, and 5 sympatric or parapatric species with much narrower ranges (S. childi, S. obelisci, S. homerensis, and 2 undescribed species). Within this complex he analyzed 160 individuals collected at 26 locations (mostly S. australis (136 individuals) and 1-13 individuals for the more restricted species). For mtDNA analysis, an approximately 600 bp region of 12-16S and about 500 bp of 3′ COI (ie not overlapping COI barcode region!) were examined.
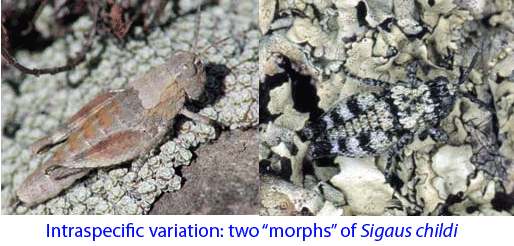 Regarding point 2, genetic methods including DNA barcoding may not resolve very young species. For Sigaus sp. grasshoppers, nuclear sequence data will help sort out whether these are young species or the products of recent hybridization or introgression.
 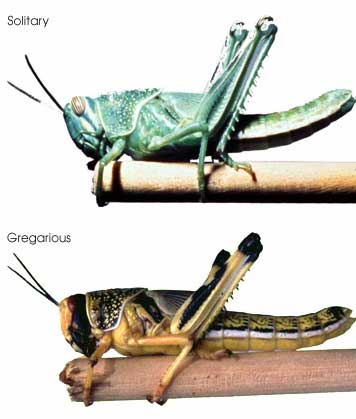 In this regard, I am struck by the apparent variability in some grasshopper species, as in the color morphs of S. childi shown above. It brings to my mind the extraordinary transformations from solitary grasshoppers to swarming locusts (these are members of the same Acrididae family as Sigaus). Perhaps grasshopper genetics include analogous latent “switches” that might enable relatively rapid evolutionary transformations.