The Daily Star newspaper, Dhaka, Bangladesh, runs an article about Industrial Ecology that mentions our ideas about foamed glass as a construction material that captured the imagination of Ivan Amato for Time magazine several years ago.
Blog
Finish for trains and start for maglevs?
The French “train a grand vitesse” (TGV) attained a record speed for a train on wheels of 568 km/hr on 31 March 2007. The history of technology shows that when a new technology like the steamship appears, the old one makes a final spurt to beat it. Recall the magnificent
|
The Industrial Physicist 7(2):20-24, April/May 2001. |
|
European Review 6(2):143-162, 1998. We envision a transport system producing zero emissions and sparing the surface landscape, while people on average range hundreds of kilometers daily. We believe this prospect of “green mobility” is consistent in general principles with historical evolution. We lay out these general principles, extracted from widespread observations of human behavior over long periods, and use them to explain past transport and to project the next 50 to 100 years. Our picture emphasizes the slow penetration of new technologies of transport adding speed in the course of substituting for the old ones in terms of time allocation. We discuss serially and in increasing detail railroads, cars, airplanes, and magnetically levitated trains (maglevs). |
Vast microbial genetic diversity found in oceans, stimulating new informatics tools
The biological universe is much larger and more diverse than we thought. In three papers in March 2007 PLoS Biology, scientists report on a genetic survey of microbial diversity in the world’s oceans. A large collaboration, the Global Oceanic Sampling (GOS), led by Craig Venter, analyzed microbial DNA collected by filtering seawater at 250 sites along a several thousand kilometer transect from the North Atlantic, through the Panama Canal, around the Galapagos Islands, ending in the Cocos Islands of the South Pacific. The resulting DNA dataset consisted of 6.3 billion base pairs (twice the size of the human genome), with 85% of the assembled and 57% of the unassembled data unique at a 98% identity cutoff. The extreme diversity prevented assembly of complete genomes, as many reads were unique. A comprehensive dataset of GOS sequences combined with pre-exisiting databases reveals nearly 6.12 million proteins, nearly doubling the number of known proteins. Some families of microbial proteins discovered in this study, particularly protein kinases, were previously thought to be restricted to eukaryotic organisms. Over 1700 sequence clusters show no identity to known families, implying we are far from knowing the full range of what proteins can do.
How to make sense of all this data? First, more data is needed!, namely more complete genomes into which the unassembled fragments can be placed. Second, new analytic tools. A new genomics and informatics group based at the California Institute for Telecommunications and Information Technology in San Diego, have built a metagenomics version of GenBank, known as the Community Cyberinfrastructure for Advanced Marine Microbial Ecology Research and Analysis (try saying that 3 times quickly!) which is fortunately known by acronym CAMERA.
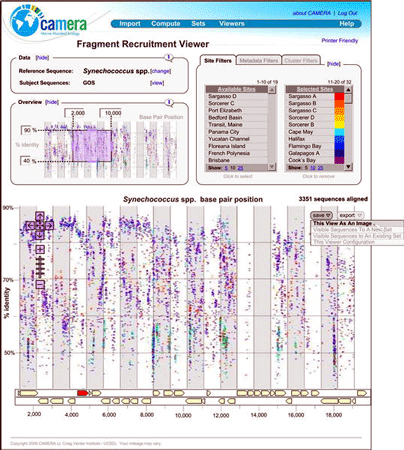
Just as Google and other search engines solved a problem of information overload that did not exist a few years ago, I am confident that CAMERA and other new informatics tools will enable us to view the expanding universe of environmental genomics, including DNA barcode libraries, in ways that will provide new understanding.
Routine DNA testing in fish industry to help people and fish
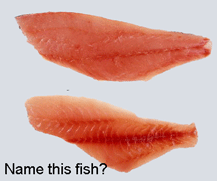 Over 1000 fish species can be legally sold in the United States, a challenge for accurate labelling. Many fish products such as fillets cannot be identified to species, even by experts. DNA surveys suggest that at least for some expensive species, most fish products are mislabelled. In 2004 Nature 430:309, scientists at University of North Carolina analyzed mtDNA of fish labelled as red snapper, which by US law can only be applied to a Caribbean snapper species, Lutjanus campechanus. 77% (17/22) fish purchased from 9 vendors in eight states were not L. campechanus, and most were species from other regions of the world, or could not be identified to species due to lack of reference sequences.
More recently, the availability of commercial DNA testing has enabled enterprising news stations to do their own research. Last year a Florida television station found that 6 of 11 restaurant entrees labeled as local grouper were other species, including Asian catfish and tilapia, and last month a Los Angeles television station reported that red snapper entrees at 4 local restaurants were either tilapia, catfish, or mahi mahi. Following up on the news media, the Florida Attorney General’s office did their own testing, found 17 of 24 restaurants sold entrees mislabeled as grouper, and made legal settlements. What is needed is needed is a widely available method backed up by a reliable reference library that can be routinely applied to identification of fish and fish products in the marketplace. DNA barcoding is designed to be just that.
The Food and Drug Adminstration (FDA) Regulatory Fish Encyclopedia (RFE) aims “to assist with the accurate identification of species and help federal, state, and local officials and purchasers of seafood identify species substitution and economic deception in the marketplace.”
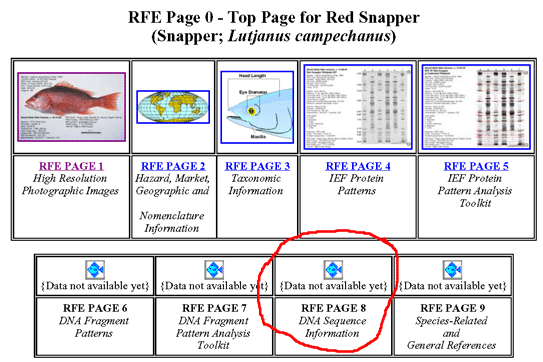
The species pages include scientific and common names, pictures of whole fish and fish products, analytic gels of fish proteins, and excitingly, an empty space for reference DNA sequence information. For reliable identification, the fish reference library needs comprehensive taxonomic coverage and adequate sampling of variation within species, ie DNA barcoding. I believe the Fish Barcode of Life Initiative (Fish-BoL), which has already collected barcodes from over 16,000 specimens representing more than 3500 species, will provide a widely used tool that will benefit consumers and the many species of fish that require management or protection.
Nature celebrates taxonomy as Carl Linnaeus turns 300, discovers DNA barcodes
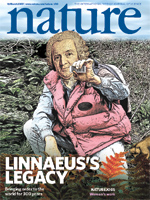 A dozen articles in current issue of Nature examine the legacy of Carl Linnaeus, born 300 years ago this May. The wonderful cover illustration shows Carl Linnaeus as a modern field biologist in blue jeans and down vest, holding up a DNA barcode. I am particularly struck by Charles Godfray’s “Linnaeus in the information age,” a wide-ranging, thoughtful, visionary and practical look at how taxonomy might evolve so as to provide the widest benefit to society. His near-term wish list includes “a comprehensive web-based taxonomic and identification resource (morphology plus DNA barcodes) for the world’s macrolepidoptera”, which “would be a wonderful lever for bringing new resources into the field.” A central theme echoed in many of the pieces is the need for taxonomists to join together and create “big science” projects that benefit the many end-users of taxonomic knowledge.
Tommy Gold’s url
We were troubled to find that Tommy Gold’s pages have disappeared from the Cornell University website but delighted to find they have been saved by the Wayback Machine of the Internet Archive.
The last time it was archived in the Wayback Machine seems to be June 2005, and the page has material through October 2000. We may be missing material that was entered between 2000 and 2004, but this is much better than disappearance!
June 2005 https://web.archive.org/web/20050616080751/https://www.people.cornell.edu:80/pages/tg21/
Big habitat projects flourish
Almost exactly 10 years ago, Jesse and Bill Nierenberg organized the first workshop at Scripps Oceanographic Institution that led to the Census of Marine Life, which earned the cover of Science News magazine 17 February. A little more than five years ago, in February 2002, Jesse and Paul Hebert met at a Census of Marine Life workshop in White Point, Nova Scotia, and joined forces to initiate the Barcode of Life initiative, which earned the cover of Canadian Geographic this month. We happily celebrate the anniversaries of these wonderful projects and thank everyone participating.
E O Wilson’s Encyclopedia of Life
For the past year Jesse has chaired a small group to help realize the vision of an on-line Encyclopedia of Life with a web page for every species proposed by Edward O. Wilson, Dan Janzen, and others. Ed made the EOL his wish at the TED conference in Monterey CA on 8 March.
Wood Products magazine covers Forest Transition
Wood and Wood Products magazine published an interview view with Jesse about the forest transition in its February 2007 issue.
Indomalayan All Birds converge in Singapore

A flock of 22 scientists converged on National University of Singapore on March 8-9, 2007 for a 2-day Indomalayan Organizational Meeting for All Birds Barcoding Initiative (ABBI), including representatives from India, Indonesia, Malaysia, Philippines, Singapore, Sri Lanka, Thailand, and individuals from European and North American museums with active collaborative research programs in this region.
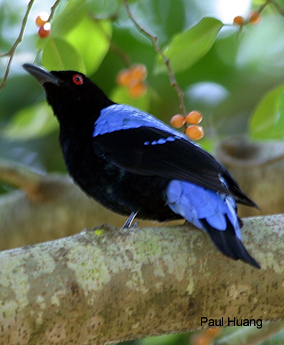 The Indomalayan biogeographic region spans a vast area of tropical biodiversity and includes inumerable islands with high numbers of endemic species. A large scale genetic survey with DNA barcoding is likely to help lead to dramatic increases in species counts in particular and better understanding of biodiversity in general. Additional collecting may be particuarly important in this region, as it is at present the least well-represented in frozen tissue collections. There was strong enthusiasm among regional participants, and recognition the initiative has public appeal and the potential to engage new sources governmental support.
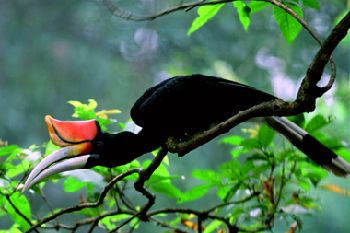 I look forward to organizational and scientific progress in this exciting region.