The Barcode Blog

A mostly scientific blog about short DNA sequences for species identification and discovery. I encourage your commentary. -- Mark Stoeckle

Subscribe to this blog

Sign up for email notifications

Archive for the 'General' Category

The fastest way forward

Thursday, November 2nd, 2006
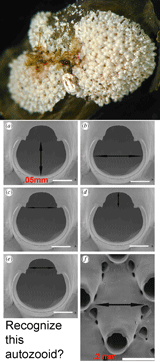
In October Proc R Soc B Gomez et al apply DNA barcoding to the cosmopolitan marine bryozoan Celleporella hyalina. Morphologic identification in this genus uses scanning electron microscopy measurements of the 0.2 mm autozooid and its 0.05 mm orifice. To eliminate potential variability associated with colonial development or environmental plasticity, these morphologic measurements are made on cloned F1 progeny grown under controlled laboratory conditions. This example highlights how standard morphologic techniques can be cumbersome and costly, and require highly-trained personnel and expensive equipment. It is unlikely this sort of morphologic identification process can be sped up, while DNA analysis is getting faster, cheaper, and more portable.
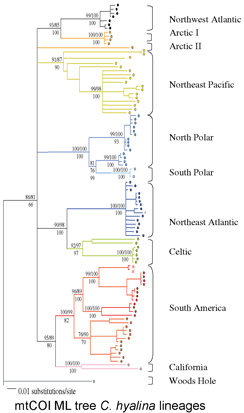


The researchers from University of Hull, University of Wales, and Universidad Catolica de la Santisima Concepcion in Chile analyzed mtCOI barcodes in 176 colonies from 33 sites around the globe, revealing at least 10 deeply divergent lineages. Mating compatability in 26 pairwise combinations showed complete reproductive isolation in 23 cases, and 3 were inconclusive due to self-fertilization. Only one of the genetically divergent, reproductively incompatible groups could be reliably separated by morphologic analysis.

It is obviously impractical to do mating studies for routine identification of bryozoans. Instead, standardized genetic analysis, ie DNA barcoding, can first help discover species (as in this case by highlighting lineages that were then subjected to other forms of biological analysis), and then be applied to assign unknown specimens to the newly revealed species. The authors conclude “DNA barcoding clearly identifies biologically meaningful groups in the C. hyalina complex” and speculate that biodiversity is similarly underestimated in other sessile marine invertebrates, including sponges and corals. “Failure to recongize cryptic speciation among sessile benthos therefore may seriously underestimate marine biodiversity as well as impeding attempts to predict the response of marine benthos to environmental change.” I conclude that DNA barcoding is the fastest way forward to help discover and then routinely identify what appear to be the vast numbers of cryptic animal species.  

Sponge barcoding on the web

Thursday, October 26th, 2006

The Sponge Barcoding Project https://www.spongebarcoding.org/ aims to barcode all described sponges, about 8,000 species in the phylum Porifera. The initial phase of 3 years will focus on 2,000 species covering all genera.

Sponges are thought to be the earliest living branch on the multicellular animal tree and are difficult even for experts to identify. In addition to their ecological importance, sponges are sources for novel pharmaceuticals and biomaterials (eg Sipkema et al 2005 Biotech Bioengineer 90:201).

Like some corals, some sponges show very few differences in mitochondrial DNA with the standard COI barcode (corals, Shearer et al 2002 Mol Ecol 11: 2475; sponges, Erpenbeck et al 2006 Mol Ecol Notes 6: 550). The latter study suggests that the 3′ end of COI may provide greater resolution for Porifera and Cnidaria. An important goal of the initial phase of the project is to determine the best strategy for obtaining species-level identifications, one that provides sufficient resolution to separate most of the closely-related species and still takes advantage as much as possible of the benefits of standardization on 5′ COI.

I note that in animals closely related sister species are often largely or completely allopatric. In such cases, combining genetic barcode data with GIS coordinates may improve the certainty of some identifications.

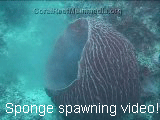
For fun, I close with a sponge video:


Worried taxonomists see future, declare it won’t work

Wednesday, October 18th, 2006

In 1987, the few dozen GPS models available were mostly larger than 200 cu in and cost $15,000 to $45,000. (https://adsabs.harvard.edu/abs/1988inna.meet..158C) Today there are thousands of models, many for under $100, and GPS technology is cheap enough and small enough to be a commonplace add-on to cell phones and PDAs. At the start, few could have recognized how ubiquitous GPS technology would be. It is now difficult to find paper road maps. 
In current Systematic Biology 55:844 (not open access so no article link here), three worried taxonomists opine that DNA barcoding won’t work because it’s too expensive. This is likely incorrect. Any process involving electronics and/or chemicals is likely to become faster, cheaper, and smaller, perhaps dramatically so.  Just as with GPS, lowered costs increase use, and increased use helps lower costs. On the DNA front, researchers are developing microfluidic grapefruit-sized sequencers that analyze sub-femtomole quantities of DNA in nanoliter volumes, with proportionally reduced reagents costs. Alternative technologies such as pyrosequencing may be even faster and cheaper. 

No one can predict the course or speed of technology development, but betting against technology is short-sighted. The authors Cameron, Rubinoff, and Will do allow that a database of 10 million species might be assembled for about $0.5 billion dollars, which would be  “much cheaper than other “big science” initiatives”. Not content, they decide that 10-fold more specimens and 3-fold more genes will be needed and presto, the cost is $15 billion!

I believe the costs of assembling the database and of routine applications will be lower than they estimate.  In addition, the database will be widely used long before it is “complete”. Looking ahead, taxonomists need to make more clear the scientific and practical value of cataloging, whether by traditional means or DNA-led discovery, the estimated millions of as yet undescribed species, most of which are thought to be insects in tropical regions.

Where will the money come from? The authors worry about effects of the Barcode of Life Initiative on current taxonomy, but their own calculations show there is no need for concern. There simply is not enough money in traditional taxonomy, which they estimate has global support of $10 million/year. To my knowledge all funding for barcoding work so far has come from sources that do not support traditional taxonomy. The situation is similar to the Human Genome Project, which worried many biomedical researchers who feared it would consume all their resources. Partly as a result, the HGP was not funded by National Insitutes of Health or National Science Foundation, but by the Department of Energy. The Barcode Initiative will help establish Environmental Genomics as a field of science, will open up new sources of support to do so, and will not subtract from traditional taxonomy.

Limited access limits taxonomy

Thursday, October 12th, 2006

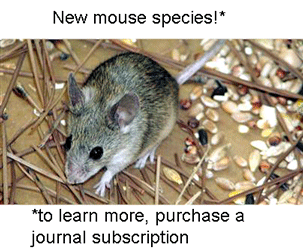
Good news for taxonomic science: “New type of mouse discovered in Cyprus”  today made headlines on 193 sites around the world including BBC, Reuters, CNN, ABC, NBC, Fox News, International Herald Tribune, and Associated Press among others. According to the press release from the researchers at University of Durham, UK, “genetic tests confirmed that the new mouse was of a different species”, suggesting once again that, theoretical protests aside, in practice many taxonomists embrace DNA-based “species discovery” as well as DNA-based “species identification”.

Bad news for taxonomic science: To learn more about what the researchers discovered, you have to purchase a journal subscription.

The press coverage of this article demonstrates discovery of new species is of wide public interest, and there are many persons who would want to read beyond the headlines. As it stands, readership is often limited to a small number of specialists, guaranteeing continuing obscurity for taxonomic science.  Open access for new species descriptions could help increase visibility and willingness to fund taxonomic science. 

Test flying DNA barcode identification

Friday, October 6th, 2006

Collisions between birds and airplanes, known as birdstrikes , are an expensive hazard for civilian and military aircraft. Identification of airstrike specimens enables bird management near airfields and is essential for improvements in aircraft safety design. Forensic ornithology laboratories


(see for example, Laboratory for Feather Remains Identification in Tel Aviv) have relied on microscopic examination of feather barbules. Identification of birdstrikes through DNA barcoding seems likely to prove a reliable, reproducible, and rapid alternative. Here I try test flying a barcode approach, and compare to a Genbank BLAST search.


This simulation tries out what barcode identification might be like once reference libraries are established, and corresponds to “species identification” (vs species discovery) in last week’s post. A sequence was selected from Barcodes of Life Data Systems (BOLD) (130,000 COI barcode sequences from 19,000 species so far) and pasted into public “Identification Engine” on BOLD home page.
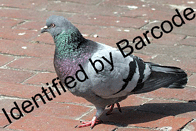
Voila! A probable identification with a disclaimer of infallibility, a list of the top 20 closest matches, and a graphic display of the closest 100 in the database. One more click creates a neighbor-joining tree with species names and collection sites (in the tree at left, species clusters are numbered, and the species and site names are omitted). 

Skipping over to Rock Pigeon Columba livia page at All Birds Barcoding Initiative (ABBI) website reveals a Google map of specimen locations

So far the BOLD database contains sequences of 24 (8%) of the 309 Columbiformes (pigeons and doves) with an average of 4 specimens per species. More contributions will establish a comprehensive reference library.

A BLAST Genbank search with the C. livia COI sequence also shows C. livia as the closest match, but only a few closely-related birds. All COI sequences in BOLD are or will presumably be deposited in GenBank, but to date many are not yet public. For a more robust comparison, I tried a C. livia cytochrome b sequence, as cytb has historically been favored by vertebrate biologists (and COI by those studying invertebrates). The C. livia cytb sequence naturally matches most closely with C. livia, with C. rupestris as the sister species, the same pattern as with COI (in tree at left, C. rupestris is species 2). It is also possible to draw a NJ tree with results of BLAST search.

There are two obvious differences in the databases. First, Genbank BLAST output including the NJ tree does not show collection sites, which are helpful or essential when assessing variation within and among species. To find this information, one would have to go back to original publications which may be inacessible or not include this data, and many sequences are deposited without any published reference.

Second, in GenBank most species are represented by a single sequence.  One of the strongest benefits of the barcode initiative, for those interested in population biology and species level-taxonomy, as well as for reliable identification, will be the collection of barcodes from multiple specimens for each species. 


Dueling taxonomists agree: DNA barcoding invaluable for species identification

Wednesday, September 27th, 2006

In October 2006 Conservation Biology, Rob DeSalle, American Museum of Natural History, comments on April 2006 CB piece on barcoding by Daniel Rubinoff, University of Hawaii (also see earlier Barcode Blog post on this article), and DeSalle’s commentary is followed by reply from Rubinoff. Such fun! DeSalle divides his analysis of DNA barcoding into its utility in “species identification” ie assigning specimens to known species, and “species discovery” ie formal descriptions of new species previously unknown to science. Both researchers cede the field of “species identification” to DNA barcoding (DeSalle: “a species identification system based on DNA sequences [would] be reliable, consistent, and rapid”; Rubinoff: “barcodes could be invaluable for speed and accuracy”).

Establishing reference libraries will be a major scientific achievement on the scale of the Human Genome Project. As these become available, the limiting factors for DNA barcoding will be cost and availability of sequence analysis, but as DeSalle observes, “it is not unreasonable to assume that DNA technology will advance to the stage where field-based diagnostics can be accomplished”.

Since there are about 1.1 million named multicellular animal species, “species identification” is a vast area for scientific research and practical application of DNA barcoding. It seems likely that the 1.1 million known species includes most of the more abundant and wide-ranging species, and most that are of direct economic or scientific importance to humans. It is generally believed there are many more undescribed species than what has already been named. These may be largely rarer species with limited distributions (see earlier post on “rare microbial biosphere“). Population sizes and ranges in the undescribed biosphere, together with measures of genetic diversity (see last week’s post) might be interesting research areas.

The rest of the exchange centers on the role of DNA barcoding in “species discovery” ie formal descriptions of species previously unknown to science. Here both turn cautious, reserving an essential role for expert judgement. (DeSalle: “DNA sequence information in the absence of other corroborating evidence can never be used by itself as an indicator of species delimitation”. Rubinoff: “my opposition is to the practice by which species are known and identifiable only through a DNA barcode”.)

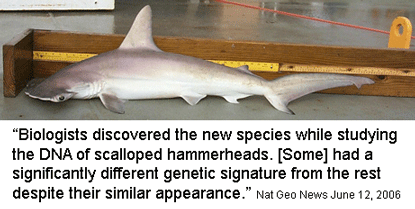
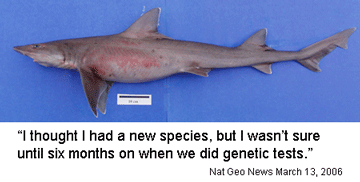
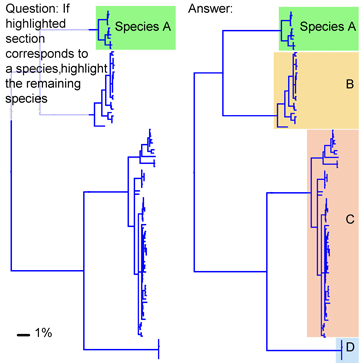
It may be that it takes a taxonomist to recognize a new species and that it is essential to use an integrated approach combining morphology, ecology, together with DNA sequence data.  However, I am struck that in practice taxonomists often apply a “DNA-first” approach and that an untrained person could recognize most of the sequence clusters that correspond to species. A Google search with “new species” and “dna” turns up dozens of reports in which DNA sequence differences are the first and strongest evidence for cryptic species, including the 2 new shark species shown below.


It is surprising that the published description of the new shark species shown above did not include any DNA sequence data! 

I close with a question about distance vs character comparisons of sequence data. Both authors assume that “distances” cannot be part of species descriptions, “characters” are needed. I wonder if this is a scientific fact, or one that reflects the social norms of taxonomy. As discussed in recent posts, neighbor-joining distance comparisons show most animal species as tight clusters, distinct from those of other species. Once a reference library is established, why not use distance clustering as a diagnostic, eg “species X COI barcodes lie within cluster 1439″?  

Small houses on big lots

Thursday, September 21st, 2006

Most animal species correspond to tight clusters of mtDNA distinct from those closely-related species. In real estate terms, most species are small houses on big lots. Small houses because intraspecific variation in mtDNA is generally low, and big lots because distances between species are generally large. 


Two recent posts looked at “house size”, or mtDNA distances within species. The finding of limited variation within most species calls out for research into mitochondrial genetics. Here I examine the other half of what species-level mtDNA maps show: “lot size”, or mtDNA distances between species.  This refers to MINIMUM distances between species, ie the genetic distance between a species and its nearest neighbor on the mtDNA map. “Nearest neighbor” is more inclusive, and likely more appropriate for testing speciation/extinction models, than the subset of “sister species” which refers only to the most closely-related species pairs. Species without close relatives, and species whose closest relative belongs to another sister species pair are usually omitted from compilations of sister species.  

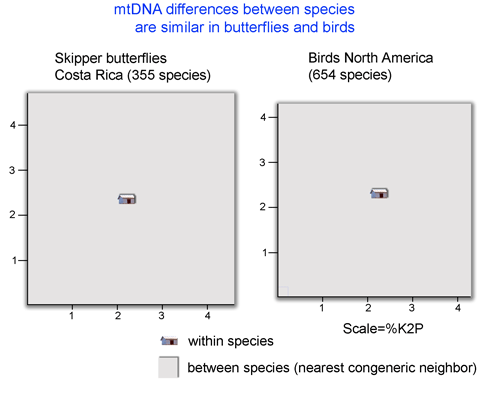
It is long observed that distances between most animal species are larger than distances within (eg Moore 1995 Evolution 49:718). What is exciting is that there is now enough barcode data to allow scientifically interesting comparisons among groups.  For example, the figure below shows average “lot size”, or minimum distance between species, is surprisingly similar in two large assemblages of butterflies and birds (nearest neighbor analysis performed using software and sequence data on Barcode of Life Data Systems (BOLD)).


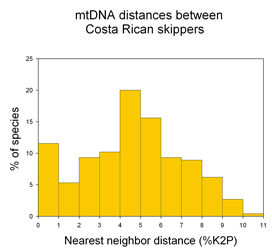
A potentially fruitful line of inquiry might be to examine nearest neighbor distances among allopatric vs. sympatric species. The distribution of nearest neighbor distances will likely be of interest to those studing birth and death of species (eg Nee 2001. Evolution 55:661). In the histogram of congeneric nearest neighbor distances among skipper butterflies shown at left, it is perhaps surprising the distribution is not a “hollow curve” (eg Scotland and Sanderson 2004. Science 303:643). Which models of speciation are consistent with observed distributions of genetic distances among species? 


Exploring unicellular eukaryotic universe with mtDNA

Thursday, September 14th, 2006

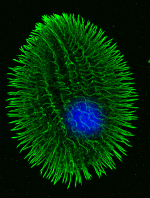
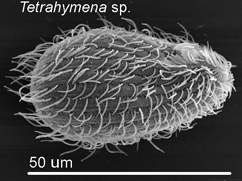
Tetrahymena sp Most DNA barcode research to date analyzes multicellular animals, but why stop there? Unicellular eukaryotes or “protists” probably comprise most of Earth’s biomass and encompass more genetic diversity than all multicellular animals and plants combined.  In current J Eukaryot Microbiol 2006 53:385 Denis Lynn and Michaela Struder-Kypke report on mitochondrial cytochrome oxidase I sequences in Tetrahymena, a ciliate protozoan genus related to Paramecium which includes T. thermophila, a model organism and the first free-living unicellular eukaryote genome sequenced. The authors analyzed 14 isolates of T. thermophila from 2 geographically distant locations, and 4 pairs of Tetrahymena sister species selected because they show NO sequence difference in nuclear small subunit ribsomal (SSrRNA) genes. They found less than 1% intraspecific sequence variation within T. thermophila isolates. Differences between species ranged from 1%-12% and the sister species pairs which have identical SSrRNA genes showed differences in mtCOI sequences. 

This early study suggests further exploration of unicellular eukaryotic biodiversity with COI barcodes will be fruitful. 


Growing libraries reinforce mtDNA sequence clustering

Thursday, September 7th, 2006

Growing barcode libraries confirm distinct clustering of mtDNA sequences. In early surveys of mtDNA differences, it seemed possible that as larger numbers of individuals were sampled, there would invevitably be many overlaps between closely-related species. The accumulating barcode data show this supposition is incorrect. Instead, further sampling reinforces the observation that most animal species correspond to distinct mtDNA sequence clusters, as for example, in the tree of Canada and Cackling Goose mtDNA sequences below (Figure A generated with public data files and software on Barcode of Life Database site https://www.barcodinglife.org/). Where large differences within species are found, they generally reflect the distinct sequence clusters of geographically restricted populations which have other identifiable biological differences, as in tree of Winter Wren mtDNA sequences below. Such clusters are probably best regarded as separate species (Figure B adapted from Drovetski et al 2004 Proc R Soc Lond B 271:545; number individuals sequenced shown in parentheses). 


An emerging corollary is that most named subspecies do not represent evolutionary significant units.   Large-scale surveys are revealing many genetically distinct clusters within named species, but these clusters generally do NOT correspond to described subspecies. For example, none of the 39 subspecies of Winter wren correspond to the geographic clades reported by Drovetski et al. and grouping by subspecies did not account for any variance. Robert Zink reports that “97% of continentally distributed avian subspecies lack the population genetic structure indicative of a distinct evolutionary unit” (Zink 2004 Proc R Soc Lond B 271:564). Regarding mtDNA sequence clusters, Zink states “it is these unnamed units and not named subspecies that should play a major role in guiding conservation efforts and in identifying biological diversity” Large-scale DNA barcode surveys of multicellular animals and plants can provide a foundation for intelligent conservation efforts. 


What needs explanation is the absence of variation

Thursday, August 31st, 2006

Results so far show most animal species correspond to clusters of closely-related mtDNA sequences, distinct from clusters of neighboring species. This patterning is so striking that if a neighbor-joining tree of mtDNA sequences were shown on the SAT, high school students could likely recognize the branches that correspond to species. For example, below is a nj tree of mtDNA sequences showing cryptic species of long-tailed shrew tenrecs in Madgascar (Olson et al 2004 Biol J Linnaean Soc 83:1). For an invertebrate example, see last week’s post.

The remarkably widespread pattern of restricted intraspecific sequence variation in mtDNA in animals calls out for better scientific understanding. To my reading, most of the genetic taxonomic literature is focused on sequence differences because sequence differences are the necessary grist for reconstructing evolutionary history. Absence of variation means no characters, and no ability to generate evolutionary hypotheses. When absence of variation within species is found, it is often given the ad hoc and untestable explanation of being due to a recent population bottleneck. In individual cases this might seem plausible, but the hypothesis becomes absurd when applied to the large number of animal species that show low intraspecific variation. For example 97% of the 263 world cowrie species show constrained intraspecific variation (Meyer and Paulay 2005 PLoS Biol 3: e422); it is nonsensical to suppose all went through recent population bottlenecks. Low intraspecific variation is often said to indicate a small “effective population size”, but this is simply a restatement of the finding. As far as we know, many species are ancient and have enormous population sizes, factors that should permit variation. The burgeoning barcode libraries demonstrating limited intraspecific mtDNA variation in most animal species prompt the question, what erases history within species?

In April 2006 Science, researchers at Universite Montpellier, France (Bazin et al 2006 Science 312:570) report that population size does not influence mitochondrial diversity in animals, and hypothesize that mitochondrial DNA “probably undergoes frequent adaptive evolution”.  Perhaps because this report threatens the foundation of many lines of research based on the assumption that mtDNA is a neutral marker whose diversity reflects population size, this study has elicited cautious commentary. Science’s own Perspectives piece concludes weakly “the diversity of mitochondrial DNA does not appear to reflect population size…and may be of only limited utility in understanding ecological, genetic, and evolutionary processes. It is ironic that the lack of recombination, once seen as a great asset of mitochondrial DNA, may be something of a problem in this context”. May be something of a problem? This study and the growing barcode surveys demonstrating limited mitochondrial sequence variation within most animal species overturn the assumptions of population biology and phylogeography and call for a new look at mitochondrial genetics.  


Contact: mark.stoeckle@rockefeller.edu

About this site

This web site is an outgrowth of the Taxonomy, DNA, and Barcode of Life meeting held at Banbury Center, Cold Spring Harbor Laboratory, September 9-12, 2003. It is designed and managed by Mark Stoeckle, Perrin Meyer, and Jason Yung at the Program for the Human Environment (PHE) at The Rockefeller University.

About the Program for the Human Environment

The involvement of the Program for the Human Environment in DNA barcoding dates to Jesse Ausubel's attendance in February 2002 at a conference in Nova Scotia organized by the Canadian Center for Marine Biodiversity. At the conference, Paul Hebert presented for the first time his concept of large-scale DNA barcoding for species identification. Impressed by the potential for this technology to address difficult challenges in the Census of Marine Life, Jesse agreed with Paul on encouraging a conference to explore the contribution taxonomy and DNA could make to the Census as well as other large-scale terrestrial efforts. In his capacity as a Program Director of the Sloan Foundation, Jesse turned to the Banbury Conference Center of Cold Spring Harbor Laboratory, whose leader Jan Witkowski prepared a strong proposal to explore both the scientific reliability of barcoding and the processes that might bring it to broad application. Concurrently, PHE researcher Mark Stoeckle began to work with the Hebert lab on analytic studies of barcoding in birds. Our involvement in barcoding now takes 3 forms: assisting the organizational development of the Consortium for the Barcode of Life and the Barcode of Life Initiative; contributing to the scientific development of the field, especially by studies in birds, and contributing to public understanding of the science and technology of barcoding and its applications through improved visualization techniques and preparation of brochures and other broadly accessible means, including this website. While the Sloan Foundation continues to support CBOL through a grant to the Smithsonian Institution, it does not provide financial support for barcoding research itself or support to the PHE for its research in this field.