All Birds Barcoding Initiative in the mail
Wednesday, January 10th, 2007
For enjoyment or use, a US postage stamp featuring All Birds Barcoding Initiative (ABBI) and the Consortium for the Barcode of Life (CBOL) is available at zazzle.com.
A mostly scientific blog about short DNA sequences for species identification and discovery. I encourage your commentary. -- Mark Stoeckle
Wednesday, January 10th, 2007
For enjoyment or use, a US postage stamp featuring All Birds Barcoding Initiative (ABBI) and the Consortium for the Barcode of Life (CBOL) is available at zazzle.com.
Friday, January 5th, 2007
In early online J Zool Syst Evol Res researchers from Natural History Museum and Imperial College, London, scrutinize “recent advances in DNA taxonomy…that follow the dramatic increase in data generation“. Authors Vogler and Monaghan provide a scientific update to
 what has been learned so far: “a key finding from recent studies in animals is that variation in mitochondrial DNA is partitioned as tight clusters of closely related genotypes, which group specimens largely according to traditionally recognized species limits, and which are congruent with nuclear markers”,
the durability of clustering: “it can be expected that denser geographic and taxonomic sampling may result in the discovery of new clusters, and perhaps reduce their divergence from each other, but they are unlikely to erode the clustering altogether”,
the significance of incongruence between DNA-based and morphology-based methods for delimiting species: “the high degree of congruence of mtDNA groups and traditionally defined taxa appears to contradict the reported mismatch of established species boundaries…even well-studied groups may be in need of taxonomic revision before accurate tests of incongruence can be conducted”,
what the future holds: “a standard DNA taxonomic analysis will include broad sampling..followed by large-scale sequencing, and algorithmic procedures for delineating species limits. The taxonomic system will be derived from the data rather than expert opinion“,
 and what is needed to harness DNA taxonomy in general and DNA barcoding in particular to speed description of the estimated 80% of earth’s biodiversity that is at yet undescribed: “a feedback loop that [uses] discrepancies between DNA and other data to refine species descriptions..founded in existing theory of evolutionary biology and phylogenetics”
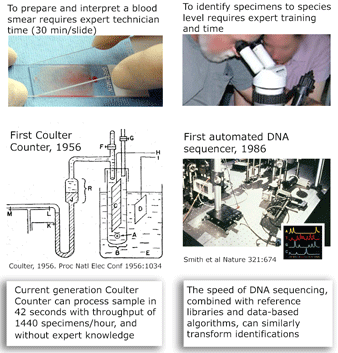
I close with a pictorial analogy. The Coulter counter uses electrical sensing to gain the same information as morphologic diagnosis of blood smears, with dramatic improvements in speed, cost, and necessary expertise. In some situations, DNA sequencing may provide similar improvements over morphologic diagnosis for species-level identification.
Thursday, December 28th, 2006
Why DNA barcoding works as well as it does is an unsolved scientific puzzle. It is long observed that mitochondrial DNA differences within animal species are generally much smaller than those among species and, in the landscape of phylogenetic trees, mitochondrial DNA sequences of most species form single clusters distinct from those of other species. As a result “mtDNA data and traditional taxonomic assignments tend to converge on what may be “real” biotic units in nature” (Avise and Walker 1999 Proc Natl Acad Sci USA 96:992). Although Avise and Walker’s original observation was largely based on terrestrial, temperate zone vertebrates, growing barcode libraries demonstrate similar patterning in diverse invertebrates, vertebrates, and protists in marine and terrestrial environments, and in tropical and temperate zones, and in at least some fungi and plants (see last week’s post on COI barcodes in red algae)
 What underlies the usual patterning of small differences within and large differences among most animal species? The unsolved puzzle is how to reconcile these two findings. Large differences among closely-related species indicates mitochondrial DNA undergoes rapid sequence evolution, and there are reasonable mechanistic explanations for why this might be so. On the other hand, rapid sequence evolution should also lead to accumulation of sequence diversity within species over time and in those with large populations. Instead the data shows a relative absence of variation within most species, including those thought to be ancient and those with enormous population sizes. I will set aside two of the usual suspects: population bottlenecks and small effective population size. Population bottlenecks are implausible given the diversity of species showing this pattern. Postulating a small effective population size is a restatement of the finding of absence of variation, not an explanation.
This table-napkin analysis leads me to selective sweeps as pruning mitochondrial diversity within species (eg Bazin et al 2006 Science 312:570, see also editorial and reader commentary). If selective sweeps restrict mitochondrial diversity, then the question becomes what is being selected for? Environmental adaptation seems unlikely, as restricted variation is seen in species that are as best one can tell morphologically and ecologically unchanged (eg see earlier posts on horseshoe crabs, salamanders). It might be there is little tolerance for genetic variation due to interactions of mitochondrial proteins with other cellular components, but if so there should be species with genetic stasis in mitochondrial DNA, just as there are many species with apparent morphologic stasis. However, in simple distance trees most species show roughly similar genetic distances.
I am intrigued by a time series of influenza A hemagglutinin gene evolution which reflects competition between virus and host and wonder if there might be some kind of competition that helps drive mitochondrial sequence evolution forward and at the same time suppresses variation. It is exciting there will be an EMBO workshop “Molecular Biodiversity and DNA Barcodes” May 2007 in Rome which may help answer scientific questions posed by DNA barcode data.
Saturday, December 23rd, 2006
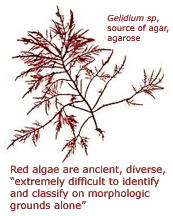 Red seaweeds, kingdom Rhodophyta, are “weird, wonderful, and extremely ancient” organisms distantly related to plants (Tudge 2000 The Variety of Life). Multicellular red algae arose at least 1.2 billion years ago, predating the earliest multicellular animals by 600 million years. Visual identification is challenging, as “morphology can be highly variable within and between species, and conspicuous features with which they can be readily identified are often lacking. In addition, highly convergent morphology is commonly encountered. …Identification is further compounded by the complexities of red algal life histories, many of which have a heteromorphic alternation of generations. Different life history stages of species have frequently been described as separate species and have only been linked through observations of life histories in culture and use of molecular techniques” (Robba et al 2006 Am J Botany 93:1101). Red seaweeds call out for DNA-based identification.
In a preliminary appraisal, COI barcodes “resolved accurately and unequivocally species identities” in three morphologically confusing species complexes of red algae (Saunders 2005 Phil Trans Royal Soc B 360:1879). In September 2006 Am J Botany, researchers from Natural History Museum, London, and University of Bristol, analyzed COI sequences of 79 specimens from 37 red algae, chosen to span 6 orders and represent species “extremely difficult to distinguish morphologically”. All species could be discriminated and intraspecific variation was generally much lower (0.0-0.7%) than interspecific differences (5.2-27.3%). Large intraspecific distances suggested the presence of cryptic species or incipient speciation in two cases. COI outperformed a commonly used genetic marker, the plastid Rubisco spacer, in revealing cryptic diversity. As is generally observed, “a good taxonomic foundation coupled with extensive sampling of taxa is essential for the development of an effective identification system.” A holiday wish for red algae identifiers: a well-curated DNA barcode library.
Tuesday, December 12th, 2006
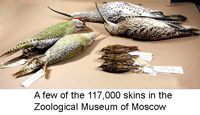 Labelling specimens helps make natural history museum collections valuable. Once specimens have been carefully examined by an expert, a species label can be applied. Labelled specimens can then be re-found and re-examined. Unsorted specimens lacking species designations are more raw material than scientific resource.
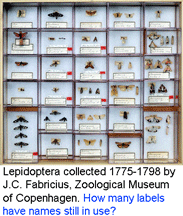
As in all sciences, taxonomic knowledge undergoes continuous revision. Changes in names and understanding of species boundaries may mean that specimen labels need to be updated in light of current knowledge. Partly to compensate, there is enormous effort to link current taxonomic understanding to historical species descriptions. Nonetheless, the accuracy of specimen labels may decay over time. In one study, a revision of predatory flies (Euscelidia) (Meier and Dikow Conservation Biol 2004 18:478), 83% of 1383 specimens from 19 collections were found to be incorrectly identified.
DNA sequences offer a simple approach to help keep specimen labels up to date. DNA sequences are an intrinsic, unvarying characteristic of a specimen. A DNA sequence from a standardized locus (ie a DNA barcode) can serve as a permanent “name” for a specimen. Results so far with more than 20,000 invertebrate and vertebrate species show it is generally straightforward to use a COI barcode to assign specimens to known species. Future taxonomic revisions may change  species names or boundaries, but that will not change DNA barcodes of specimens or the clustering patterns of barcode sequences. Thus it should be simple to use a specimen’s barcode sequence “name” to search a regularly revised public database for the current species name it corresponds to. A public database of sequences, specimens, and associated data as is BOLD can undergo continuous refinement, whereas revising labels in every collection around the world is impractical. Given that assigning specimens to species involves sorting among millions of species names, this approach does not have to give 100% resolution to species level to be valuable. It will be useful both for those species with unique barcode clusters or characters and for those sets of closely-related species with overlapping or indistinguishable barcodes.
Finally, on a related note I observe that diagnostic keys are unwieldy and not easily amenable to computerization. For example, Dragonflies of North America (Gainesville: Scientific Publishers, 2000) by Needham, Westfall, and May covers 350 species in 939 pages, or about 2.7 pages per species, which by my count is typical for diagnostic keys. At this rate, a world key for the 5500 known Odonates would run to 15,000 pages. The recondite language that is required to describe morphologic detail in this and other keys makes the tools inacessible except to highly-trained persons. On the other hand, anyone can interpret a DNA sequence. It is exciting that taxonomists and others are increasingly taking up the challenge of translating taxonomic knowledge into a much more widely-accessible format, namely DNA barcode libraries.
Wednesday, December 6th, 2006
Freshwater snails are intermediate hosts for schistosomiasis and flukes, trematode parasites that infect approximately 10% of world’s human population. Freshwater snails are also indicator species for water quality. Snail identification is essential for reducing disease burden and monitoring water quality.
 Researchers at the University of Frankfurt (November 2006 BMC Evol Biol 6:100) compared efficacy of morphologic and DNA-based taxonomy in freshwater snails in the genus Radix. Regarding Radix species in northwestern Europe, “species determination by shell morphology is difficult [and] unreliable…intraspecific variability of the putatively distinctive anatomical measurements largely overlaps among species” and identifications are “further complicated by recent nomenclatorial revisions”.
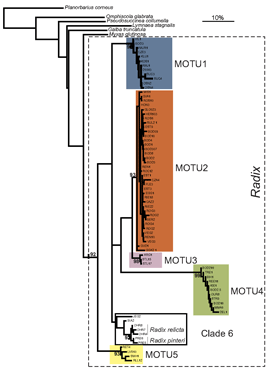
In their report, Pfenninger, Cordellier and Streit analyze morphology, mitochondrial COI and nuclear ITS-1 sequences, and describe breeding experiments with Radix snails collected at 60 sites throughout Europe. Using mtCOI sequences they found five MOTU (molecular operational taxonomic units), defined as “terminal clades with bootstrap support of 90% or more”. Populations of these MOTU overlapped broadly in geographic range and none corresponded to described species. Nuclear ITS sequences analyzed in a subset of specimens produced MOTU congruent with those generated by mtCOI.
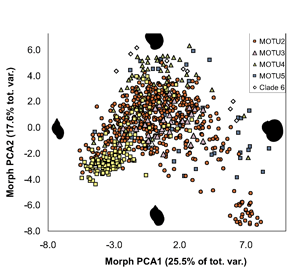 ALL crosses between individuals from the same MOTU population were viable, whereas NONE of crosses between individuals from different MOTU produced eggs. In morphometric analysis, Radix MOTU overlapped as shown at left, and in rearing experiments, shell shape changed in 4 of 5 populations, demonstrating phenotypic plasticity of putative morphologic characters. In northwestern European Radix snails, DNA trumps morphology.
This work follows what might be a “best practices” pathway for single-locus mtDNA species discovery, aka DNA barcoding applied to species discovery:
1. COI sequence clusters (MOTU), found in analyzing multiple specimens from geographically widespread locations, are proposed as putative species.
2. COI clustering is congruent with nuclear sequence data.
3. COI clusters show corresponding biological differences, such as morphologic characters, behavioral differences, or breeding incompatibility.
In some cases a virus or bacteria is recognized to be the causative agent even though not all of Koch’s postulates have been fulfilled. In a similar way in some cases it might be desirable to recognize mtDNA clusters as representing species without fulfilling all of the above criteria.
Thursday, November 30th, 2006
Growing barcode libraries challenge understanding. There are already about 200,000 mtCOI barcodes from about 25,000 species in BOLD, the Barcode of Life Data Systems Database. The burgeoning data sets hint at insights into biological diversity, revealed by looking at many species at once. A map of counties of the United States shows both large and small scale patterns, shaped by history, geography, and politics. Viewed through the lens of mitochondrial variation, what would a map of species show? Are differences among and within species similar in birds and butterflies? Do species boundaries differ in marine vs terrestrial species, or in tropical vs. temperate zones?
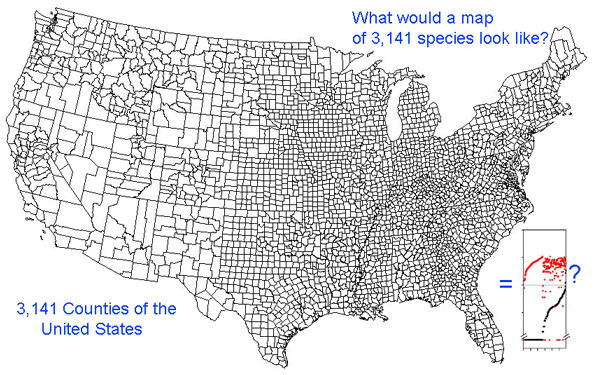
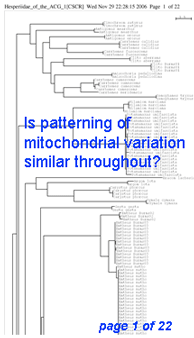 Here I offer one possible way of visualizing differences in barcode data sets using as an example the BOLD “Hesperiidae of the ACG 1” Project containing 2,185 COI sequences from 355 species of skipper butterfly in ACG conservation area in Costa Rica (Hajibabei et al Proc Natl Acad Sci USA 2006 103:968). The BOLD-generated neighbor-joining tree of ACG Hesperiid COI sequences shown at left offers a traditional way of comparing sequences and is an essential step in looking at individual species and their close genetic neighbors. However the NJ tree contains only about 100 sequences from 20 species per page, and so runs to 22 pages. In the future it will likely be desirable to compare much larger data sets from, say, all 3700 known species of world skipper butterflies.
For DNA barcoding, the essential information is differences among and within species. The higher-level groupings of species which are inevitably generated by a tree are of less interest. (In the following analysis distances are used simply to examine patterns of variation, NOT to determine whether they are sufficient for diagnosing species.)
One useful approach is to generate histograms of differences within and between species. BOLD has a “Nearest Neighbor” analytic function which generates a table of mean and maximum variation within each species, “nearest neighbor” distance to the next closest species, and histogram summaries of the results.
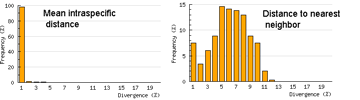 The histograms quickly show distances within most species are small and minimum distances between species are generally larger. Histograms are summaries with unlimited capacity. However, one might want to know more about individual species. For example, do species with higher intraspecific distances also show greater interspecific distances? One also wonders about the variation below 1% in both panels. In Beautiful Evidence, Edward Tufte points out histograms display relatively small amounts of data, usually 1 value per column. How to generate something with more information, more like the US Counties map, but not 22 pages long?
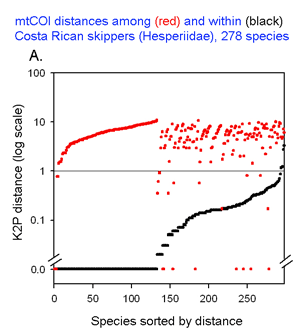
The graph at left uses the same 2 essential parameters: distance within each species and distance to nearest genetic neighbor. Because the usual distances within and between species are very different, plotting on a logarithmic scale allows one to inspect the variation in each set simultaneously. The results with 278 of the ACG skipper species (all those for which more than one individual was sampled, thereby generating a mean intraspecific distance) are shown. For each species, there is a black dot showing intraspecific distance and a red dot directly above or below showing distance to nearest neighbor. Sorting by intra- and interspecific distance allows the relative distances for each species to be seen. This graph highlights the relatively few species with nearest neighbor distances less than the mean intraspecific distance for that species. A line drawn at 1% appears to separate most of the intraspecific from interspecific values.
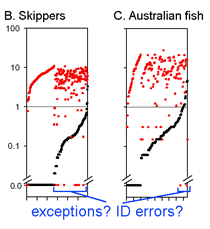 This graph is remarkably compressible, as shown by the small inset in the US county map above and in the figure at right. Here this is used to compare variation in Costa Rican skippers (278 species in 1 Family) to that in Australian fish (172 species in 1 Class) (Ward et al 2006 Phil Trans Royal Soc B 360:1471). The distribution of intraspecific variation seems quite similar while the nearest neighbor distances in fish are higher, presumably reflecting less dense sampling of a larger taxon. In the Fish paper, the red dots at bottom were thought to be ID errors, so perhaps some of the those in the skipper data set showing zero distance between species are taxonomic errors as well. This graphic approach could be useful in comparing patterning of intra- and inter-specific variation in marine vs terrestrial, tropical vs temperate, and allopatric vs sympatric species.
Thursday, November 23rd, 2006
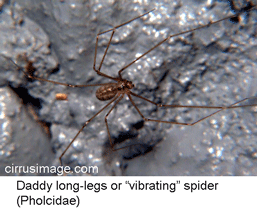 Two recent articles suggest how and how not to learn about applying mtCOI sequences to identifying species. In Zoologica Scripta 2006 35:441 researchers from Koenig Zoological Research Museum, Bonn, analyze 113 specimens of 61 morphologically-defined species of pholcid (daddy long-legs) spiders. Important for this analysis and for future study, collection locations are given and voucher numbers are provided for each specimen and DNA extract.
(Some pholcid spiders vibrate in their webs when disturbed, moving so rapidly they become invisible; here is a wonderful video)
16s and COI sequences were successfully amplified using a single primer pair for each gene from 79% and 80% of specimens, respectively. It is striking that strong clustering within species was observed despite using short segments of mtDNA (COI, 312 bp; 16s 287 bp), which are less than half as long as the standard 648 bp COI barcode. In NJ trees with either mtDNA sequence, all morphologic conspecifics grouped together and were reciprocally monophyletic (ie no overlaps between species). Likely splits based on large intraspecific distances and differing geographic distributions were observed in 6 (25%) of 24 multiply-sampled morphospecies.
The authors go on to propose graphic and statistical metrics to calibrate how well simple distances can define species limits. They find that mtDNA distances will often diagnose species: “tree-based taxon clustering and statistical taxon analysis indicate that molecular evidence does coincide with morphological hypotheses” and “we disagree with [Meyer and Paulay’s] point that independently of the group of organisms studied, a “barcoding gap” between interspecific and intraspecific distance values would likely disappear in studies featuring both dense within-species sampling and closely related species”, ie distance-based clustering often corresponds to species limits.
This study uses vouchered specimens from known locations and accurate modern sequencing technology, focuses on a relatively small clade (959 known species pholcid spiders), and analyzes in a positive way how distance measures might be used to define species, helping us learn about DNA barcoding as a tool for species identification.
In another recent study Syst Biol 55:715 2006 researchers from National University of Singapore examine COI sequences deposited in GenBank from Diptera (flies, mosquitos, and gnats). They found 449 of the 150,000 known species of dipterans represented, with multiple sequences from 127 species, and analyze these to “test two key claims of molecular taxonomy”. The scientists found that there were often large differences in COI within species and also frequent overlaps between species such that some sequences were more closely related to those of another species than to conspecifics. The litany of failures is quite long, including “even when two COI sequences are identical, there is a 6% chance they belong to different species”.
I do not understand why the authors put so much effort into analyzing such a heterogeneous set of data, except that they are worried about molecular taxonomy in general and DNA barcoding in particular. To my reading this study suggests that many GenBank records contain errors, either because current morphologic taxonomy is incorrect (for example, study cited above suggests probable splits in 25% of pholcid spiders), specimens used for GenBank records are incorrectly identified, or because DNA sequences in GenBank contain errors due to human factors or older sequencing technology. There must be some limitations to COI barcode identification of dipteran species, mostly presumably closely-related young species, but this study has not shown where such problems might lie.
I hope that future studies will use more of the “best practices” demonstrated in Astrin et al’s study of pholcid spiders and so help us learn more about how to apply COI sequences to species identification.
Thursday, November 16th, 2006
 Thrips are tiny (.5 to 2 mm) plant feeding insects; approximately 4500 species are known, and some are serious agricultural pests. Kladothrips is an Australian genus of at least 35 species which form galls on Acacia trees. In Biol J Linn Soc 2006 88:555 researchers from Flinders University, Australia, apply mtDNA analysis to show that two gall morpho-types of Kladothrips rugosus represent different species.
Originally described in 1907, K. rugosus is widely distributed across south and western Australia. Two gall types were noted, but no morphologic differences could be found in the thrips themselves. McLeish, Chapman, and Mound found pairwise uncorrected mtCOI p-distances were 0.0-0.6% within gall morphotypes, and 7.4-7.8% between, similar to distances within and among other gall thrips species. The authors aver the usual taxonomic distaste for distance measures (“Distance values are not intended as a means of identifying different species here, which is a problematic approach for species depiction, but as useful descriptors of genetic variation”). I translate this as distance measures can be used help discover new species, but are verboten in official species descriptions.
The only morphologic differences are that “abdominal segments  I-III are as brown as IV-VII, the metathorax is scarcely paler than the brown mesothorax and prothorax, and the sculptured reticles on the posterior half of of tergites II-III are all small and equiangular.” Phew! Not many persons could decipher such abstruse morphologic terminology, whereas DNA-based identification promises more democratic access to species identification. The main limiting factors are technological and likely solvable: establishing reference libraries and developing inexpensive DNA analytic methods.
The authors found a third genetic cluster in K. rugosus, but were unable to discover any morphologic characters, so did not describe this as a new species. This seems scientifically inconsistent, and the authors seem to agree: “This lack of morphologic divergence has evident problems for traditional taxonomy..we suggest that “morpho-taxonomy” is little more than an historical artifact in the methodology of species recognition, despite commonly providing the most practical methods”
I hope the large data sets emerging from the barcode initiative and other genetic surveys will enable taxonomists to develop consistent methods of species delimitation, whether in thrips or thresher sharks, and the sequences themselves or their diagnostic nucleotide characters will be routinely incorporated into species descriptions.
Tuesday, November 7th, 2006
 Insiders can be mistaken, in science and in other fields. At the beginning of the Human Genome Project, “the great majority of scientists dismissed the original proposal with hostility or indifference” (Great 15-year project to decipher genes stirs opposition. New York Times, June 5, 1990). The Times article details some of the initial negative reactions:
“Even if scientists manage to finish the genome project, it will have generated enormous reams of uninterpretable and often useless data”.
“The human genome project is bad science, it’s unthought-out science, it’s hyped science” said Dr. Martin Rechsteiner, a biochemist at the University of Utah. Some critics have begun aggressive letter-writing campaigns, urging colleagues who harbor similar sentiments to write Congress.
“Everybody I talk to thinks this is an incredibly bad idea,” said Dr. Michael Syvanen, a microbiologist at the Medical School of the University of California at Davis and a stout antagonist of the genome project.
Professional societies weighed in as well. A resolution adopted by the Council of the American Society for Biochemistry and Molecular Biology, and endorsed by the Federation of American Societies for Experimental Biology stated: “A large scale, massive effort to ascertain the sequence of the entire genome cannot be adequately justified at the present time… The Council wants to state in the clearest possible terms our opposition to any current proposal that envisions the establishment of one or a few large centers that are designed to map and/or sequence the human genome.” https://www.fasebj.org/cgi/reprint/1/6/502
This history comes to mind in reading the article by Hickerson, Meyer, and Moritz in October 2006 Syst Biol 55:729. According to their analysis, mathematical modelling predicts that DNA barcoding will often fail to discover young species. Their analysis is based on a classical model of speciation (Bateson-Dobzhansky-Muller) and “well-established population genetic theory”. I should tread lightly here, not being a population biologist! To my reading, these mathematical models are either unsupported or disproved by experimental evidence. The BDM model of biological species formation is “well-characterized, tractable, and its dynamics captures a range of speciation times implicit across many pre- and post-zygotic isolation models”, ie good for modelling, but is not derived from actual genetic data on differences between sister species. Genetic surveys including growing barcode libraries demonstrating limited intraspecific variation in diverse species across enormous differences in population size and generation time indicate that “well established population genetic theory” does not explain intraspecific mitochondrial diversity (Bazin et al 2006 Science 28:570).
Instead of making predictions about why barcoding will fail, I hope the same mathematic rigor will be applied to understanding why barcoding works as well as it does, why the variation within most species is low, why the distances between most species are large, and what determines the exceptions.