The Barcode Blog

A mostly scientific blog about short DNA sequences for species identification and discovery. I encourage your commentary. -- Mark Stoeckle

Subscribe to this blog

Sign up for email notifications

Comparing barcoding performance

Suggested metric, terminology, and standard graphic

How well do barcodes distinguish among species? A standardized, simple quantitative method and terminology for comparing barcoding performance among different data sets will be helpful.

In trying to answer this question, I aim to promote terminology that does not include “error”. In my view, it generally does not make sense to talk about the error rate of barcoding. Barcoding is an instrument akin to a telescope, except that it is designed to resolve species, not stars. A telescope that does not resolve a double star is not wrong, it simply lacks sufficient resolution. Also, the term error rate implies there is an accurate reference standard in species identification. As systematists emphasize, species definitions are hypotheses and frequently undergo revision. Thus in this view barcoding performance, effectiveness, and resolution are useful descriptive terms and are more informative than barcoding error rate.

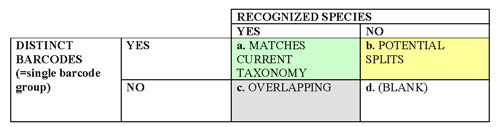
What we want is an approach that quantitatively compares barcoding with current taxonomy. In the future, taxonomy may incorporate some of the groups discovered through barcoding as recognized species, perhaps will combine some of the recognized species with overlapping barcodes into single species, and additional sequence data may enable resolution of species with overlapping barcodes. To start, a 2 x 2 table comparing recognized species to distinct barcode groups:

Barcode groups and species

Suggested terminology:

Barcode group (or cluster): the shallowest branch in a neighbor-joining tree that corresponds to one or more recognized species or potential split within a recognized species.

Distinct barcodes: a barcode group that corresponds to a recognized species or a potential split within a recognized species. This definition can incorporate whatever criteria are used for recognizing splits (such as criteria that have been used to define provisional species, ESUs).

Barcode resolution: #barcode groups/total #species, in which total #species includes recognized species plus provisional species/ESUs.

This definition of barcode resolution incorporates “partially-resolved” species, so that if, for example, 8 species are resolved into 4 barcode groups, then resolution for that set would be 4/8 = 50%. Alternatively, if idea of partial resolution is not helpful, resolution could be defined more simply as a + b (green + yellow)/total #species.

Suggested graphic: Applying this to recent barcode data sets:

Suggested standard graphic comparing barcode performance

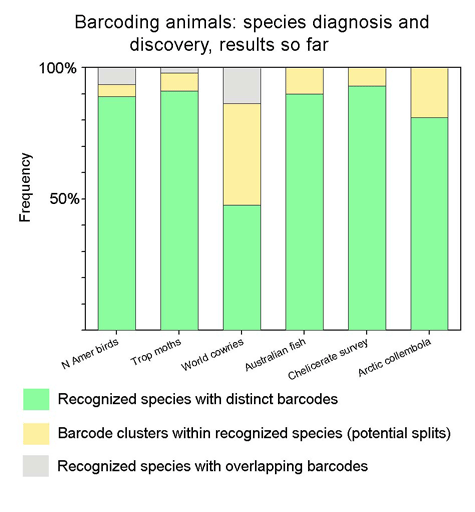
Suggested color scheme: As in table, green (=good!) matches current taxonomy; yellow represents novel species/provisional species/ESUs (yellow like an early bud that lacks chlorophyll), and gray (as in a gray indeterminate zone) represents recognized species with overlapping barcodes. By definition, all potential splits/ESUs have distinct barcodes, so d) in the 2 x 2 table is blank. As barcode findings are incorporated into taxonomy, I expect that the proportion that is green will increase—the greening of barcoding and taxonomy!

Mark Stoeckle

This entry was posted on Wednesday, March 15th, 2006 at 5:24 pm and is filed under barcode performance, General. You can follow any responses to this entry through the RSS 2.0 feed. Both comments and pings are currently closed.

One Response to “Comparing barcoding performance”

  1. The Barcode of Life blog » Blog Archive » Some Fret Over Exceptions to Barcoding Says:

    […] Regarding the utility of DNA barcoding, the findings with Melissa blues are unremarkable, as there are cases in all animal groups studied so far in which barcoding narrows identification to a few closely-related species, but no further. For example, see my earlier entry on a comparing barcode performance. It may be helpful to point out that DNA barcoding is an instrument, not a theory. Cases of partial resolution do not “disprove” barcoding or invalidate its use. In fact, one application of DNA barcoding will be to quickly highlight such cases which may be biologically interesting as they likely represent recent speciation, ongoing hybridization, or synonymy. […]

Contact: mark.stoeckle@rockefeller.edu

About this site

This web site is an outgrowth of the Taxonomy, DNA, and Barcode of Life meeting held at Banbury Center, Cold Spring Harbor Laboratory, September 9-12, 2003. It is designed and managed by Mark Stoeckle, Perrin Meyer, and Jason Yung at the Program for the Human Environment (PHE) at The Rockefeller University.

About the Program for the Human Environment

The involvement of the Program for the Human Environment in DNA barcoding dates to Jesse Ausubel's attendance in February 2002 at a conference in Nova Scotia organized by the Canadian Center for Marine Biodiversity. At the conference, Paul Hebert presented for the first time his concept of large-scale DNA barcoding for species identification. Impressed by the potential for this technology to address difficult challenges in the Census of Marine Life, Jesse agreed with Paul on encouraging a conference to explore the contribution taxonomy and DNA could make to the Census as well as other large-scale terrestrial efforts. In his capacity as a Program Director of the Sloan Foundation, Jesse turned to the Banbury Conference Center of Cold Spring Harbor Laboratory, whose leader Jan Witkowski prepared a strong proposal to explore both the scientific reliability of barcoding and the processes that might bring it to broad application. Concurrently, PHE researcher Mark Stoeckle began to work with the Hebert lab on analytic studies of barcoding in birds. Our involvement in barcoding now takes 3 forms: assisting the organizational development of the Consortium for the Barcode of Life and the Barcode of Life Initiative; contributing to the scientific development of the field, especially by studies in birds, and contributing to public understanding of the science and technology of barcoding and its applications through improved visualization techniques and preparation of brochures and other broadly accessible means, including this website. While the Sloan Foundation continues to support CBOL through a grant to the Smithsonian Institution, it does not provide financial support for barcoding research itself or support to the PHE for its research in this field.