The Barcode Blog

A mostly scientific blog about short DNA sequences for species identification and discovery. I encourage your commentary. -- Mark Stoeckle

Subscribe to this blog

Sign up for email notifications

Marine eDNA works–let’s get going!

January 14th, 2019

Together with Monmouth University, we hosted the first National Conference on Marine Environmental DNA, November 29-30, 2018. The Conference included approximately 100 American ocean scientists and associated stakeholders, including representatives from academe, federal, state, and local governments, non-governmental organizations concerned with marine environment, and the private sector. The strong sense of the meeting was “eDNA works–let’s get going.” The Conference Final Report and press release summarize the meeting and outline concrete steps forward. 


GoFish for Environmental DNA!

December 12th, 2018

Our “GoFish” paper is published in PLOS ONE (Stoeckle MY, Mishu MD, Charlop-Powers Z. GoFish: a versatile nested PCR strategy for environmental DNA assays for marine vertebrates). Excerpt from the abstract:

“GoFish assays amplify a mitochondrial 12S rDNA segment with vertebrate metabarcoding primers, followed by nested PCR with M13-tailed, species-specific primers. Sanger sequencing confirms positives detected by gel electrophoresis.

Unlike quantitative PCR (qPCR), GoFish does not require tissues of target and related species for assay development and a basic thermal cycler is sufficient. Unlike Illumina metabarcoding, indexing and batching samples are unnecessary and advanced bioinformatics expertise is not needed. From water collection to Sanger sequencing results, the assay can be carried out in three days.

The main limitations to this approach, which employs metabarcoding primers, are the same as for metabarcoding, namely, inability to distinguish species with shared target sequences and inconsistent amplification of rarer eDNA. 

This approach will be a useful addition to current eDNA methods when analyzing presence/absence of known species, when turnaround time is important, and in educational settings.”


DNA barcodes and Darwin

December 3rd, 2018

Our paper, “Why should mitochondria define species?“, is published open access in Human Evolution 2018; 33:1-40. It recently received a lot popular press attention claiming our work supports creationist views. This interpretation of our work is wrongheaded.

Our study is grounded in and strongly supports Darwinian evolution, including the understanding all life has evolved from a common biological origin over several billion years. Our study follows mainstream views of human evolution. We do not propose there was a single “Adam” or “Eve”. We do not propose any catastrophic events. We encourage interested persons to read our original article, not the recent press commentary.

DNA barcoding effectiveness supports a new view of how evolution works

July 7th, 2014

In July 2 PLOS ONE article,  “DNA barcoding works in  practice but not in (neutral) theory,” David Thaler and I argue a radically different view of how evolution works, as compared to the standard neutral model, is needed to account for the widespread pattern of limited variation within species and larger differences among that underlies the general effectiveness of DNA barcoding. The following text is adapted from the article.
journalpone0100755

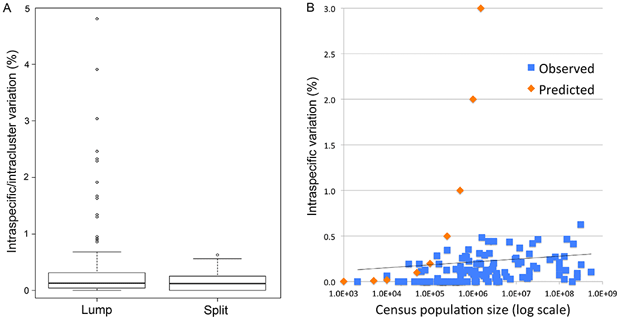
Fig. 1 (from PLOS ONE article). Intraspecific variation in birds is uniformly low across 100,000-fold differences in census population size. Apparent outliers reflect lumping of reproductively isolated populations.

“To to better understand the limits to DNA barcoding and the evolutionary mechanisms that underlie the usual barcode gap pattern, we used  birds to test whether differences within and among species conform to neutral theory, the reigning null hypothesis for mitochondrial sequence evolution. We analyzed apparent barcode gap exceptions in detail–those with unusually large intraspecific differences and those lacking interspecific differences.

From a practical point of view exceptions may help define limits to COI barcodes as a marker of speciation. In the context of evolutionary theory, exceptions may give valuable insight into the mechanisms controlling variance within and among species. Birds are uniquely suited this task: they are well represented in barcode libraries, have the best-known species limits of any large animal group, and, most critically, are the only large group with known census population sizes, a key parameter in neutral theory.

Neutral theory predicts intraspecific variation equals 2 Nµ, where N is population size and µ is mutation rate per generation. Although textbooks and scientific reports recognize a multitude of exceptions to this predicted relationship, deviations are subsumed under the rubric of “effective population size” and accounted for by ad hoc modifications to the theory, which is assumed operative.

Here we harness the unique resources of avian barcode libraries and census population data to look at the question the other way around, namely, do the empirical data show any signature of variance proportional to population size? If not, does the observed range of variation fit with commonly proposed modifications to neutral theory? In addition, we examine whether molecular clock measurements conform to neutral theory prediction that clock rate equals µ.

This is the first large study of animal mitochondrial diversity using actual census population sizes and the first to test outliers for population structure. We demonstrate uniformly low intraspecific mitochondrial DNA variation in birds regardless of population size. Nearly all apparent exceptions reflect lumping of reproductively isolated populations (many of which represent distinct species) or hybrid lineages. To our knowledge, this is the first large test of neutral theory applied to mitochondrial diversity using actual census population measurements rather than crude proxies of population size such as phylogeny or body weight, and the first to test outliers for population structure.

In contrast to prior analyses, we find uniformly low intraspecific variation regardless of census population size. Universally low intraspecific variation contradicts a central prediction of neutral theory and is not readily accounted for by commonly proposed ad hoc modifications. We conclude that this finding together with the molecular clock phenomenon are strong evidence that neutral processes play a minor role in animal mitochondrial evolution.

We argue a radically different view of evolution–extreme purifying selection and continuous adaptive evolution–is needed to account for the widespread pattern of limited variation within species and larger differences among that underlies the general effectiveness of DNA barcoding.”

I hope you enjoy!


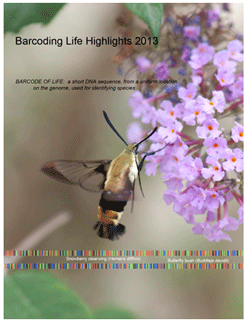
Barcoding Life Highlights 2013

October 25th, 2013


DSC_0017bcdeIn recognition of the Fifth International Barcode of Life Conference opening next week in Kunming, China, we offer Barcoding Life Highlights 2013.

This eight page pdf takes a look at notable developments since the 2011 conference in Adelaide, Australia, offers a big picture view of barcoding’s flourishing first decade, and features hot links to papers, organizations, and databases.

We hope you enjoy!


Phylogenetically diverse COI dataset extends evidence that rare variants are often errors

January 18th, 2013

In October 2012 Nature 490:535, Breen and colleagues reported on amino acid variation among 13 mitochondrial protein and 2 nuclear proteins based on alignments of 3,000-53,000 sequences representing 1,000 to 14,000 species. They found that on average, a given site in a protein accomodates 9 different amino acids. Based on the distribution of variants, they conclude that epistasis (interaction among genes) strongly constrains molecular evolution.

Here Kevin Kerr and I re-analyze their large COI dataset [19,000 sequences (8,300 human); 4,700 species], generously provided by senior author Fyodor Kondrashov. Our aim is to determine if the frequency matrix approach we applied to avian BARCODEs (PLoS ONE 2012 e:43992) can be used to identify errors in a more phylogenetically diverse dataset.  As the authors note, sequencing error is a potential confounder for their analysis; they used a different approach to assess error than we present here.

Brief methods. COI nucleotide alignment opened in MEGA, translated using appropriate table (~95% of COI dataset is insects or vertebrates), and exported to Excel; frequencies calculated at each amino acid position, and amino acid letter sequences converted into amino acid frequencies. For this analysis we defined rare variants as amino acids present in fewer than 0.02% (1/5000) sequences. In this dataset, rare variants comprised about half (46%) of the total amino acid diversity. For analyses illustrated below, we excluded the 8,281 human sequences, which had very few (8) rare variants.

Results

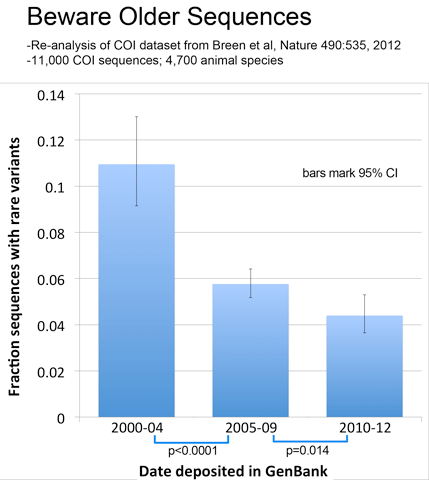
As observed with avian BARCODEs, rare variants in this dataset were less common in newer sequences,  consistent with improved sequence quality over time.


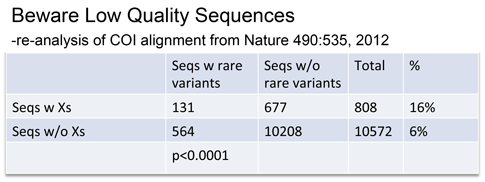
Rare variants were associated with low quality sequences–those with internal N’s, generating unknown “X” amino acids.

Lastly, a thought experiment applying the error rate from our PLoS ONE paper suggests that significant artifactual amino acid diversity is expected when error rate x dataset size is equal to or greater than 1, conditions that may be met by large datasets particularly those containing older sequences as in this COI alignment.

These results reinforce our published observation that a frequency matrix approach is a useful and important tool for analyzing error among large datasets. We hope that others will utilize this approach.

Regarding the findings of Breen and colleagues, our re-analysis suggests that error makes a greater contribution to amino acid diversity in this dataset than that calculated by authors, although the main conclusion of their paper regarding epistasis would likely be unchanged.


DNA barcoding a hardy urban denizen

December 14th, 2012

In 2009, high school students found novel DNA barcode types in American cockroaches (Periplaneta americana) in New York City (DNAHouse). Hoping to learn more about this feared and despised yet ineradicable urban denizen, we are starting a National Cockroach Project. A quick summary so far:

What     High school students and other citizen scientists collecting and helping analyze American cockroaches using DNA barcoding.

Why      Genetic diversity is a window into evolution and patterns of migration. American cockroaches originated in Africa and hitchhiked around the world on commercial goods. This project asks:

  • Do American cockroaches differ genetically between cities?
  • Do US genetic types match those in other parts of the world?
  • Are there genetic types that represent undiscovered look-alike species?

How      To participate, collect a cockroach!

What you need   

  • American cockroach (dead)
  • Specimen label with collection location, date
  • Mailing materials (form with instructions on NCP home page)

What you get

  • Thrill of scientific discovery using DNA
  • Cool, icky topic to talk about with friends
  • DNA sequences you can analyze to study evolution

For more information including how to track down and identify an American cockroach, see NCP home page. I hope you will find this project fun and participate in the crowd-sourced collection effort!


Google search leads to CBOL

December 5th, 2012

Following the first Banbury workshop in March 2003, Jesse Ausubel and I wrote a “Draft Scientific Rationale and Strategy” that described DNA barcoding as ““Google” for Life Forms” (with the name in quotes in case readers didn’t get the reference, hard to imagine today!). One year and a second Banbury workshop later the Consortium for the Barcode of Life (CBOL) was inaugurated at Smithsonian Institution, National Museum of Natural History, Washington, DC.

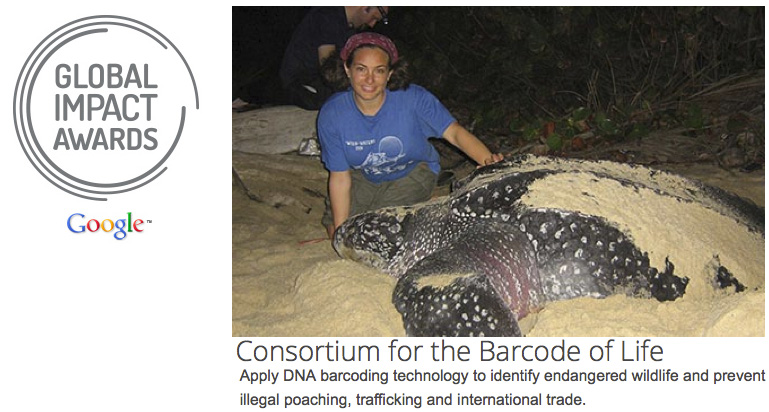
This week the Google Foundation announced a $3 million Global Impact Award to CBOL to enable a DNA barcode reference library for endangered species (and their close relatives) as a tool to prevent illegal wildlife trafficking.  As in 2003, this is a wonderfully natural pairing of organizations and a cause for the entire barcoding community to celebrate.

In the language of today, we can see the DNA Barcoding/Google for Life Forms is a kind of “open access” to taxonomic knowledge.  It may turn out that the ability to identify species, like the ability to search the internet, will have wider consequences than we currently forsee. In The Viral Storm: The Dawn of a New Pandemic Age (2011), author Nathan Wolfe cites the 2008 high school student DNA barcoding ‘Sushi-gate’ project as “one of the first notable examples of nonscientists “reading” genetic information.” As a Cassandra, Wolfe envisions this as a first step towards DIY bioterrorists but I imagine it is more likely a first step towards DIY biologists sequencing everything in sight, helping monitor the health of the environment, including tracking spread of human and animal diseases.


More on BARCODEs as BIG DATA: Visualizing evolutionary constraint (II)

November 26th, 2012

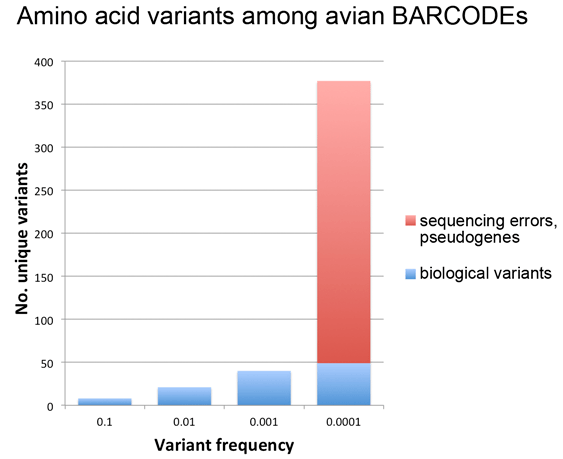
Last week’s post looked at amino acid variation among avian BARCODEs (11,000 sequences, 2,700 bird species). The findings were that common variants (present in >0.1% of sequences) are few and restricted in terms of types of amino acid substitutions, while rare variants (present in <0.1% of sequences) are many and diverse, the latter consistent with our published observation (PLoS ONE 2012 e:43992) that most rare variants in this dataset are sequencing errors.

Here I follow-up on this observation to look more closely at the same dataset, this time asking what is the relationship between variant frequency and number? For this analysis I separated probable biological rare variants (found in 2 or more individuals of a species) from those that were likely sequencing errors or contained in pseudogenes (more details in PLoS ONE paper).

As shown in figure below, this analysis gave what looks like a surprisingly simple relationship between variant number and frequency, which presumably reflects some evolutionary principle assuming it is not an accidental feature of this particular dataset. It may be of interest to analyze amino acid variant frequency and number among BARCODE datasets from other taxonomic groups.

A larger version of this figure is available here.


Visualizing amino acid variation in a large BARCODE dataset

November 21st, 2012

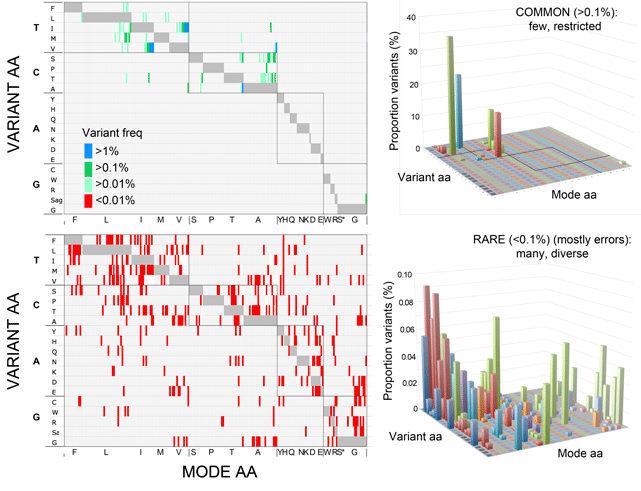
In PLoS ONE 2012 e:43992 Kevin Kerr and I reported that most of what appeared to be rare nucleotide and amino acid variants in avian BARCODEs were in fact sequencing errors, based on finding these were strongly concentrated at the ends of the amplified barcode segment. Here I look at the nature of common and rare amino acid substitutions in this same dataset of 11,333 avian BARCODEs from 2,709 species. Do these support our inference that rare variants are mostly errors?  I believe the large figure below says yes.

The more common variants (present in >0.1% sequences) are shown at top and the rare variants (present in <0.1% sequences) at bottom. The left shows variants at each of the 216 amino acid positions, sorted according to the mode amino acid (shown in gray) and grouped by codon 2nd position nucleotide. At right, the proportion of substitutions for each amino acid is shown, weighted according to the modal amino acid frequency.

The main observation is that common variants are relatively few in number (69) and type (mostly isoleucine (I) <–> valine(V)), suggesting strong biological constraints on allowable variation.  On the other hand, rare variants are many (377) and diverse, which is what one would expect if these are largely sequencing errors.

A larger version of the figure is here, and the Excel file used to generate the figure is here.

I think there is potentially more of interest here in terms of allowable substitutions. For example, Breen et al Nature 2012 490:535 recently demonstrated that molecular evolution is highly constrained by epistasis, such that most mutations are not allowed in a given context, which is presumably what underlies the restricted variation in avian COI. (Breen and colleagues calculations were based on alignments of 2 nuclear and 14 organellar genes, the latter including COI.) In a general way this makes sense–birds can have different kinds of feathers but none have scales like fish. It might be of interest to compare COI amino acid variation in birds to other barcode datasets such as fish or lepidoptera.

Happy Thanksgiving!


Contact: mark.stoeckle@rockefeller.edu

About this site

This web site is an outgrowth of the Taxonomy, DNA, and Barcode of Life meeting held at Banbury Center, Cold Spring Harbor Laboratory, September 9-12, 2003. It is designed and managed by Mark Stoeckle, Perrin Meyer, and Jason Yung at the Program for the Human Environment (PHE) at The Rockefeller University.

About the Program for the Human Environment

The involvement of the Program for the Human Environment in DNA barcoding dates to Jesse Ausubel's attendance in February 2002 at a conference in Nova Scotia organized by the Canadian Center for Marine Biodiversity. At the conference, Paul Hebert presented for the first time his concept of large-scale DNA barcoding for species identification. Impressed by the potential for this technology to address difficult challenges in the Census of Marine Life, Jesse agreed with Paul on encouraging a conference to explore the contribution taxonomy and DNA could make to the Census as well as other large-scale terrestrial efforts. In his capacity as a Program Director of the Sloan Foundation, Jesse turned to the Banbury Conference Center of Cold Spring Harbor Laboratory, whose leader Jan Witkowski prepared a strong proposal to explore both the scientific reliability of barcoding and the processes that might bring it to broad application. Concurrently, PHE researcher Mark Stoeckle began to work with the Hebert lab on analytic studies of barcoding in birds. Our involvement in barcoding now takes 3 forms: assisting the organizational development of the Consortium for the Barcode of Life and the Barcode of Life Initiative; contributing to the scientific development of the field, especially by studies in birds, and contributing to public understanding of the science and technology of barcoding and its applications through improved visualization techniques and preparation of brochures and other broadly accessible means, including this website. While the Sloan Foundation continues to support CBOL through a grant to the Smithsonian Institution, it does not provide financial support for barcoding research itself or support to the PHE for its research in this field.