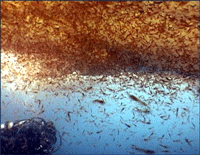
 Krill are shrimp-like crustaceans found throughout the world’s oceans. The Antarctic krill, Euphasia superba, is thought to be the most abundant species on the planet in terms of biomass (500 million metric tonnes corresponding to 5 x 10^14 individuals), is a primary food source for whales, seals, and oceanic birds, and functions as a major planetary carbon sink by excreting waste that sinks to ocean floor. What does this very abundant, central-to-food-web species eat? For many animals, observation of eating behavior is impractical, and analysis of stomach contents or feces may be the only way to determine diet. However, such material may be morphologically unrecognizable.
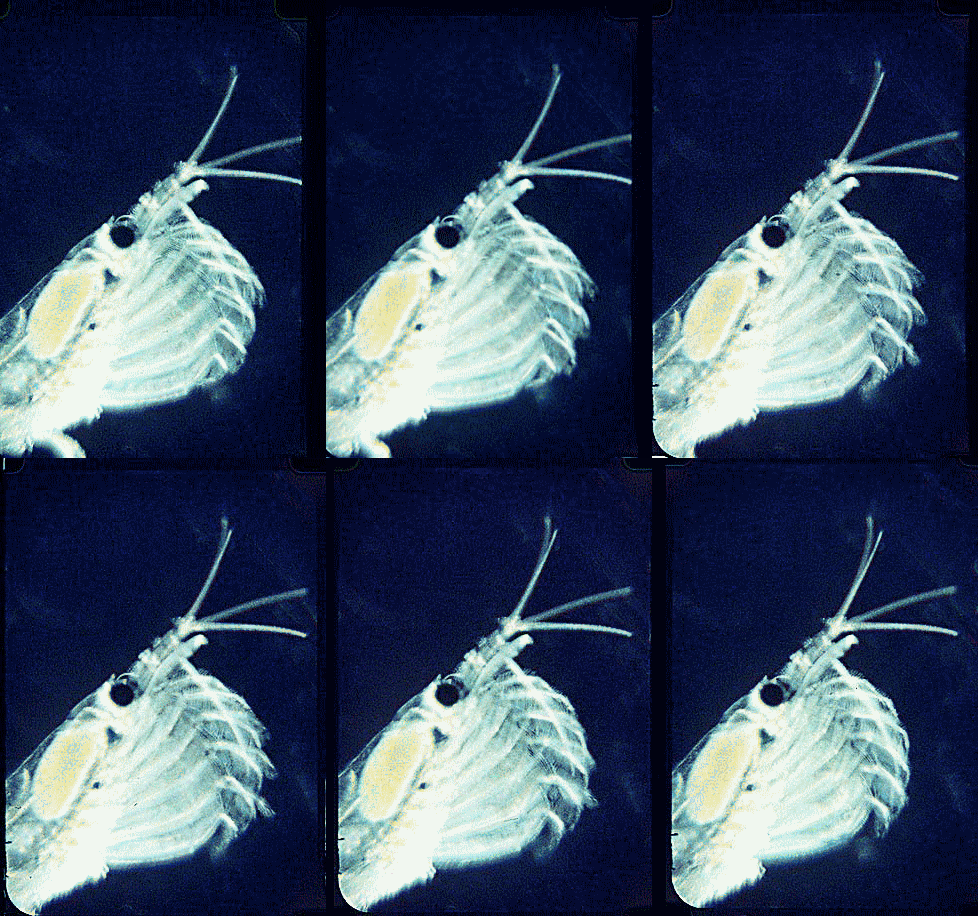 In August 2006 Marine Biotech 8:686, researchers from University of Tasmania and Department of Environment, Tasmania, compare DNA sequencing and light microscopy in identifying prey in stomach contents of E. superba. Passmore et al isolated DNA from stomach contents of 6 ethanol preserved krill and, using diatom-specific primers, amplified a 103 bp portion of nuclear small subunit RNA (ssRNA). ssRNA was used because at present it has the best taxonomic representation in GenBank for krill prey species. The researchers sequenced at least 50 clones from each individual krill and found 14 OTUs (operational taxonomic units), with 86% to 100% match to GenBank sequences. These results were compared to microscopic identification of diatom silica skeleton fragments in stomach contents, which involved counting 1000-3000 fragments per individual. Results were similar, although DNA analysis and light microscopy each appeared more sensitive for certain species. This study might be a best case for light microscopy because silica-skeletoned diatoms are not easily digested. As the authors point out, krill also consume a range of protozoa and small zooplankton, and the importance of these sources may be underappreciated.The authors conclude “the application of DNA diet analysis to krill warrants further investigation, particularly for prey that are difficult to study using other methods“.
This work shows the essential need for a comprehensive reference library, so far lacking. A study underway is examining mitochondrial and nuclear genes as barcodes for phytoplankton. Looking ahead, a “massively parallel” pyrosequencing approach could enable rapid and representative analysis of mixed environmental samples, such as stomach contents, without biases resulting from amplification and cloning.
 Rather than cracking the tough nut of an ideal plant barcode, Taberlet and co-authors look at a simple approach “emphasizing the point of view of scientists other than taxonomists“, and test this on food plants in archeological and industrial applications. The chloroplast trnL intron is not the most variable non-coding region in chloroplast DNA and does not differ enough to separate many closely-related plant species. On the plus side, there are robust primers which amplify the intron from diverse species. Like other group I introns, the trnL intron sequence has catalytic activity and a conserved secondary structure with alternating conserved and variable sequence domains. Taking advantage of this feature, the researchers designed primers to amplify one of the variable domains, the P6 loop. Binding sites for both the trnL primers, which amplify the entire intron, and the P6 loop primers are “highly conserved among land plants, from Angiosperms to Bryophytes“. Importantly, the P6 loop is only 10 to 143 bp and can be amplified from degraded DNA.
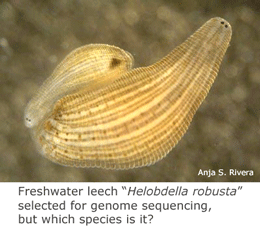 In
In 
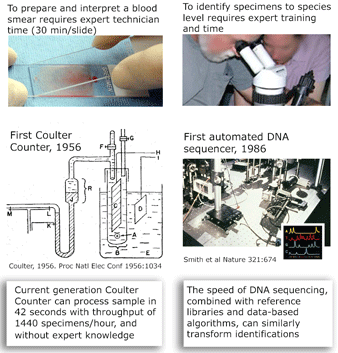 and what is needed to harness DNA taxonomy in general and DNA barcoding in particular to speed description of the estimated 80% of earth’s biodiversity that is at yet undescribed: “a feedback loop that [uses] discrepancies between DNA and other data to refine species descriptions..founded in existing theory of evolutionary biology and phylogenetics”
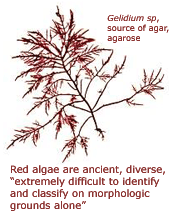 Red seaweeds, kingdom Rhodophyta, are “weird, wonderful, and extremely ancient” organisms distantly related to plants (Tudge 2000 The Variety of Life). Multicellular red algae arose at least 1.2 billion years ago, predating the earliest multicellular animals by 600 million years. Visual identification is challenging, as “morphology can be highly variable within and between species, and conspicuous features with which they can be readily identified are often lacking. In addition, highly convergent morphology is commonly encountered. …Identification is further compounded by the complexities of red algal life histories, many of which have a heteromorphic alternation of generations. Different life history stages of species have frequently been described as separate species and have only been linked through observations of life histories in culture and use of molecular techniques” (
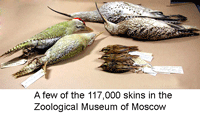
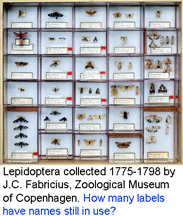
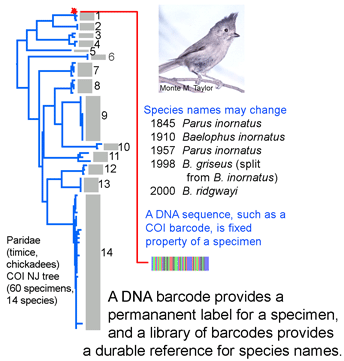 species names or boundaries, but that will not change DNA barcodes of specimens or the clustering patterns of barcode sequences. Thus it should be simple to use a specimen’s barcode sequence “name” to search a regularly revised public database for the current species name it corresponds to. A public database of sequences, specimens, and associated data as is
 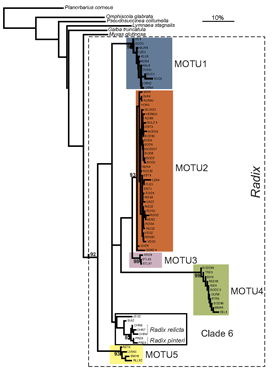 Researchers at the University of Frankfurt (
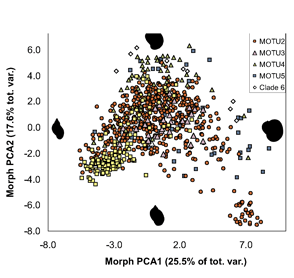 ALL crosses between individuals from the same MOTU population were viable, whereas NONE of crosses between individuals from different MOTU produced eggs. In morphometric analysis, Radix MOTU overlapped as shown at left, and in rearing experiments, shell shape changed in 4 of 5 populations, demonstrating phenotypic plasticity of putative morphologic characters. In northwestern European Radix snails, DNA trumps morphology.
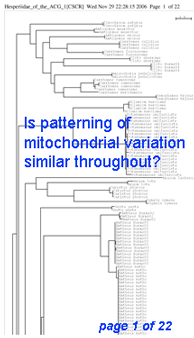 Here I offer one possible way of visualizing differences in barcode data sets using as an example the
  The histograms quickly show distances within most species are small and minimum distances between species are generally larger. Histograms are summaries with unlimited capacity. However, one might want to know more about individual species. For example, do species with higher intraspecific distances also show greater interspecific distances? One also wonders about the variation below 1% in both panels. In
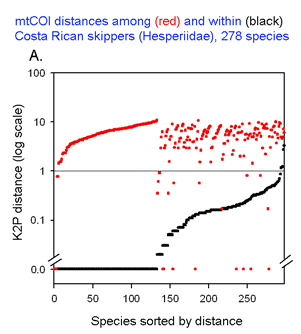
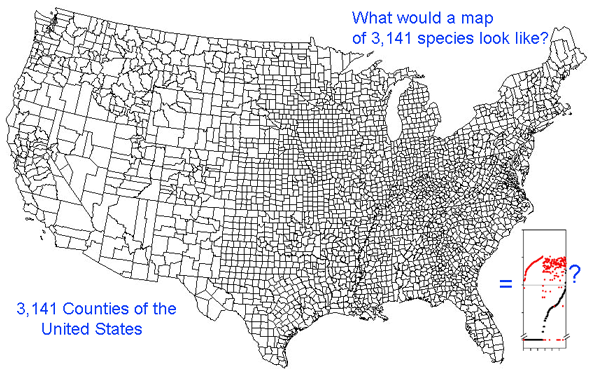
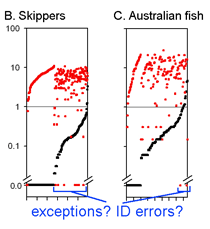 This graph is remarkably compressible, as shown by the small inset in the US county map above and in the figure at right. Here this is used to compare variation in Costa Rican skippers (278 species in 1 Family) to that in Australian fish (172 species in 1 Class) (