Barcode stats reveal progress, challenges, opportunities

As Dirk Steinke’s recent blog post demonstrated, since the seminal 2003 Proc Royal Soc London B Biol Sci paper by Hebert, Cywinska, Ball, and DeWaard, barcoders around the world have been generating scientific papers at a steadily growing pace. For more on the big picture, here I share three barcode stat visuals put together in preparation for the Third European Congress for the Barcode of Life (ECBOL3) in September.

Q: How many specimens have been barcoded?

A: A lot.

As of September 2012, about 600,000 specimens have barcode records in GenBank, about half of which qualify for BARCODE[keyword] based on CBOL data standards. This reminds me to recognize the special challenges barcoding has as a genomics project–the target number of specimens is enormous and each requires expert identification and long-term storage in a museum or herbarium.

In addition to GenBank/BOLD public records, at the time of the survey there were another 1.2 million barcode records in BOLD  which lack species names. Probably most represent what Rod Page called “dark taxa“–difficult to identify specimens from undescribed species. It is an unsolved puzzle how much effort to devote to barcoding specimens that can’t or haven’t been identified to species. On the one hand this approach speeds species discovery, as documented in blog post cited above; on the other hand, many specimens will wait a very long time for the right taxonomist to come along and in the meantime the sequences alone may not be very useful to science. I should point out that for many dark barcodes, the sequences are public, are labeled with an order level identifier (e.g. Vertebrata) and BIN (see below), and include specimen photographs.
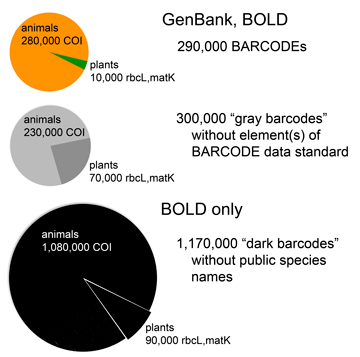
One possible solution is assigning “names” based on barcode sequences themselves, such as Barcode Index Number (BIN) system instituted in BOLD. This sidesteps the wait for an expert human to assign a traditional Latin binomial but does not link the sequence to other biological information about the organism the way a species name does. Researchers recently estimated there are about 8.7 million eukaryotic species, of which about 2 million are named  (Mora et al PLoS Biol 2011). Given the very large array of undescribed (mostly small) life, how should barcoders proceed?  The Human Genome Project seized on what was a radical idea and technologically difficult at the time–namely,  sequencing the whole genome rather than just the expressed genes. Does an analogous approach of sequencing the whole eukaryotic biome of 8.7 million predicted species make sense?  Let’s say we had sequences for all these forms–what new knowledge or capabilities would we have? I favor a stepwise approach focused on barcoding organisms already named, particularly those are already in collections and those important to society. There will be plenty of species discovery along the way.

Other dark barcodes are simply records for which the researchers have assigned a species name but are not posting it publicly. The importance of making sequence data public quickly was recognized at the 4th International Barcode of Life Conference held in Aidelaide last year (for one example of rapid publication of DNA barcode data see Schindel 2011 ZooKeys). Open access, data sharing, and transparency have been embraced by many scientific fields and their funders and I hope barcoders already have or are moving to adopt these principles.

Q: How many species have been barcoded?

A: A lot.

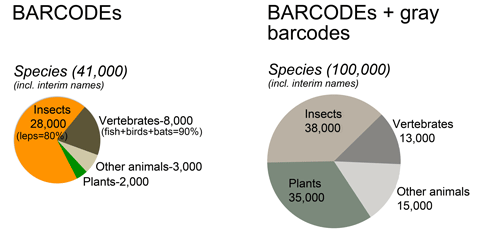
GenBank holds barcode sequences for about 100,000 species, mostly insects, vertebrates, and plants, and about 40,000 qualify for BARCODE keyword. Nearly all BARCODE records so far are from animals, mostly lepidoptera and vertebrates.
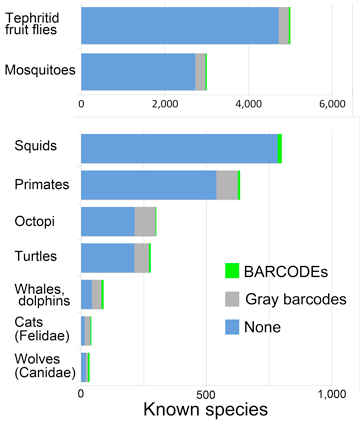


Q:  What groups important to science or society have few barcodes?

A: Quite a few.  

These suggest opportunities for scientific progress and grant support. They include human and animal disease vectors, agricultural pests, threatened and endangered species, and notable marine groups.

Powerpoint of slides available here.
How accurate are BARCODE databases?

DNA barcode databases are a kind of wikipedia of DNA identifiers, with contributions by thousands of researchers. How accurate are they?  How do records that meet the BARCODE standard compare to routine GenBank records? How many BARCODE records represent pseudogenes masquering as their functional counterparts?

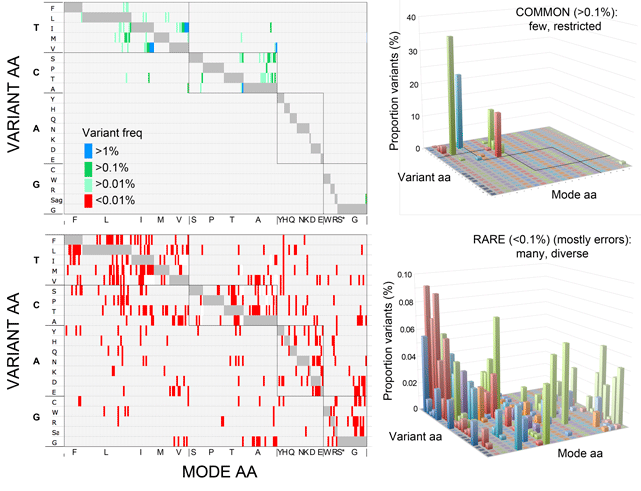
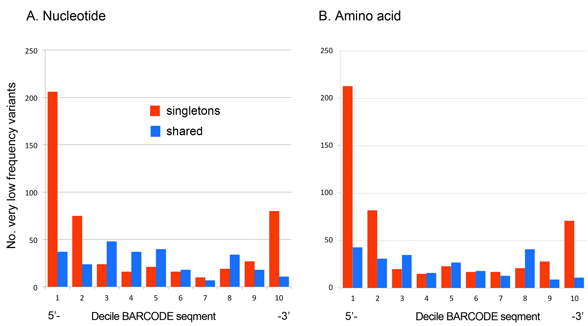
In case you missed this, Kevin Kerr and I recently analyzed sequencing error among 11,000 avian BARCODEs representing 2,700 bird species (PLoS ONE e43992 2012), using a frequency matrix approach to look at patterns of variation. As illustrated below, we found that very low frequency nucleotide variants (VLFs) found in single individuals of a species (labeled “singletons” in figure) are strongly concentrated at the ends of the barcode segment, consistent with sequencing error.

In contrast, very low frequency variants found in two or more individuals of a species (labeled “shared” in figure) provided a nice control–these were relatively evenly distributed, consistent with biological origin. Not surprisingly, given that most of the very rare nucleotide variants were associated with amino acid substitutions, very rare amino acid variants showed the same distribution patterns.

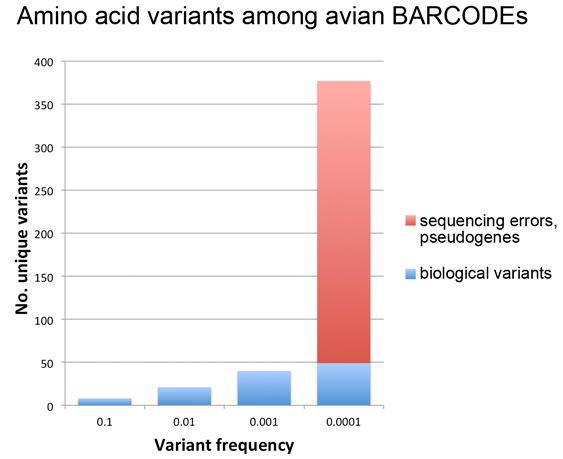
In addition to analyzing sequencing error, we closely examined the small fraction (0.1%) of BARCODEs with multiple very low frequency variants shared among individuals of a species. Based on review of trace files deposited as part of BARCODE standard, these unusually divergent versions of COI turned out to be overlooked cryptic pseudogenes lacking stop codons!

We were able to calculate an error rate for the dataset, using observation that most (94%) second codon positions were >99.9% conserved, which meant that nearly all sequencing errors at second position sites would be detectable as very low frequency (<0.1%) variants. The calculated upper limit of sequencing error was 8 x 10⁻⁵ errors/nucleotide, which is 1-2 orders of magnitude higher than generally cited for direct Sanger sequencing of amplified DNA, but unlikely to compromise species identification.  Overall, we found about 3% of BARCODEs have 1 or more errors (ave 1.4). To our knowledge, this is the first assessment of sequencing error for a large public sequence database with multiple contributors. It might be useful to annotate those records with probable sequencing errors or that represent cryptic pseudogenes; I believe that annotation is possible in BOLD and not in GenBank.

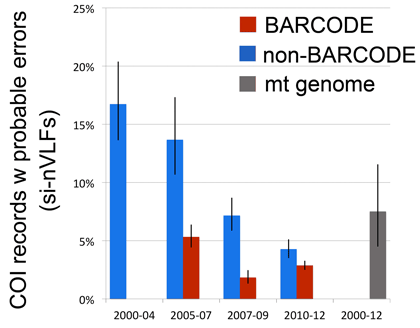
In addition to confirming the high quality of the avian BARCODE database we were able to demonstrate significant quality improvement in avian BARCODE and non-BARCODE COI records deposited in GenBank over the past decade as shown at right (bars indicate 95% confidence interval).

The frequency matrix we describe has potential application for genetic database quality assessment, discovery of cryptic pseudogenes, and studies of low-level variation.

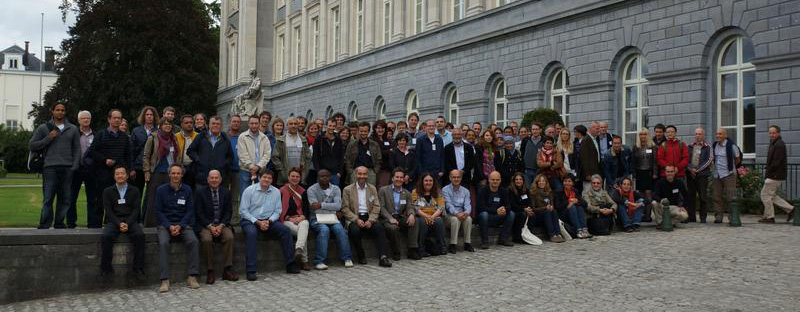
Our results were presented at the Third European Congress for the Barcode of Life (ECBOL3) held at Royal Flemish Academy of Belgium for Sciences and the Arts (KVAB) in Brussels in September (group photo below).

Powerpoint based on PLoS ONE article is available here: freq matrix stoeckle 8nov2012

DNA IDs bushmeat carrying exotic viruses

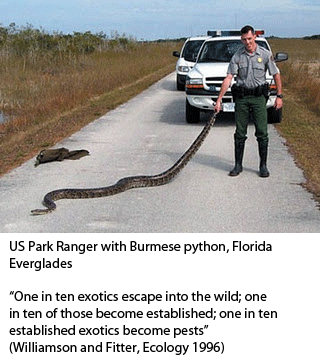
Zoonotic viruses are like introduced species–most perish, a few cause localized outbreaks, and a tiny fraction spread widely. Unfortunately, the tiny fraction have ruinous potential.

Human immunodeficiency virus (HIV), a retrovirus that jumped from chimpanzees to humans less than 100 years ago, now infects about 34 million people, with over 30 million deaths so far. Human T-cell lymphotropic virus (HTLV-I) another introduced non-human primate retrovirus, is endemic in many human populations around the world, and may result in a so far untreatable, slowly-progressing ascending paralysis.

In 2009, a previously unknown coronavirus (related to human cold viruses) from masked palm civets caused a global epidemic of SARS. A diversity of other viruses from a diversity of animal hosts have demonstrated ability to cause  high mortality outbreaks with person-to-person transmission including Nipah virus (fruit bat paramyxovirus), Ebola virus (primate filovirus), lassa virus (mouse arenavirus), and rabies (rhabdovirus with primary reservoir in bats).

What else is out there? An untold diversity of vertebrate viruses, some fraction of which have the potential to cause human epidemics, perhaps particularly those from primates and bats.  It makes sense to keep an eye on viruses in animals and products derived from animals and to limit human exposure to known or potential pathogens.

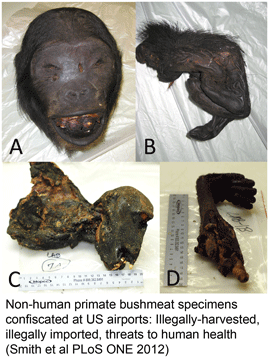
In January 2011 PLoS ONE 19 researchers from seven institutions including US Centers for Disease Control report on exotic viruses in bushmeat (meat of African wild animals) seized at five US ports of entry. In this pilot study, Smith and colleagues analyzed tissues derived from parts of 44 individual animals, mostly non-human primates, found in 26 passenger-carried or postal shipments intercepted between 2008 and 2010, plus additional tissues from body parts of 16 non-human primates seized by US Fish and Wildlife Service in 2006, which were part of a successful federal smuggling prosecution. For confiscated specimens lacking external morphological features, species identity was determined by COI barcode and/or other mitochondrial genes. As an aside, I note that the phrase “DNA barcode” is in the methods section references but does not appear in the text. I view this as a kind of progress, a reflection of how barcoding is now a usual way to confirm species identity. When a method is fully established, it recedes into the background. For example, in medicine we say “the white blood cell count is 10.7,” not “the white blood cell count as determined by Coulter counter is 10.7.”

The seized bushmeat included 25 individual animals representing five non-human primate species [2 chimpanzees (Pan troglodytes ellioti; IUCN Red List endangered), 2 mangabeys (Cercocebus atys; IUCN vulnerable), 10 baboons (Papio papio; IUCN near threatened), 5 guenons (Cercopithecus nictitans), 6 African green monkeys (Chlorocebus sabaeus)], and 35 rodents from at least two species  [32 confirmed or suspected cane rats (Thryonomys sp.), and 3 unknown rat species]. It is unclear from the article how many of the specimens were barcoded to determine species identity.

Samples were screened by PCR for multiple bacterial and viral pathogens. Pathogenic viruses were found in tissues from all 5 non-human primate species, including strains of cytomegalovirus and lymphocryptovirus (both herpesviruses) and 4 strains (3 of which were novel) of simian foamy virus (a retrovirus). So we have many things wrong–endangered species, illegally harvested and imported, carrying potential threats to human health. How big is the problem? According to the authors, although “the amount and characteristics of bushmeat reaching US borders is not well described…[one] study estimated that 273 tons of bushmeat was imported every year into Paris…on Air France carriers alone” (Chaber et al 2010 Conserv Lett). The threats to endangered species and human health from bushmeat trade are one part of the enormous traffic in wildlife (120 million live animals and 25 million kilograms of non-live wildlife are imported annually into US) (Pavlin 2009 Emerging Infect Dis). The authors conclude with a call for “broader surveillance efforts and pathogen identification and discovery techniques in wildlife and wildlife products…to further mitigate potential risks.” Let’s hope they do so.

FDA certifies barcoding for seafood ID, opening commercial, educational opportunities

Seafood is often mislabeled–in the past year, barcode surveys in Canada (Hanner et al 2011), Ireland (Miller et al 2011), Spain (ICIJ 2011), United Kingdom, and United States (Boston Globe, October 2011; Consumer Reports, December 2011) documented 10-50 percent mislabeling of fish items, always as more expensive or more desirable species, including those sold at prominent restaurants and stores. As highlighted in 2011 Oceana report, mislabeled seafood is commercial fraud, exposes consumers to health risks, and hides unsustainable fishing practices. However, identifying seafood is challenging–hundreds of species from around the world enter the marketplace, often as filets or steaks lacking distinguishing external features. In October 2011, US Food and Drug Administration (FDA) formally adopted DNA barcoding for seafood identification, the culmination of validation studies conducted by FDA beginning in 2008. The summary states:

“Substituted and/or mislabeled seafood is considered to be misbranded by the FDA and is a violation of Federal law.”

FDA adoption of DNA barcoding as an identification standard opens commercial opportunities. On January 2, Vancouver Sun reported that Tradex Foods, a Canadian frozen seafood importer, is using DNA barcoding to help eliminate what their spokesperson described as “rampant” mislabeling in the industry. Tradex collects 10 to 30 samples a month at overseas processing facilities, flies these to US for testing by ACTG, Inc. in Illinois at $70 a sample with turnaround time of 2-3 days, while the frozen fish itself is in transit by ship. The article reports that Canadian Food Inspection Agency (CFIA), the federal agency responsible for verifying quality and labeling of seafood imports, expects to begin employing DNA barcoding in 2012. SGS Group, a global testing company, including food product safety, recently posted a press release on The Open Press highlighting the need for seafood testing and the FDA adoption of DNA barcoding, as well as the company’s capability. Applied Food Technologies, in Florida, is a molecular diagnostics company for food industry, specializing in seafood identification, with turnaround time of 5-10 days according to their website.

Routine testing of food and biologicals such as herbal medicines seems likely to be one of the largest and most visible applications of DNA barcoding. I expect that other companies are in or will enter this market.

I look forward to incorporation of DNA barcoding in forensic certification programs, with applications in marketplace fraud as with food, illegal trade of wildlife, and murder investigation, by dating time of death by identifying insect larvae in corpses. Already effective, DNA barcoding including for forensic applications is poised to expand, thanks to strong trends improving speed and sensitivity in DNA recovery and decreasing costs of DNA analysis.

Update 9 jan 2012: My comments above on food authentication echoed in  “Will DNA barcoding revolutionise the food industry” article in yesterday’s Metro, distributed free to commuters in 50 UK cities , circulation 1.3 million.

Rapid data release for barcode data

At the Fourth International Barcode of Life Conference in Adelaide, there was general recognition that the initiative’s remarkable success in generating barcodes is outstripping the relatively slow process of releasing experimental data after academic publication. Of approximately 1.4 million barcode records in BOLD at the time, fewer than 300 thousand sequences with species names were publicly available, and the proportion of barcode sequences that are published and have species names appears to be be falling further behind over time, as the rate of barcoding specimens increases. Given that privately held sequence data does not contribute to the overarching goal of creating a community resource for society and science, this stimulated many discussions on how to proceed. Many cited the rapid data release policies hammered out by the genomics community as a precedent.

At a 1996 summit in Bermuda, leaders of the scientific community agreed on a groundbreaking set of principles requiring that all DNA sequence data be released in publicly-accessible databases within twenty-four hours after generation. These “Bermuda Principles” (also known as the “Bermuda Accord”) contravened the typical practice in the sciences of making experimental data available only after publication. These principles represent a significant achievement…and have established rapid pre-publication data release as the norm in genomics and other fields.  https://en.wikipedia.org/wiki/Bermuda_Principles

Human genomics is not the same as biodiversity genomics–barcodes are derived from a multitude of often irreplaceable specimens for one, but the general principle of rapid data-release contributing to a community resource, for what is after all, an enterprise funded by society, surely holds.

What follows is one strategy for academic publication AND rapid data release which we hope will encourage others. With the assistance of ZooKeys (open access), GenBank, and BOLD, on December 8, 2011, a brief “Project Description” of a barcode dataset (see below), completed just two weeks earlier, was published coincident with release of sequence data in GenBank and BOLD, with a full descriptive paper summarizing the dataset to follow in the next six months. A set of explicit statements regarding use of early release data (see below) is included in the Project Description.

Title: Project Description: DNA Barcodes of Bird Species in the National Museum of Natural History, Smithsonian Institution, USA

Abstract: The Division of Birds, National Museum of Natural History, Smithsonian Institution in Washington, DC, has obtained and released DNA barcodes for 2,808 frozen tissue samples. Of the 1,403 species represented by these samples, 1,147 species have not been barcoded previously. This data release increases the number of bird species with standard barcodes by 91%. These records meet the data standard of the Consortium for the Barcode of Life and they have the reserved keyword BARCODE in GenBank. The data are now available on GenBank and the Barcode of Life Data Systems.

Excerpt regarding use of early release data:

The authors invite the research community to examine and analyze the data in their current form with the following understandings:

• As with all data released on GenBank, the National Center for Biotechnology Information places no restriction on their use or distribution.

• The authors intend to publish a descriptive paper summarizing the dataset and its implications for bird barcoding and any taxonomic issues arising from the data. Publication of this data release paper is anticipated by 1 June 2012. In accordance with the Fort Lauderdale Principles (Welcome Trust 2011), the authors ask the community to respect our intent to publish on these topics and not to submit manuscripts for this purpose based on this dataset.

• Use of this dataset for purposes other than those described above are welcome and encouraged, contingent on proper citation of this publication.

• The authors invite members of the community to examine the data and test their accuracy relative to other datasets. We welcome your comments, suggestions and corrections. BOLD 3.0 includes the capability to submit annotations to data submitters and we encourage readers to use this new system to submit observations on this dataset.

• The species determinations are not yet final. Some of the species identification may be change by the time of publication of the data release paper (anticipated by 1 June 2012).

I hope to soon see more public barcode data, following this and other pathways!

DNA Barcoding Prizes for first Nature, Science publications

First proposed in 2003, the DNA barcoding initiative has generated more than 1000 scientific publications, but none so far in the de facto top science journals, Nature and Science. The barcode library contains over 1 million records from over 100 thousand species, suggesting opportunities for new insights into large-scale patterns and processes in biodiversity. Yet so far relatively few papers have attempted synthetic exploration of this unprecedented genetic resource beyond species identification. To encourage high-profile discovery, Program for the Human Environment is offering $5000 prizes for the first DNA barcoding papers in Nature and Science, as announced earlier this month at the close of Fourth International Barcode of Life Conference, University of Adelaide, Australia. To qualify, the paper must embrace DNA barcoding either in the title or abstract, and cite CBOL and iBOL in the acknowledgments.

Tea time for DNA

What’s in your favorite tea? The dried and sometimes cooked or fermented bits of plants used to make teas are not easily identified to species by appearance. Over the past year I have been involved in a project testing whether DNA barcoding can identify the ingredients in commercial tea products, working with three New York City high school students and plant experts from Tufts University (Selena Ahmed) and The New York Botanical Garden (Damon Little). Student investigators Katie Gamble, Rohan Kirpekar, and Grace Young collected 146 tea products from 25 NYC locations, representing 33 manufacturers, 17 countries, and 82 plant common names–73 products were regular teas (prepared from Camellia sinensis, the tea plant) and 73 were herbal products prepared from other plant species.

Our findings are published in 21 July 2011 Scientific Reports, (Nature Publishing Group’s open access journal). About 1/3 of herbal teas generated DNA identifications indicating unlisted ingredients including weeds like annual bluegrass (Poa annua) and white goosefoot (Chenopodium album) and herbal plants like chamomile (Matricaria recutita). Matching DNA ingredients to listed ingredients was sometimes challenging–we observe that “broad-scale adoption of plant DNA barcoding may require algorithms that place search results in context of standard plant names and character-based keys for distinguishing closely-related species.”

We are pleased that our investigation has attracted press coverage including New York Times print and online editions and internationally in 65 news sites and 14 countries, including India and China, world centers of tea production. Most of the DNA work was done at The New York Botanical Garden in senior author Damon Little’s laboratory. For a small subset of samples (10) we did DNA isolation and amplification in my dining room with recycled lab equipment purchased on the internet for about $5000. Samples were mailed to a commercial facility (Macrogen) for DNA sequencing, with results available by email the next day. It cost about $15 a sample including sequencing (unidirectional). More info and pictures on our TeaBOL website!

What’s next? I am excited about enabling wider use of DNA barcoding by high school students, including Cold Spring Harbor’s Urban Barcode Project competition (I am an advisor), open to teams from all New York City schools, with a focus on public institutions. I expect that soon manufacturers of teas and herbal products (and regulators) will incorporate DNA barcode testing into their quality control practices. One of the important tasks for scientists is building up the reference databases. At the time of the study, BOLD (Barcode of Life Database) and GenBank lacked rbcL or matK records for about 1/3 of plant species listed on product labels in our study. More on herbal plant identification: (Lou et al 2010. An integrated web medicinal materials DNA database. BMC Genomics 11, 402; Smillie and Kahn 2010. A comprehensive approach to identifying and authenticating botanical products. Clin Pharm Therapeutics 87, 175).


Taxonomy disentanglement

Veneridae, commonly known as venus clams, are the largest family of heterodont bivalves (clams and cockles), with about 500 named species, all marine, distributed in mostly shallow water areas around the globe.  In June 2011 Plos ONE, researchers from Fisheries College, Ocean University of China apply DNA barcodes to perform what they call “taxonomy distentanglement” on 315 venerid specimens representing about 60 species collected along the coast of mainland China. This qualifies as the largest analysis of DNA barcodes for marine bivalves to date. Chen and colleagues note “species boundaries of these clams are difficult or even impossible to define accurately based solely on morphologic features,” so there is a potentially a big role for DNA characters.

The clams were collected over a 6 year period from 2004-2010, stored in 95% ethanol (marine specimens are traditionally stored in formalin, which is an effective preservative but makes it difficult to recover DNA), and deposited as voucher specimens in Fisheries College. DNA was extracted from adductor muscle (some bivalves inherit mitochondrial DNA from both male and female parents, but the male type is restricted to gonadal tissue). Given that not many bivalves have been barcoded, it is of interest to learn what primer pairs were effective (BOLD taxonomy browser lists barcodes for 966 of the approximately 10,000 bivalve species).  Starting with Folmer primers, two additional published sets and 4 sets developed for this study were used if needed, with recovery of COI from all specimens.

I note that genetic differences within Family Veneridae are remarkably large–average pairwise COI K2P distance within the family (not counting conspecific and congeneric comparisons) is around 35% and maximum is over 50%. For comparison, in birds, average and maximum distances within families are about half as large, and even within birds as a whole (Class Aves, i.e., two hierarchical levels above family), average and maximum distances are only 20% and 33%, respectively (I generated bird stats by merging public projects in BOLD and running “Distance Summary.”) I wonder if what we call Families in vertebrates and invertebrates reflect different levels on the evolutionary tree.

Back to the paper. Chen and colleagues used neighbor-joining, maximum-likelihood, and MOTU analysis to examine their data with and without 310 additional venerid sequences downloaded from BOLD/GenBank. All individuals that could be morphologically identified to species possessed distinct (reciprocally monophyletic) COI sequences, with the exception of one species pair. 11/23 sequences from specimens that could not be identified morphologically formed five monophyletic clusters, likely representing species new to science or unreported in China. The remaining 12 sequences from morphologically-puzzling specimens clustered within named species, suggesting these represent morphologically variant specimens. Sorting puzzling specimens into genetic clusters led the authors to recognize previously overlooked diagnostic morphologic characters.  A number of existing records in BOLD/GenBank prior to this study clustered with different species, suggesting these specimens were misidentified by submitters or reflected outdated taxonomy.

Chen and colleagues conclude that DNA barcoding has a third purpose in addition to species identification (assigning unknown specimens to known species) and species discovery (flagging divergent clusters), namely what they call “taxonomy disentanglement,” which other authors have called iterative or integrative use of barcoding (for example Smith et al,  Extreme diversity of tropical parasitoid wasps exposed by iterative integration of natural history, DNA barcoding, morphology, and collections, 2008 PNAS). I like the term “disentanglement”–it brings to mind the many confusions in existing classifications and specimen labels, many of which can be unknotted with DNA barcodes.

News Flashes

You have 1 more day! Abstract deadline is 12 midnight tomorrow, June 15,  for the Fourth International Barcode of Life Conference, Adelaide, Australia, 28 November-3 December 2011. Online submission form here.

Young scientists to help document what lives on Earth! Coastal Marine BioLabs (CMB), a private, research-based scientific educational organization in Ventura, California was awarded a 3-year NSF grant to train high school teachers and students in DNA barcoding, with the goal of contributing reference sequences to Barcode of Life Database. CMB students and their teachers will be part of the International Barcode of Life project, which aims to expand BOLD (currently about 1.2M barcodes from 130K species) to 5M records from 500K species, the largest biodiversity intiative ever. For more on how students are helping build the genetic database of global species diversity, see Sacramento Bee news story and CMB web page.


Barcode of Life Connect tops 1000 members! If you haven’t already, I encourage you to visit and join the Barcode of Life Connect site, a “network to allow DNA barcoding professionals to discuss issues, share profiles, form special interest groups, and more.”The more includes webinars and links to upcoming relevant conferences. The core of the site is the chance to connect with like-minded barcoding professionals, either directly through their profiles or through discussion groups–so far there are 40 groups ranging from “Medicinal Plants” to “Madagascar” and “Portugese-Speaking Barcoders.”


To get an idea of how barcoding has taken hold around the world, particularly with young scientists, try perusing recent pictures posted by Connect members–I take the liberty of re-posting some images of the investigators and their specimens-enjoy!