Citation: Technological Forecasting and Social Change 50: 113–131 1995
Analyses of time series data beginning in the mid-nineteenth century in the industrialized nations, especially the United Kingdom, show that on average people are working significantly less while living longer. Although the average career length has remained around 40 years, the total life hours worked shrank for an average British worker from 124,000 hours in 1856 to 69,000 in 1981. The fraction of disposable lifetime hours spent working declined from 50% to 20%. Meanwhile the female share of career years doubled to 30%. If the long-term trends continue at their historic rates, the work week might average 27 hours by the year 2050. The secular trend away from the formalized work contract to other socially obligatory activities and free time implies numerous challenges for human societies.
“Even if…the betterment of human fate can be effected only very slowly and fitfully by means of down-to-earth demands and cold calculations, the real lever remains nonetheless the unreasoned belief in the movement towards an edenic future, and after all that is also the only leaven of the generations of our youth.” André Breton, “Ode to Charles Fourier,” 1945
Keywords: Labor, longevity, population
Areas of Research: Technology & Human Environment
I. Introduction and Definitions
Laborers have sought to shrink hours of work since time immemorial. Farm machines and external energy inputs to agriculture, culminating in the cheap and dependable tractor, provided the big break (Marchetti, 1979). With these, 80 percent or more of the population could live decoupled from the fields and move to town. As it turned out, the urban jobs to which people migrated initially demanded more time on an annual basis than the farm jobs.
Work time in the early period of industrialization increased dramatically, up to 14-16 hours per day (Nowotny, 1989). The factory schedule extended the peak periods of agriculture, such as the harvest, to an all-year norm in early industries, such as textiles. At the same time, a qualitative transformation, in particular, continuous monetary evaluation of work time, occurred in the transition to industrial time (Hareven, 1982).
With the increasing monetization of the economy, strengthening of government statistical offices, more systematic tax collection, and rise of labor movements, estimation of hours of paid work becomes possible for many countries in the middle to late nineteenth century. For well-documented industries such as manufacturing, railroads, and coal mining, the estimates appear accurate. Jones (1963) discusses in detail the methods used to make these estimates. We have not been able to locate reliable, consistent, continuous time series data on work time in agriculture and industry prior to the 1850s.[1]
Work time in this paper refers to the number of hours a person engages in contracted and compensated work, whether aggregated for a week, year, or lifetime. The work time data to be presented and discussed cover only this regular salaried or compensated work and include both part-time and full-time jobs. They omit paid vacations, holidays, and sick leave, which are included in the concept of total time paid for, a complementary series published by the U.S. Bureau of Labor Statistics and similar offices. Neither do the work time data cover housework or unpaid voluntary work, which we will refer to as unpaid labor time. Total socially obligatory activities embrace formal paid work as well as unpaid, informal work, child care and housework, and voluntary activities. We will refer to the combination of work time and unpaid labor time as total labor time. In contrast, free time may be allocated to various other activities, including leisure. The combination of unpaid labor time and free time is referred to here as non-work.
The most complete and consistent long time series on work time we have found are for the United Kingdom (Armstrong, 1984; Matthews et al., 1982; Williams, 1983), so we rely heavily on these. Moreover, the UK’s long history of industrialization and leading position over much of this period make it an especially interesting subject of study.
The plan of the paper is as follows. First, we analyze the quantitative trends in work time in the United Kingdom and other industrialized nations, then we compare the changing shares of life hours allocated to work and non-work, next we examine total labor and free time, and finally we discuss causes and consequences of the trends. We make gender as well as international comparisons. The fundamental fact, as we shall see, is that lifetime hours at work diminish, both absolutely and relatively.
II. Reductions in Work Time: The UK
Total life hours of work are the product of years in a career, weeks worked per year, and hours worked per week. We will discuss these three variables in turn for men, women, and then the total labor force.
When the data begin in 1856, a career for a UK male averaged about 47 years (Figure 1). Before education became mandatory, work began young, often around 10, and healthy men labored until they died. Armstrong (1984) estimated that careers for male workers lasted as long as 55 years for the surviving cohort. However, few lived to experience the natural end of such a long working career, so on average the duration was much shorter.[2] At age 10 males expected only about 48 more years of life, and at age 20 about 40 more years. With a total life span of less than 60 years, few felt the need for pensions. The average male career lengthened to 52 years in the 1930s, as a result of increased life expectancy, and has shortened since. The current duration of the average male work career is practically unchanged from the middle of the 19th century.
Table 1. Changes in Lifetime Hours at Work UK 1856-1981 (in hours).
| Measure | Men | Women | ||||
| 1856-1931 | 1931-1981 | 1856-1981 | 1856-1931 | 1931-1981 | 1856-1981 | |
| “Working Less”1 | -36,760 | -12,497 | -49,257 | -18,845 | -16,698 | -35,543 |
| “More holidays”2 | -1,744 | -8,534 | -10,278 | -720 | -3,280 | -4,000 |
| Shorter/Longer Work career3 | +11,674 | -13,779 | -2,105 | -2,675 | +19,268 | +16,593 |
| TOTAL | -26,830 | -34,810 | -61,640 | -22,240 | -710 | -22,950 |
1Changes in hours worked per week (lower values for women due to their shorter work career).
2Changes in weeks worked per year (lower values for women due to their shorter work career).
3Changes in years worked.
Lifetime Work Hours (1,000)
| 1856 | 1931 | 1981 | |
| Men | 149.7 | 122.9 | 88.0 |
| Women | 62.8 | 40.5 | 39.8 |
Vacations, holidays, and other reductions to weeks worked per year gradually increased from less than 2 to about 6 weeks between 1856-1981. Decreases in the number of weeks worked per year amount to about 17% of the total reduction in work time for UK males over this period (Table 1). More dramatically, the average weekly work time dropped by one-third from 63 to fewer than 42 hours between 1856-1981. Changes were both gradual and discontinuous, illustrating the importance of institutional and legal forces in the regulation of working hours.
Women in the United Kingdom, like men, work fewer hours per week and also enjoy more vacation, but notably, are lengthening their careers (Figure 2). Prior to World War II, the length of female careers averaged under 20 years. In 1950 the average female career began stretching and has now reached 30 years. The average female work week of some 29 hours in 1981 is 30 percent lower than for male workers due to the significant share of part-time jobs of women.
The average length of a career for the entire male and female UK work force has changed little (Figure 3). During more than a century 40 years remain the reference point. Reductions in career length of male workers have balanced corresponding increases in female participation rates and career lengths. The stable duration of a career sharply contrasts the strong decline in hours worked during the average career.[3]
Simple arithmetic on the data of Figures 1 and 2 yields estimates of life hours at work. Stable, long trends emerge (Figure 4). Lifetime hours at salaried work have been reduced for males by 42%, from 150 to 88 thousand hours, and for females by 37%, from 63 to 40 thousand hours. For women, most of the reduction came prior to 1931. Because 1931 was the nadir of an economic depression which brought high unemployment and restructuring of the labor force, we somewhat arbitrarily choose that year as the hinge to break the analysis into greater detail (Table 1). Since then, women’s lifetime work hours have shrunk only around 700 hours. The reductions from shorter work days and weeks as well as longer vacation periods have been almost offset by the rise in average female career length.
For the whole work force, the average per capita reduction in lifetime hours at work between 1856-1981 amounted to about 55 thousand hours, from 124 to 69 thousand hours. We have no information on changes in the variance or on subpopulations within the work force other than by gender. Our data and analysis are also limited to averages for the working population that may be quite different from what individuals would experience over their lifetime. We have not been able to identify similar long term data sets that would allow to follow many successive generations or age cohorts over time.
Extrapolating a linear trend would suggest that gradually both men and women will work less: in the year 2050 women possibly 30 and men about 70 thousand hours during a lifetime.[4] The hours worked by women and men seem to converge slowly, reducing the gender gap between male and female work roles in society.
In fact, when the data on work careers for women and men are examined together, women appear to be gradually substituting for men in the labor force (Figure 3). While in the middle of the 19th century some 30 percent of the work force was female, their share has increased to about 40 percent at present. This increase, together with the lengthening of female careers since 1950, multiplies the share of labor by women in the UK workplace when calculated over the entire work career period. The female share of career-years doubled from about 15% in 1856 to 30% in 1981.
If we hold constant at the 1980 value the length of the male and female careers at 46 and 30 years, work weeks at 46 per year for both genders, and female participation in the work force at 40%, and speculate that the trends of Figure 4 continue into the future, projected lifetime hours in 2050 would translate to a 33 hour workweek for men and a 22 hour workweek for women, or 27 hours for both men and women. Clearly, all the variables can change. As in the past their evolution will be much more discontinuous than suggested by a smooth trend line. We present this scenario because the duration of the workweek is probably most easily appreciated.
Consider briefly reasons for the steady reductions of life hours of paid work. Social scientists have long sought explanations for changes in work time. In A Theory of Wages, Douglas (1934) saw reduction in hours of work as an outcome of decisions by workers when rates of pay have increased. Workers choose to divide the benefits of productivity gains between additional income and leisure. Douglas also viewed reduction in years spent in the labor force as a consequence of higher family incomes and government expenditures on pensions. Owen (1978, 1979) reviewed and extended the economic argument, exploring how entrepreneurs in a competitive market will try to minimize their labor costs by seeking the hours schedule that will attract the best labor at the cheapest cost. He argued that changed preferences of employees will induce employers to shorten hours of work, all to minimize labor cost. Several economic studies pertain at the level of the household (e.g., Ghez and Becker, 1975; (Becker, 1976). Sociologists such as Dumazedier (1989) have emphasized the role of permanent scientific revolutions enabling workers to produce more in less time. The relative power of different social classes and groups then distributes the time thus generated, along with the wealth produced, according to historians such as Thompson (1967).
One might summarize by saying that several plausible theories contend to explain declines in working time, but difficulties also persist with their applications. From a phenomenological point of view, economists are hard-pressed to explain why the propensity for reducing work would persist over more than 100 years and a wide range of incomes. The market economics also do not explain adequately the similar trends we document later in nations where labor markets have been tightly controlled by government. Moreover, some empirical findings show that higher wages increase rather than decrease hours of work (National Commission for Manpower Policy, 1978). Among managers and professionals, evidence is mixed that higher wages reduce work hours (Harriman, 1982). Schor (1991) finds that annual hours of fully employed Americans increased modestly between 1969-1987. Other challenges arise in explaining the differing behavior of men and women. Can a pure economic argument explain the discontinuity that occurred in female work careers in the United Kingdom in the 1950s? There is also a question of heterogeneity. Aggregate data tend to mask large differences within the working population and also between generations as illustrated in the different life biographies of different birth cohorts (cf. Blossfeld et al., 1989, and Mayer, 1990). We agree with Sharp (1981) and Juster and Stafford (1991) that the economics of time are little studied and poorly understood. Common to the contending theories are the inexorable forces of technological change, as remarked by Leontieff (1978), a point to which we shall return.
III. Reductions in Work Time: International Comparisons
Should we generalize from the case of the United Kingdom to other countries? Although long time series data on lifetime work hours are unavailable, data on annual average hours worked[5] are available for numerous countries. Trends in annual hours worked should be revealing in view of the observed stability of the length of the work career. Szalai et al. (1972) and Blyton (1985) further reassure us by showing many similarities in time budgets in dozens of countries.
Until about 1930, reductions in annual per capita work time were similar in the industrialized countries, as shown in Table 2 and Figure 5. Thereafter, North America and Europe made larger downward adjustments in work time than Japan, with a re-convergence as well. Since the mid-1980s the decline in working hours appears to have slowed down, even reversed in some countries (Marchand, 1992). This has certainly been an additional factor accentuating the unemployment problems in a number of countries.Table 2. International Comparison of Hours Worked (effectively)5 per Person Per Year
(Source of Data: Maddison, 1991).
| YEAR | FRANCE | FRG | UK | USA | JAPAN | RATIO OF JAPAN/USA |
| 1870 | 2,945 | 2,941 | 2,984 | 2,964 | 2,945 | 0.99 |
| 1890 | 2,770 | 2,765 | 2,807 | 2,789 | 2,770 | 0.99 |
| 1913 | 2,588 | 2,584 | 2,624 | 2,605 | 2,588 | 0.99 |
| 1929 | 2,297 | 2,284 | 2,286 | 2,342 | 2,364 | 1.01 |
| 1938 | 1,848 | 2,316 | 2,267 | 2,062 | 2,361 | 1.15 |
| 1950 | 1,926 | 2,316 | 1,958 | 1,867 | 2,166 | 1.16 |
| 1960 | 1,919 | 2,081 | 1,913 | 1,795 | 2,318 | 1.29 |
| 1973 | 1,771 | 1,804 | 1,688 | 1,717 | 2,093 | 1.22 |
| 1987 | 1,543 | 1,620 | 1,557 | 1,608 | 2,020 | 1.26 |
It is interesting to note that between about 1930 and 1960, Japan largely resisted reductions in work.[6] Thus, the hours Japanese now work are shifted several decades compared to other industrialized countries. The Japanese work today some 400 hours per year longer than, for instance, Americans and approximately as long as in other industrial countries before mid-century.[7]
International comparisons of competitiveness often neglect the effect longer work time may have on Japanese economic performance. Surely the Japanese spending much more time at work profoundly affects production and consumption, savings, and firm organization. In terms of the dichotomy between production and consumption, the Japanese have chosen to stay in the workplace to support consumption abroad of automobiles, consumer electronics, and other goods. As seen below, a more complicated picture emerges when consideration is given not only to formal, contracted work, but also to other, primarily domestic types of labor activities. The fact that the Japanese work more does not necessarily imply that they enjoy less free time.
IV. Work Time versus Non-Work Time
Formal work is one aspect of social life. Obviously, if work time shrinks, the times of life that are not part of the formal work contract expand. During high unemployment in Western Europe in the early 1980s, experts in social research commented:
The formalized work contract has historically become the central issue in industrialized countries. It does not only regulate the standard of life, but is also the most important factor for social integration. The economic crisis and rapid technological change have created a shortage of jobs, and labor-market policies try to find new ways for redistribution (shortening of working time, more flexible working hours, job sharing). Nevertheless, formal work seems to lose its traditional unique and central place. One indicator for this are the growing discussions on the importance of other, ´informal’ sectors of work and service. When looking at work in such a general sense we are faced with the big problem of having to find a new equilibrium between the historically established sector of guaranteed employment and other (still) informal sectors. (Eurosocial, 1983).
Jahoda (1988) suggests to study those relatively enduring aspects of people and social institutions, which undergo only gradual, hardly perceptual changes, arguing that “employment as an institution whose time structure shapes the entire way of life of an industrial society has not changed; neither has the need of people for institutionally supported time experiences.”
Here we analyze quantitatively the eroding relative position of work time. Our hypothesis is simply that work time and alternative uses of time compete for the individual’s total time. To test the hypothesis, a standard of total life hours is necessary. Historical data on longevity (Flora et al., 1987) provide the standard for retrospective analysis. Demographic models are available to project future total life hours. Historical data (Figure 6) fit well to a logistic function, which projects life expectancy increasing by about 5% over the next few decades, to almost 80 years on average for men and women.
Comparing life hours of work to total disposable, active non-work hours yields the fractions of the lifetime time budget at work and other activities. Disposable hours are calculated by subtracting 10 years for childhood and first elementary education and also required physiological time. For the latter we have assumed (perhaps oversimplifying) 10 hours per day for sleep, eating, and personal hygiene for both genders. Between 1856 and 1981 disposable lifetime hours increased from 242 to 356 thousand hours in the United Kingdom, while, as we calculated above, the average working hours decreased from 124 to 69 thousand hours. Thus, non-work hours increased from about 118 to 287 thousand hours over a lifetime (Figure 7). While in 1856 50% of the disposable lifetime of workers was spent working, the portion has fallen to less than 20% today (Figure 8). Both reduced lifetime working hours and increased life expectancy caused the shift.
For men, this transition was crucial in both relative and absolute values. In 1856 about 150 thousand hours of a male’s lifetime were spent at the workplace and only some 91 thousand hours outside it (not considering physiological time). The former figure decreased to some 88 thousand hours, while the latter increased threefold to about 256 thousand non-work hours in 1981. In other words, from 1856 to 1981 the fraction of the disposable lifetime of a UK male spent working fell from three-fifths to one-fourth, with the crossover from a majority of work to non-work occurring around 1900.
Alternately, we can assess the ratio of non-work time to work time. In 1856 the ratio was around 0.6 for men, 2.9 for women, and 0.95 for the average working population. By 1981 the ratio of other to work time increased to 2.9 for men, 8.4 for women, and 4.2 for the average working population. All these measures dramatize how much consumption, or the non-productive sphere (to use a term formerly employed in socialist economies), dominates social activity in industrialized countries. The change is expressed throughout the economy, for example in the energy sector, where demand for personal transport and residential purposes exceeds industrial demand (Schipper et al., 1989).
V. Non-Work, Total Labor, and Free Time
What is the nature of the many hours of non-work? In youth activities center around education and recreation. Then, during the typical 40-year work career, one-third of the disposable time is spent at the work place and two-thirds are spent raising children, doing household work, and in leisure and holiday activities. After retirement, time is used for recreation, leisure activities, and, with aging, much expenditure goes for health maintenance.
We can further disaggregate the evolving lifetime time budget into hours spent in childhood and elementary education, higher education, work, non-work activities (i.e., other socially obligatory activities and free time) during the active working career years, and finally time after retirement. We always exclude required physiological time in the calculations. Again the changes in lifetime time budgets result from the combined evolution of two variables: changes in lifetime hours devoted to various activities (the numerator) and increasing life expectancy (the denominator). The latter explains the decreasing fraction childhood and elementary education account for in a male lifetime, from 17% to 13% (Figure 9). In the absence of data we have assumed childhood and elementary schooling to remain constant at 10 years. The decrease in fraction of time spent at work from over half of the total lifetime hours to less than one-fourth is another quantitative illustration of the transition from work to non-work discussed above. The increase in non-work activities allocates unevenly between different life stages. The smallest gains in non-work time are observed during the active working career. Non-work activities before (i.e., education beyond elementary schooling) and after (i.e., retirement) the work career have increased from zero to 20% of the disposable lifetime time budget of UK men.
The increase in the duration of higher education reflects the growing importance of pre-work preparation (see, e.g., Matthews et al., 1982:106). Following the Elementary Education Act of 1870, compulsory education of 8 years became mandatory in the UK. In 1972 compulsory education years were for the last time increased to a total of 11 years. Of course, the average value of 20% of a disposable male lifetime spent at education masks heterogeneity in the length of pre-work education from minimum compulsory schooling to doctoral degrees. After the turn of the next century as much as one-fourth of the lifetime of the average male worker may pass before starting on the job.
The component of the male non-work time budget which has risen the fastest is the time after the active working career: retirement. Whereas in the 1930s the average male life expectancy did not exceed the years spent at education plus the length of an average work career, the situation has changed drastically since. Retirement now accounts for about 13% of the average disposable male lifetime time budget in the UK. With increasing longevity of the population and further reductions in work time, the fraction of time in “life after work” (Young and Schuller, 1991) could increase to about one-fourth of the total work force life span during the next two to three decades.
If the trends should continue, after the year 2000 as much as half of the lifetime of the worker will be accounted for by pre- and after-work activities. Even in the remaining half of an individual’s lifetime, formal work will account for a decreasing fraction of time, 30% or less, and should leave more time for leisure and other activities such as caring for children and the home. Distribution of additional work-off times will be critical. Shortening of working hours may be useless unless synchronized with the rhythms of society.
To this point we have focused on contracted, compensated working time, treating other activities mainly as residuals. Now we define labor from a more inclusive perspective, encompassing all socially obligatory activities. These include, for example, raising and caring for children, household work, work (full-time and part time) and economically grey activities, whether these add numerical value to national income accounts or result in other forms of monetary or non-monetary compensation.[8] The data analyzed were assembled from Hungarian research on time budgets (Falussy and Boda, 1989).[9] Their span of 25 years is a shorter time than the data for the United Kingdom. They yield, nonetheless, insights into the division of time between total labor and free activities in several countries and between genders. Extension of the study of work time to socially obligatory activities also adds perspective on the gender gap, seen in the long analysis of formal contracted work in the United Kingdom. We have complemented and updated the data from the Hungarian source with information for Japan (Statistics Bureau, 1987), the United Kingdom (Gershuny, 1989), the United States and the former USSR (Gershuny, 1989, 1992; and Robinson et al., 1988).[10] Our main interest in the data is their evolution over time and less in comparing and discussing absolute differences between countries.
In the following we consider the ratio of free to total labor time, measured by the ratio of time devoted to the two activity categories and again excluding physiological time. A ratio of 0.5 means that one-half as much disposable time is devoted to free time (including leisure) as to total labor; a ratio of 1.0 means that free and total labor time are equal.
As societies become more affluent, free time steadily increases compared to the time devoted to all labor, as evident from Figures 10a and 10b,which show the trend in several countries of the ratio for the male and female population separately, plotted against per capita Gross Domestic Product (GDP). The male population in the city of Pskov (Russian USSR) is an exception, with a stagnant free time compared to total labor time between 1965 and 1986. Another anomalous movement in the ratio is in Poland, where decreasing per capita GDP nevertheless accompanies the increasing free time seen in more prosperous countries. One interpretation of this anomaly is that the economic depression in Poland is a brief phenomenon, while change in the time budget rides through the ups and downs of economic performance. Perhaps the movement towards more free time that accompanies economic development cannot be reversed without large social disruptions even in periods of economic crisis, especially when these periods are marked by labor surplus.
The gender gap in free to total labor time in Figure 10a compared to Figure 10b appears smaller in more affluent societies, despite differences that remain between countries and cultures. In all but two societies assessed, women spend more total time in labor than men and thus enjoy less free time. The exceptions are the United States and the United Kingdom. In these countries, when considering all socially obligatory activities, women appear to enjoy more free time than men, perhaps because men devote more time to household work and raising children than in the other countries examined. The gender gap in the ratio of free to total labor time is particularly large in Eastern Europe. In Bulgaria, the gap even widened, as only men enjoyed more free time with economic development.
Also noteworthy is Japan, where the ratio behaves like other industrialized countries, despite a longer average paid time at the work place. Thus, although Japanese on average spend much more time in regular, compensated work, they nevertheless enjoy an amount of free time similar to people in other countries with a comparable degree of economic development. A basic budgetary principle in time allocation may be observed here, that people working more in formal economic activities appear to adjust time spent for housework and child care rather than free time proper.
Overall, the upward diagonal movement in Figures 10a and 10b resembles our earlier observation of the evolution of lifetime budgets for work and non-work. As societies become more affluent, the population spends less time in regular, salaried work at the workplace, and more time in informal work, at home, and for leisure.
VI. Observations and Questions
Earlier we pointed out that workers in the United Kingdom and similar countries formally work about 40 years and live close to 80. Workers do not work about half their lifetime, and the fraction of non-work keeps increasing. Moreover, within working years, the hours of work are diminishing. With increasing affluence, the ratio of free to all socially obligatory time could approach 1, eventually to surpass it. On average, even the total working population (including part time workers) will then spend at least as much time for free activities as for all other labor taken together.
We conclude by exploring a few of the causes and consequences of the reductions in work time and related phenomena. With respect to causation, we focus on technology. With respect to consequences, we consider the rise of the service economy. Then we pose some final issues and questions.
We mentioned earlier the inexorable role of technology in raising productivity and thus at least creating the possibility of liberating work time. The relations between technology and time are not simple. The complexity of the relations are demonstrated by considering technology and women’s labor. A logical hypothesis is that inventions easing household labor, limiting family size, and improving child health enabled women to increase their participation in the work force.
Recall some inventions affecting women. When the tin can was introduced in the 19th century, seers predicted that the reduction in time needed for meal preparation would lead to more time spent outside the home. Electrical appliances were forecast to have a similar effect: the iron (1882), sewing machine (1889), stove (1896), clothes washing machine (1907), and domestic refrigerator (1918) (dates from Desmond, 1987). When America’s Mr. Birdseye successfully marketed frozen foods in 1929, the tin can statements from 50 years earlier were repeated.
In fact, in the United Kingdom and the United States (see Harris, 1981) women did not lengthen their working careers until about 1950, when many household inventions achieved widespread diffusion. Innovations increase variety and quality of diet, improve cleanliness, and allow an individual to care for a larger amount of space. However, such innovations, at least before they became pervasive and complementary of one another, little altered the domestic labor time (Strasser, 1982; Vanek, 1974). Comparison of time use in the United States in 1965 with earlier studies showed only minor changes occurring since the 1930s (Robinson and Converse, 1967). Minge-Kalman (1980), reviewing studies of several industrial societies, found that women’s daily work outside the home decreased while work inside the home increased for an overall net increase. In contrast, Gershuny and Robinson (1989) reported that between the 1960s and the 1980s women reduced the amount of time spent daily in housework.
Regardless of effects of domestic technologies, innovations such as the oral contraceptive (1951) and measles vaccine (1953) which have made it possible to have fewer and healthier children, along with attitudinal changes and associated social innovations such as day care centers, superficially match well with the onset of the dramatic increase in years women spend in paid work. But, female fertility has declined gradually in the industrialized nations for over a century, without any downward discontinuity following World War II. In fact, this period was marked by a brief baby boom. We conclude that technology serves the revealed social goal of reducing life hours of work primarily via productivity increases at the workplace. In other fields of endeavor technology increases productivity, so to speak, but often without altering time allocation.
In any case, working less and living longer implies new balances and structures of production and consumption and new areas of economic growth. Consumption now dominates production as a social activity. A typical life of 80 years may be spent about 40 years consuming and 40 both producing and consuming. When consumption dominates production, we are in the service economy. The service industries are transport, communications, entertainment, retail, banking, education, and health, and not manufacturing, mining, and agriculture.
When consumption is the main activity of a day or a life, most work in restaurants, hotels, schools, media, fitness centers, banks, and health care organizations. Service dominates employment and over the long run may especially favor medicine and recreation as well as information handling. In a society which lives longer and works less, people can worry more about youth and beauty and health.
Gershuny (1989) argued that leisure in the so-called leisure society makes the work and that the non-work activities enable the consumption of ever increasing outputs of products and services of affluent societies. It is uncertain to what extent the more individuals produce, the more time they need for consumption. We can spend money fast, purchasing costly items in a twinkling. An expensive one-week tour takes no more time than a cheap one-week camping. Nevertheless, if technology makes a society with more productive potential but insufficient time to consume more, then balancing the system requires more time for consumption as well as the money to pay for it.
Numerous policy issues emerge. A fundamental issue is whether society yet reflects in its employment, pension, and educational policies the dominance non-work and free time have obtained over work. Policy, for example, with respect to reform of welfare, still appears geared to the primacy of the formal work contract. Our knowledge of the time patterns of the non-working population, including the elderly, needs to be deepened.[11] The observed persistence in average work career length of around 40 years also raises policy issues, for example, about workplace change and performance. The jobs evolve, the work force turns over, working hours are reduced, but years of work and the length of social memory of the workplace remain roughly constant. This regularity may be valuable for employers and government to recognize in developing policies for education and re-training, especially in conditions of rapid technological change and corresponding changes in skill requirements. With further work time reduction within these 40 years, new organizational models of distributing work activities should be possible. For instance, like just-in-time inventory, a just-in-time labor force may be assembled (Kutscher, 1988). The 27-hour average work week may match well with lots of temporary workers.
Research questions also abound. Why does the system at the macro level exhibit stable behavior over more than a century despite discontinuities in underlying individual variables such as weekly working hours or female career lengths?[12] Why do we partition the additions to non-work between education, retirement, and other options as we do? Why have most countries adopted the same divisions between work and non-work at different stages of their industrialization? Will the historically observed rates of change continue? If not, what will slow or speed them?
The closing question must be how far reductions in work time will go. Our response is to look back. Recall that in hunter-gatherer tribes men worked only three hours each day.[13] Perhaps 10,000 years after the invention of farming humanity will come full-circle. If the earth’s environment can be preserved and our social structures improved, then in another 200 years or so we may return to the leisurely life of the Garden of Eden.
Acknowledgments
The authors thank Helga Nowotny for interesting us in this topic, Sir Bruce Williams for sharing data and pointing out critical issues, and Eli Ginzberg, Cesare Marchetti, Nebojsa Nakicenovic, Paul Waggoner, and Michael Young for helpful comments.
BIBLIOGRAPHY
Andorka, R.(1987) ‘Time Budgets and Their Uses’, Annual Review of Sociology 13:149-164.
Armstrong P.(1984) Technical Change and Reductions in Life Hours of Work. London: The Technical Change Centre.
Becker G.D.(1976) The Economic Approach to Human Behavior. Chicago: University of Chicago Press.
Blossfeld H.P, Hamerle, A. and Mayer K.U.(1989) Event History Analysis, Statistical Theory and Application to the Social Sciences. Hillsdale: Erlbaum, NJ.
Blyton P.(1985) Changes in Working Time: An International Review. London/Sydney: Croom Helm.
Desmond K.(1987) Harwin Chronology of Inventions, Innovations, Discoveries. London: Constable.
Douglas P.H.(1934) A Theory of Wages. New York: Macmillan.
Dumazedier J.(1989) ‘France: Leisure Sociology in the 1980s’, in: A. Olszewska and K. Roberts (eds) Leisure and Life-style. Sage Studies in International Sociology 38, London: Sage Publications Ltd.
Eurosocial (1983) ‘Can There Be a New Welfare State: Social Policy Options Towards Shaping an Uncertain Future’, Descriptive Note R 120/March 1983/1, Vienna: European Center for Social Welfare Training and Research.
Falussy B. and Boda G.(1989) ‘Changes in Total Worktime per Unit of Free Time as a Function of Economic Development’, Statistic Journal of the United Nations ECE 6:51-68.
Flora P., Kraus F. and Pfennig W. (1987) State, Economy, and Society in Western Europe 1815-1975 vol. II, Frankfurt: Campus Verlag.
Fourastié J. (1965) Les 40000 heures. Paris: Robert Laffont.
Gershuny J.I. (1989) ‘International Comparisons of Time Budget Surveys: Methods and Opportunities’, Paper prepared for International Workshop on the Changing Use of Time, Brussels, 17-18 April. Dublin, Ireland: European Foundation for the Improvement of Living and Working Conditions.
Gershuny J.I. (1992) ‘Are We Running out of Time?’, in: FuturesJanuary/February:3-22.
Gershuny J.I. and Robinson J. (1989) ‘Multinational Comparisons of Change in the Household Division of Labor’, Paper prepared for International Workshop on the Changing Use of Time, Brussels, 17-18 April. Dublin, Ireland European Foundation for the Improvement of Living and Working Conditions.
Ghez G.R. and Becker G.S. (1975) The Allocation of Time and Goods over the Life Cycle. New York: National Bureau of Economic Research.
Gross D.R. (1984) ‘Time Allocation: A Tool for the Study of Cultural Behavior’, in: Annual Review of Anthropology 13:519-558.
Hareven T.K. (1982) Family Time and Industrial Time: The Relationship Between the Family and Work in a New England Industrial Community New York: Cambridge University Press.
Harriman A. (1982) The Work/Leisure Trade-off: Reduced Work Time for Managers and Professionals New York: Prager.
Harris M. (1981) Why Nothing Works: The Anthropology of Daily Life New York: Simon & Schuster.
Harvey A.S. (1989) ‘The Use of Time of the Non-employed in Historical, Cross-national Perspective’, Paper prepared for International Workshop on the Changing Use of Time, Brussels, 17-18 April. Dublin: Ireland European Foundation for the Improvement of Living and Working Conditions.
Harvey A.S., Szalai A., Elliott D.H., Stone P.J. and Clark S.M. (1984) Time Budget Research, An ISSC Workbook in Comparative Analysis. Frankfurt: Campus Verlag.
Hurd M.D. (1990) ‘Research on the Elderly: Economic Status, Retirement, and Consumption and Saving’, Journal of Economic Literature XXVII, June:565-637.
Imhoff A.E. (1981) Die gewonnen Jahre: Von der Zunahme unserer Lebensspanne seit drei hundert Jahren oder von der Notwendigkeit einer neuen Einstellung zu Leben und Sterben. München: C.H. Beck.
Jahoda M. (1988) ‘Time: A Social Psychological Perspective’, in: M. Young and T. Schuller (eds) The Rhythms of Society. London/New York: Routledge.
Jones E.B. (1963) ‘New Estimates of Hours of Work per Week and Hourly Earnings, 1900-1957’, in: Review of Economics and Statistics, XLV(4):374-385.
Juster F.T. and Stafford F.P. (1991) ‘The Allocation of Time: Empirical Findings, Behavioral Models, and Problems of Measurement’, in: Journal of Economic Literature, XXIX(6):471-522.
Krelle W. (ed), (1989) The Future of the World Economy: Economic Growth and Structure Change. Berlin: Springer.
Kutscher R. (1988) ‘Growth of Service Employment in the United States’, in: B.R. Guile and J.B. Quinn (eds)Technology in Services: Policies for Growth, Trade, and Employment. Washington, DC: National Academy.
Leontieff W. (1978) ‘Worksharing, Unemployment, and Economic Growth’ in: National Commission for Manpower Policy, Work Time and Employment: A Conference Report, Special Report No. 28, #052-003-00686-3, pp. 129-135, Washington DC: U.S. Government Printing Office.
Maddison A. (1991) Dynamic Forces in Capitalist Development: A Long-run Comparative View. Oxford: Oxford University Press.
Marchand O. (1992) ‘Une comparaison internationale de temps de travail’, in: Futuribles 165-166(5-6):29-39.
Marchetti C. (1979) On Energy and Agriculture: From Hunting-Gathering to Landless Farming. RR-79-10, Laxenburg, Austria: International Institute for Applied Systems Analysis.
Matthews R.C.O., Feinstein C.H. and Odling-Smee C.J. (1982) British Economic Growth 1856-1973. Oxford: Clarendon Press.
Mayer K.U. (Ed) (1990) Event History Analysis in Life Course Research. Madison: Univ. of Wisconsin Press.
Minge-Kalman W. (1980) ‘Does Labor Time Decrease With Industrialization: A Survey of Time Allocation Studies’ in: Current Anthropology 21:279-287.
National Commission for Manpower Policy, (1978) Work Time and Employment: A Conference Report. Special Report No. 28, #052-003-00686-3, Washington, DC: U.S. Government Printing Office.
New York Times, (1988) ‘It’s Official! Vacations Really Aren’t Un-Japanese’, Section 1, page 4, column 1, 6 August.
New York Times, (1988) ‘Relaxing Takes Some Work as Weekends Come to Japan’, Section 1, page 1, column 5, 31 December.
Nowotny H. (1989) Eigenzeit: Entstehung und Strukturierung eines Zeitgefühls. Frankfurt: Suhrkamp.
Owen J.D. (1978) ‘Hours of Work in the Long Run: Trends, Explanations, Scenarios, and Implications’, in: National Commission for Manpower Policy, Work Time and Employment: A Conference Report. Special Report No. 28, #052-003-00686-3, 331-64, Washington, DC: U.S. Government Printing Office.
Owen J.D. (1979) Working Hours: An Economic Analysis. Lexington: DC Heath.
Robinson J.P., Andreyenkov V.G. and Patrushev V.D. (1988) The Rhythm of Everyday Life: How Soviet and American Citizens Use Time. Boulder: Westview Press.
Robinson J.P., and Converse P.E. (1967) 66 Basic Tables of Time Budget Research Data for the U.S.. University of Michigan, Ann Arbor: Survey Research Center.
Sahlins M.D. (1974) Stone Age Economics. Chicago: Aldine-Atherton.
Schipper L., Bartlett S., Hawk D. and Vine E. (1989) ‘Linking Life-styles and Energy Use: A Matter of Time?’ Annual Review of Energy XIV:273-320.
Sharp C. (1981) The Economics of Time. Oxford: Martin Robertson.
Schor J. (1991) The Overworked American. New York: Basic.
Statistics Bureau, Management and Coordination Agency (1987) Japan Statistical Yearbook. Tokyo.
Strasser S. (1982) Never Done: A History of American Housework. New York: Panthion.
Szalai A., Converse P.E., Feldheim P., Scheuch E.K. and Stone P.J. (1972) The Use of Time: Daily Activities of Urban and Suburban Populations in Twelve Countries. The Hague/Paris: Mouton.
Thompson E.P. (1967) ‘Time, Work-discipline, and Industrial Capitalism’, in: Past and Present 38:56-97.
Vanek J. (1974) ‘Time Spent in Housework’, in: Scientific American November:116-120.
Wilensky H. (1961) ‘The Uneven Distribution of Leisure: The Impact of Economic Growth on Free Time’, in: Social Problems 9:32-36.
Williams B. (1983) ‘Technical Change and Life Hours of Work’, in: 14th April 1983 Sesquicentennial Conference of the Manchester Statistical Society Proceedings, pp. 90-106 United Kingdom.
Young M. (1988) The Metronomic Society: Natural Rhythms and Human Timetables. London: Thames and Hudson.
Young M. and Schuller T. (1991) Life After Work. Glasgow: Harper Collins.
FIGURES
Click on the button to view the figure.
Click here for all the figures on one page. (Then you can print all of the figures at once.) This page is large, about 600K in size.
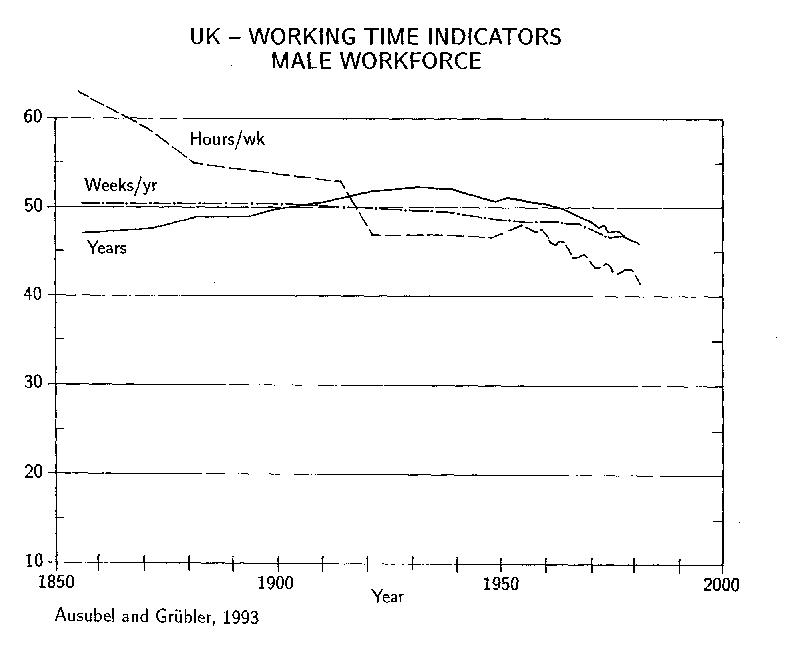
Figure 1. Working Time Indicators (hours/week, weeks/year, years at work) for Male Working Population in the UK, 1856-1981. Data Source: Armstrong (1984), Matthews et al. (1982), Williams (1983).
Figure 2. Working Time Indicators (hours/week, weeks/year, years at work) for Female Working Population in the UK, 1856-1981. Data Source: Armstrong (1984), Matthews et al. (1982), Williams (1983).
Figure 3.Years at Work of Female, Male and Average Working Population in the UK 1856-1981. Data Source: Armstrong (1984), male data corrected for average life expectancy.
Figure 4. Lifetime Hours at Work of Female, Male and Average Working Population in the UK 1856-1981.
Figure 5. Average Annual Hours Worked in Selected Countries 1870-1987. Data Source: Table 2.
Figure 6. Life Expectancy at Age 10, UK 1870-1980, in 1000 Hours and Years. Data Source: Flora et al. (1987).
Figure 7. Disposable Lifetime Hours (Excluding Physiological Time and 10 Years for Childhood and Elementary Education) for Work and Non-work for Average Working Population, UK 1856-1981, in 1000 hours.
Figure 8. Fraction of Disposable Lifetime Spent at Work and Non-work of Female, Male and Average Working Population, UK 1856-1981.
Figure 9. Allocation of Lifetime to Different Activities for Male Working Population in the UK 1856-1981, in Fraction of Disposable Lifetime (excluding physiological time).
Figure 10a. Free Time to Total Labor Time Ratios Versus per Capita GDP for Male Population of Selected Countries, 1961-1986.
Figure 10b. Free Time to Total Labor Time Ratios Versus per Capita GDP for Female Population of Selected Countries, 1961-1986.
TABLES
Table 1. Changes in Lifetime Hours at Work UK 1856-1981 (in hours).
Table 2. International Comparison of Hours Worked (effectively)5 per Person per Year (Source of Data: Maddison, 1991).
ENDNOTES
[1.] Wilensky (1961) provides estimates of work time in eras ranging from the Roman to the 20th century, but no continuous and comparable data series. Imhoff (1981) presents a scattering of interesting facts about changes in time budgets over the past 300 years. See also Schor, 1991, p. 45.
[2.] Only by 1930 was the male life expectancy at age 10 long enough to allow the average male in the United Kingdom to live until the end of a typical working career of some 52 years prevailing at that time. Age 10 may sound today like an early starting point for the analysis in this paper. However, child labor was normal in the 19th century. In the United Kingdom Ashley’s Act excluded girls and boys under age 10 from the mines only in 1842. Fielden’s Act of 1847 established a “normal” working day of 10.5 hours for young people (and women) in factories.
[3.] If schooling lasts 10-15 years and a work career 40 years, then the lifetime of the human capital stock (its formation, integration, and use in the production sphere of the economy) is about 50-55 years. This clock sets the speed of social learning. The ultimate limits to the speed of diffusion of innovations are human minds. Individuals and groups early on often become locked into particular procedures and technical know-how and unable to accept new ideas or practices. Replacing entirely a workplace organization or any other human system that is no longer satisfactory can require some 50 years, if the system is fixed in the minds of the current managerial and labor force and is taught to the young.
[4.] Fourastié (1965) proposed that early in the 21st century the working career would already be reduced to 40,000 hours. According to our analysis, Fourastié’s forecast was several decades early.
[5.] Data source: Maddison (1991). Data refer to annual hours worked effectively (i.e. contractual working time plus overtime minus holidays and sick leave). Other definitions are also used frequently in international working time comparisons, e.g. contractual working time (excluding overtime and sick leave) or actual working hours (derived from detailed time budget surveys, including e.g. also “informal” overtime). Definitions and data sources are discussed in detail in Maddison, 1991:255-258. Methodological issues (and resulting uncertainties) in international comparisons are also discussed in Marchand, 1992:33-38.
[6.] Although relatively early retirement is customary for employees of some large Japanese corporations, we have not been able to find evidence that length of careers on average in Japan differs significantly from that in other countries examined, so the use of annual hours should be representative.
[7.] For accounts of Japanese attitudes toward work time, see the New York Times, 6 August and 31 December 1988.
[8.] Minge-Kalman (1980) uses the terms “productive” and “reproductive” (or domestic) labor to span total labor time.
[9.] For reviews of literature on time budget surveys and analyses, see Andorka (1987), Harvey et al. (1984), and Juster and Stafford (1991).
[10.] The data on the then Soviet city of Pskov may not be precisely comparable to national average data in other countries and are affected also by the problems of estimating comparable USSR Gross Domestic Product (GDP) figures as indicators of economic development (see Krelle, 1988, on this point, from where we derive the GDP estimates for the USSR).
[11.] On the use of time of the non-employed see Harvey (1989); for economic research on the elderly see Hurd (1990); for a sociological perspective see Young and Schuller (1991).
[12.] Young (1988) has sought deep mechanisms in the temporal behavior of human society.
[13.] Studies among many foraging groups give comparable results; see Sahlins (1974) and Gross (1984:526).