How many plant species are there? Facing success, some taxonomists falter

In Nature 13 april 2006Gardens in full bloom” by Emma Marris highlights the increasing importance of botanical gardens as centers of molecular research. One scientific goal is to compile a working list of known plant species. According to Nature, “plans for the ultimate database inevitably lead to talk of DNA barcoding. If species-specific differences in defined DNA sequences were matched with a species name in some kind of database, an untrained person could use a sequence or a DNA-chip to read the barcode in a botanical sample, send it to the database, and get back a name and all other necessary taxonomic data….Apart from its undoubted geeky appeal, such a technology would in principle save a lot of time and drudgery. Carrying out identifications for colleagues at home and round the world is time consuming and uncompensated. The use of barcoding would free up people to do their own research.”

But Peter Raven, Missouri Botanical garden, is cautious about such a scheme. He worries about how much time and effort it would take and asks “what would one do with barcodes for the 13,000 or so moss species?”

Raven’s question is like a cosmologist asking “why map the distribution of galaxies?” There is likely no way to understand the origins and patterning of biodiversity other than counting species and mapping their distributions. A rapid, simple method for identifying specimens such as DNA barcoding can make this possible. Studying a species-rich group of early terrestrial colonizers such as mosses, which live in some of the coldest and dryest environments as well as in the tropics, and provide habitats for a variety of invertebrates, might be a good place to start.

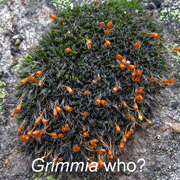
https://bryophytes.plant.siu.edu/grimmia.htmlDNA analysis can also help identify new moss species. In “Cryptic species within the cosmopolitan desiccation-tolerant moss Grimmia laevigata“, Fernandez et al describe 2 cryptic species with overlapping geographic distributions. Their samples were collected only in California, so a world survey might reveal many more hidden species. The authors conclude “the results emphasize the need to make molecular characterization of species a standard part of ecological analyses of populations and communities”.

Selective sweeps limit mitochondrial diversity in animals

An exciting paper in Science 28 April 2006 “Population size does not influence mitochondrial genetic diversity in animals” by Eric Bazin, Sylvain Glemin, and Nicolas Galtier from Universite Montpellier, France, calls into question current thinking in population genetics. The authors looked at intraspecific variation in nuclear and mitochondrial DNA using sequence data collected from public databases into Polymorphix database. Contrary to expectations from population genetic theory, there was “no correlation between mtDNA polymorphism and species abundance”. Analysis of non-synonymous (amino acid changing) and synonymous (silent) changes indicated that reduced mitochondrial diversity within species reflects positive selection. They conclude “mtDNA appears to be anything but a neutral marker and probably undergoes frequent adaptive evolution… mtDNA diversity will in many instances, reflect the time since the last event of selective sweep, rather than population history and demography.” Taken together, these findings help explain the general observation of constrained intraspecific mitochondrial variation in animals, even in organisms with enormous population sizes. Recurrent selective sweeps are natural tests of species boundaries and help explain why mtDNA genealogies generally capture the biological discontinuities recognized by taxonomists as species (Avise and Walker PNAS 96:992, 1999), in short, why DNA barcoding works! It is expected that large data sets generated by DNA barcoding surveys will help refine this analysis and identify possible ecological or biological correlates, providing insight into what drives selective sweeps. I close with a question: if a species is morphologically and ecologically stable, does it nonetheless undergo repeated selective sweeps?

https://www.fishesnpets.net/explore/explore/ChangiBeach05012002/changipoint31.jpg

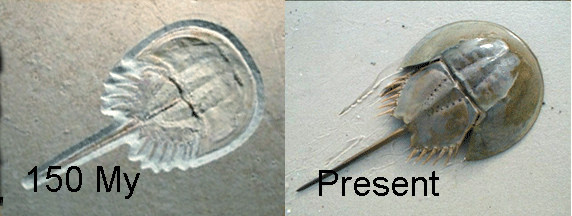
150 My of selective sweeps?

Barcoding aids biodiversity science, new examples; some taxonomists worry, part 2

DNA barcoding helps conserve biodiversity. In Ten Reasons for Barcoding Life we outlined benefits to biodiversity from barcoding. An earlier post highlighted one reason, namely how barcoding assists conservation by helping uncover cryptic species. I highlight two more with new examples, and discuss a recent worry piece on barcoding from Conservation Science.  From Ten Reasons:

1. Identifying a species from bits and pieces. Conserving the many threatened fish species requires the ability to identify commercial and sport fishery harvests. The United States Food and Drug Administration online Regulatory Fish Encyclopedia was developed to help federal, state, and local officials and purchasers of seafood accurately identify species substitution and economic deception in the marketplace. The page for the Caribbean species Red Snapper Lutjanus campechanus includes high-resolution pictures of filets. However, it is not possible to accurately identify fish fillets and substitution appears common. Using mitochondrial DNA (cytochrome c rather than cytochrome oxidase I), Marko et al found that 77% of Red Snapper filets sold in eastern USA consumer markets were mislabelled. More than half of the analysed sequences grouped closely with species from other regions of the world. A reference library of DNA barcodes will help regulatory agencies enforce fish quotas and may enable new forms of certification that will be of great interest to the many concerned consumers of regulated products.  
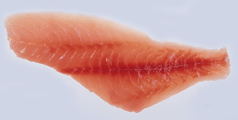
What fish is this?
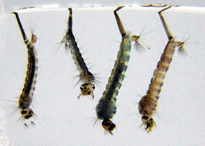
 

https://fmel.ifas.ufl.edu/Key/index.htm

2. Makes expertise go further.  Mosquito control programs depend on accurate species identification, a task requiring great expertise, particuarly for larval forms, which can provide early warning before adults hatch and can be treated with local measures. Once a reference library of DNA barcodes is established, DNA-based identification can be applied by many more personnel to more effectively target control measures and limit injury to non-harmful species.

To spray or not to spray?

Worried taxonomists (part 2). In April 2006 Conservation Biology, Daniel Rubinoff’s mildly-titled essay “The utility of mitochondrial DNA barcodes in species conservation” focuses on the potential consequences of relying on DNA barcodes IF they were to be used as the sole criterion for species discovery. Before commenting on this issue, I point out the essay leaves out the multiple practical benefits to biodiversity science which arise from allowing many more people to identify the species around them. As things stand at present, outside of a few well-known groups such as birds and butterflies, taxonomic identification of recognized species is the province of a few experts. Even an expert can identify only a small part of the plant and animal kingdoms, and often cannot identify all stages of life because they lack morphologic characters. A reference library of DNA barcodes will assist experts as well as users. The Rubinoff essay raises interesting and important issues, but they are NOT arguments against the aims of DNA barcoding as envisioned by most practitioners. As outlined on the Consortium for the Barcode of Life (CBOL) website, DNA barcoding is being developed as a tool for taxonomic science, not a replacement for it. The Rubinoff essay does allow that “for groups that are already relatively well known, especially birds and mammals, molecular studies based on barcode-sized sequences have revealed cryptic DNA lineages and may be helpful”. However, the essay states that “the use of DNA to survey already studied groups or test hypotheses…is not truly barcoding”. Rubinoff provides his own definition: “true barcoding consists of broad, essentially blind and random surveys of communities with little or no background information,” which certainly sounds like a scary idea! If analyzing known groups is not barcoding, this will be news to CBOL, as the current initatives include include All Fishes, All Birds, known commercially-important species of Canada, known pests and invasive species, moths of North America, and sphinx and saturnid moths of the world (see CBOL website). (For an idea of the range of activities sparked by the CBOL intiative, see the published symposium from the First International Conference on Barcoding Life held at the Natural History Museum, London, 7-9 February 2005.) It is likely that these large scale surveys of known groups will uncover cryptic lineages, as Rubinoff describes, but they are far from “essentially blind and random surveys of groups with little or no background information”.

It is from large-scale analyses of recognized species in well-studied groups that we will be able to develop confidence in and understand the limitations to barcoding as a tool for species identification and discovery. That said, it is an unremarkable observation that high levels of mitochondrial divergence often signal new species. Ultimately it may be possible to apply confidence thresholds to various levels of mitochondrial sequence divergence, as Chris Meyer and Gustav Paulay’s work on cowries suggests, but this will require much more data gathering. The issue of what are the best quantatitives measures of biodiversity is contentious, and DNA sequences are certain to only be a part of that.

For the next critical essay on DNA barcoding, I offer the writer(s) the following observations:

1. DNA barcoding is a taxonomic tool for a) assigning specimens to known species and b) speeding discovery of new species. More work is needed to determine the best use of DNA barcodes in species discovery (for example, distance vs. character-based methods).

2. Barcode sequences may be of interest to those studying deep phylogeny, but barcoding does not aim to analyze evolutionary groupings above the species level.

3. In some cases a COI barcode narrows identification to a few closely-related species, but no further.

4. Divergent sequence clusters lacking biological co-variants (eg morphologic characters) signal a need for further taxonomic study.

I close with an inspiring quote from an in press Royal Proceedings article by Paul Barber and Sarah Boyce applying DNA barcoding to analyze diversity in stomatopod larvae. They call for an “iterative process of DNA barcoding…followed by taxonomic study…Such a synergy between molecular geneticists and taxonomists will greatly advance our understanding, description and cataloguing of our planet’s biodiversity, moving us closer to the goal of documenting the entirety of the world’s biodiversity in both marine and terresterial environments. However, this synergy will only be possible if funding is directed both towards barcoding efforts as well as traditional morphological-based taxonomy that successful barcoding efforts will require.”  
Some Fret Over Exceptions to Barcoding

The springboard for a recent news@nature.com item by Hannah Hickey “Butterflies poke holes in DNA barcodes” is a report by Gompert et al in press in Mol. Ecology on genetic differences between two subspecies of Melissa blue butterfly, Lycaeides melissa melissa and L. m. samuelis. The latter subspecies is commonly known as “Karner blue” and is listed under the USA Endangered Species Act. Analysis of mitochondrial DNA revealed some populations of Karner blue have distinct COI sequences but those populations adjacent to the range of L. m. melissa subspecies do not. This result is not surprising. For one, DNA barcoding does not aim to separate subspecies. Subspecies are geographic variants within species whose differences shade into one another so it would be surprising if any single gene showed a sharp demarcation between populations. Most subspecies do not show diagnostic genetic differences, and when such differences are found, it has often led to proposals to elevate them to species status.

Regarding the utility of DNA barcoding, the findings with Melissa blues are unremarkable, as there are cases in all animal groups studied so far in which barcoding narrows identification to a few closely-related species, but no further. For example, see my earlier entry on comparing barcode performance. It may be helpful to point out that DNA barcoding is an instrument, not a theory. Cases of partial resolution do not “disprove” barcoding or invalidate its use. In fact, one application of DNA barcoding will be to quickly highlight such cases which may be biologically interesting as they likely represent recent speciation, ongoing hybridization, or synonymy.

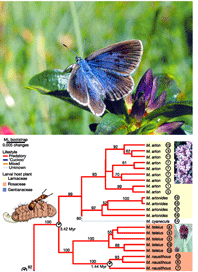
A more relevant Nature article that Ms. Hickey might have cited is Als et al study of Maculinea large blues, a related group morphologically similar, taxonomically confusing, and highly endangered butterflies. Large blues have “extraordinary parasitic lifestyles…later instars live in ant nests where they either devour the brood (predators), or are fed mouth-to-mouth by adult ants (cuckoos)”. Genetic analysis using mitochondrial and nuclear DNA uncovered numerous cryptic species with unsuspected host specificity, thereby both multiplying the challenge and providing the key to conservation, the need to conserve both ant hosts and butterflies.

As highlighted by the large blue study, the larger and more exciting challenge for biodiversity science will be how to incorporate the enormous number of genetically and biologically distinct forms whose discovery is facilitated by large-scale barcoding.

Photo of Rebel’s large blue Maculinea rebeli and phylogeny showing cryptic species among predatory Maculinea from Nature article by Als et al.

DNA barcoding helps resolve tropical biodiversity

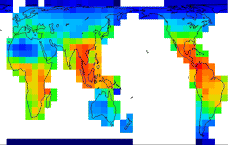
Tropical fauna challenge taxonomy because species richness is greater in the tropical than in temperate zones, most tropical species are as yet undescribed, and within-species genetic variation appears to be greater.

World Terrestrial Biodiversity https://www.nhm.ac.uk/research-curation/projects/worldmap/
Land Animal and Plant Biodiversity World Map

Two recent papers show DNA barcoding aids species identification and discovery in tropical fauna. In January 24, 2006 Proceedings of the National Academy of Sciences USA, Hajibabaei et al examine 4260 specimens representing 521 (71%) of hesperiids (skipper butterflies), sphingids (sphinx moths), and saturniid moths of the of the ACG conservation area in Costa Rica. 510 (98%) of recognized species have distinct barcodes, 11 (2%) have barcodes that overlap with another closely-related species, and 13 recognized species have 2 or more distinct barcode clusters. Associated co-variation in habitat, food plant, and adult and caterpillar morphology indicate these clusters represent cryptic species, a total of 27 new species whose discovery was facilitated by barcoding.

In a similar vein, DNA barcoding revealed cryptic species with unsuspected host-specificity in a genus of presumed generalist tropical parasitoid tachinid flies. Insect parasitoids are a major cause of natural insect mortality and are used as biological control agents. They are thought to represent 8%-25% of all insect species, but understanding species richness and biology is hampered by the very large number of morphologically similar species. A published commentary by Herre emphasizes “…the value of DNA barcoding in uncovering hidden diversity…especially when coupled with traditional taxonomy and a keen appreciation of the fascinating details of basic natural history.”

Comparing barcoding performance

Suggested metric, terminology, and standard graphic

How well do barcodes distinguish among species? A standardized, simple quantitative method and terminology for comparing barcoding performance among different data sets will be helpful.

In trying to answer this question, I aim to promote terminology that does not include “error”. In my view, it generally does not make sense to talk about the error rate of barcoding. Barcoding is an instrument akin to a telescope, except that it is designed to resolve species, not stars. A telescope that does not resolve a double star is not wrong, it simply lacks sufficient resolution. Also, the term error rate implies there is an accurate reference standard in species identification. As systematists emphasize, species definitions are hypotheses and frequently undergo revision. Thus in this view barcoding performance, effectiveness, and resolution are useful descriptive terms and are more informative than barcoding error rate.

What we want is an approach that quantitatively compares barcoding with current taxonomy. In the future, taxonomy may incorporate some of the groups discovered through barcoding as recognized species, perhaps will combine some of the recognized species with overlapping barcodes into single species, and additional sequence data may enable resolution of species with overlapping barcodes. To start, a 2 x 2 table comparing recognized species to distinct barcode groups:

Barcode groups and species

Suggested terminology:

Barcode group (or cluster): the shallowest branch in a neighbor-joining tree that corresponds to one or more recognized species or potential split within a recognized species.

Distinct barcodes: a barcode group that corresponds to a recognized species or a potential split within a recognized species. This definition can incorporate whatever criteria are used for recognizing splits (such as criteria that have been used to define provisional species, ESUs).

Barcode resolution: #barcode groups/total #species, in which total #species includes recognized species plus provisional species/ESUs.

This definition of barcode resolution incorporates “partially-resolved” species, so that if, for example, 8 species are resolved into 4 barcode groups, then resolution for that set would be 4/8 = 50%. Alternatively, if idea of partial resolution is not helpful, resolution could be defined more simply as a + b (green + yellow)/total #species.

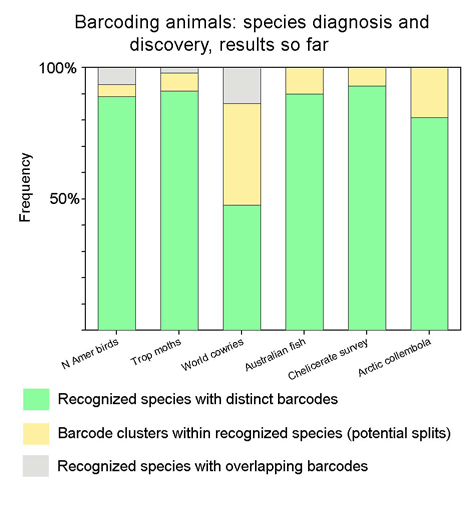
Suggested graphic: Applying this to recent barcode data sets:

Suggested standard graphic comparing barcode performance

Suggested color scheme: As in table, green (=good!) matches current taxonomy; yellow represents novel species/provisional species/ESUs (yellow like an early bud that lacks chlorophyll), and gray (as in a gray indeterminate zone) represents recognized species with overlapping barcodes. By definition, all potential splits/ESUs have distinct barcodes, so d) in the 2 x 2 table is blank. As barcode findings are incorporated into taxonomy, I expect that the proportion that is green will increase—the greening of barcoding and taxonomy!

Mark Stoeckle