Feminism involves the entry of women into occupations from which they were excluded. A report on the imprisonment of women in the US provides data on convicted women that presumably reflect a rise in women pursuing criminal careers. Plotted by our colleague Cesare Marchetti, the data fit a logistic curve beautifully and thus suggest the coherence of the feminist movement as a whole and its likeness to thousands of other biological and social growth processes. The midpoint of the growth, which quadrupled women convicts, was 1992. Have women hit a ceiling in their penetration of criminal occupations or will another pulse follow? For more information on logistic growth processes, see Loglet Lab.
News
Visualizing large data sets
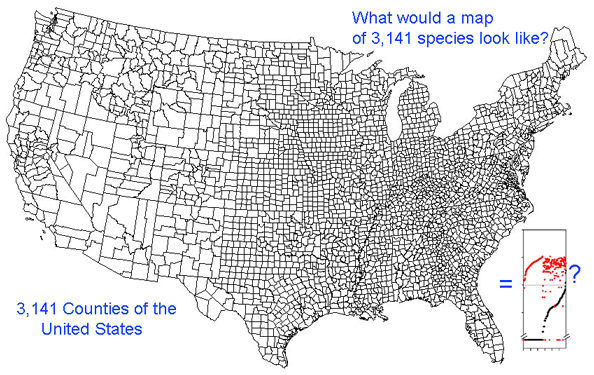
Growing barcode libraries challenge understanding. There are already about 200,000 mtCOI barcodes from about 25,000 species in BOLD, the Barcode of Life Data Systems Database. The burgeoning data sets hint at insights into biological diversity, revealed by looking at many species at once. A map of counties of the United States shows both large and small scale patterns, shaped by history, geography, and politics. Viewed through the lens of mitochondrial variation, what would a map of species show? Are differences among and within species similar in birds and butterflies? Do species boundaries differ in marine vs terrestrial species, or in tropical vs. temperate zones?
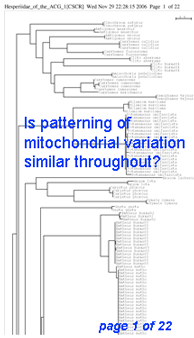 Here I offer one possible way of visualizing differences in barcode data sets using as an example the BOLD “Hesperiidae of the ACG 1” Project containing 2,185 COI sequences from 355 species of skipper butterfly in ACG conservation area in Costa Rica (Hajibabei et al Proc Natl Acad Sci USA 2006 103:968). The BOLD-generated neighbor-joining tree of ACG Hesperiid COI sequences shown at left offers a traditional way of comparing sequences and is an essential step in looking at individual species and their close genetic neighbors. However the NJ tree contains only about 100 sequences from 20 species per page, and so runs to 22 pages. In the future it will likely be desirable to compare much larger data sets from, say, all 3700 known species of world skipper butterflies.
For DNA barcoding, the essential information is differences among and within species. The higher-level groupings of species which are inevitably generated by a tree are of less interest. (In the following analysis distances are used simply to examine patterns of variation, NOT to determine whether they are sufficient for diagnosing species.)
One useful approach is to generate histograms of differences within and between species. BOLD has a “Nearest Neighbor” analytic function which generates a table of mean and maximum variation within each species, “nearest neighbor” distance to the next closest species, and histogram summaries of the results.
 The histograms quickly show distances within most species are small and minimum distances between species are generally larger. Histograms are summaries with unlimited capacity. However, one might want to know more about individual species. For example, do species with higher intraspecific distances also show greater interspecific distances? One also wonders about the variation below 1% in both panels. In Beautiful Evidence, Edward Tufte points out histograms display relatively small amounts of data, usually 1 value per column. How to generate something with more information, more like the US Counties map, but not 22 pages long?
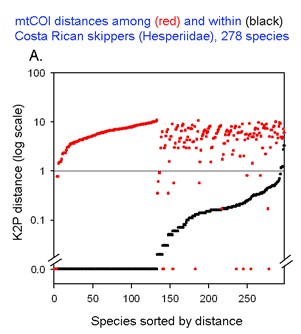
The graph at left uses the same 2 essential parameters: distance within each species and distance to nearest genetic neighbor. Because the usual distances within and between species are very different, plotting on a logarithmic scale allows one to inspect the variation in each set simultaneously. The results with 278 of the ACG skipper species (all those for which more than one individual was sampled, thereby generating a mean intraspecific distance) are shown. For each species, there is a black dot showing intraspecific distance and a red dot directly above or below showing distance to nearest neighbor. Sorting by intra- and interspecific distance allows the relative distances for each species to be seen. This graph highlights the relatively few species with nearest neighbor distances less than the mean intraspecific distance for that species. A line drawn at 1% appears to separate most of the intraspecific from interspecific values.
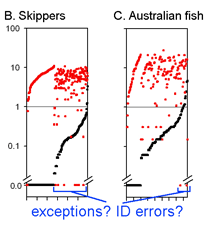 This graph is remarkably compressible, as shown by the small inset in the US county map above and in the figure at right. Here this is used to compare variation in Costa Rican skippers (278 species in 1 Family) to that in Australian fish (172 species in 1 Class) (Ward et al 2006 Phil Trans Royal Soc B 360:1471). The distribution of intraspecific variation seems quite similar while the nearest neighbor distances in fish are higher, presumably reflecting less dense sampling of a larger taxon. In the Fish paper, the red dots at bottom were thought to be ID errors, so perhaps some of the those in the skipper data set showing zero distance between species are taxonomic errors as well. This graphic approach could be useful in comparing patterning of intra- and inter-specific variation in marine vs terrestrial, tropical vs temperate, and allopatric vs sympatric species.
The spider and the fly: learning about applying COI to species identification
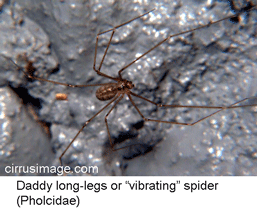 Two recent articles suggest how and how not to learn about applying mtCOI sequences to identifying species. In Zoologica Scripta 2006 35:441 researchers from Koenig Zoological Research Museum, Bonn, analyze 113 specimens of 61 morphologically-defined species of pholcid (daddy long-legs) spiders. Important for this analysis and for future study, collection locations are given and voucher numbers are provided for each specimen and DNA extract.
(Some pholcid spiders vibrate in their webs when disturbed, moving so rapidly they become invisible; here is a wonderful video)
16s and COI sequences were successfully amplified using a single primer pair for each gene from 79% and 80% of specimens, respectively. It is striking that strong clustering within species was observed despite using short segments of mtDNA (COI, 312 bp; 16s 287 bp), which are less than half as long as the standard 648 bp COI barcode. In NJ trees with either mtDNA sequence, all morphologic conspecifics grouped together and were reciprocally monophyletic (ie no overlaps between species). Likely splits based on large intraspecific distances and differing geographic distributions were observed in 6 (25%) of 24 multiply-sampled morphospecies.
The authors go on to propose graphic and statistical metrics to calibrate how well simple distances can define species limits. They find that mtDNA distances will often diagnose species: “tree-based taxon clustering and statistical taxon analysis indicate that molecular evidence does coincide with morphological hypotheses” and “we disagree with [Meyer and Paulay’s] point that independently of the group of organisms studied, a “barcoding gap” between interspecific and intraspecific distance values would likely disappear in studies featuring both dense within-species sampling and closely related species”, ie distance-based clustering often corresponds to species limits.
This study uses vouchered specimens from known locations and accurate modern sequencing technology, focuses on a relatively small clade (959 known species pholcid spiders), and analyzes in a positive way how distance measures might be used to define species, helping us learn about DNA barcoding as a tool for species identification.
In another recent study Syst Biol 55:715 2006 researchers from National University of Singapore examine COI sequences deposited in GenBank from Diptera (flies, mosquitos, and gnats). They found 449 of the 150,000 known species of dipterans represented, with multiple sequences from 127 species, and analyze these to “test two key claims of molecular taxonomy”. The scientists found that there were often large differences in COI within species and also frequent overlaps between species such that some sequences were more closely related to those of another species than to conspecifics. The litany of failures is quite long, including “even when two COI sequences are identical, there is a 6% chance they belong to different species”.
I do not understand why the authors put so much effort into analyzing such a heterogeneous set of data, except that they are worried about molecular taxonomy in general and DNA barcoding in particular. To my reading this study suggests that many GenBank records contain errors, either because current morphologic taxonomy is incorrect (for example, study cited above suggests probable splits in 25% of pholcid spiders), specimens used for GenBank records are incorrectly identified, or because DNA sequences in GenBank contain errors due to human factors or older sequencing technology. There must be some limitations to COI barcode identification of dipteran species, mostly presumably closely-related young species, but this study has not shown where such problems might lie.
I hope that future studies will use more of the “best practices” demonstrated in Astrin et al’s study of pholcid spiders and so help us learn more about how to apply COI sequences to species identification.
Alexander (Sandy) Mather
We note with great sadness the passing of Alexander (Sandy) Mather on Tuesday, November 14, 2006, aged 63 years, Professor, Department of Geography and Environment, University of Aberdeen. Sandy passed away one day after the publication in PNAS of our joint paper on “Returning forests analyzed with the forest identity.†Our article in PNAS is a memorial to Sandy’s work. We first learned of Sandy while writing our papers about encroachment of farming on forests. His concept of the Forest Transition inspired us. Whenever anyone writes forest transition, they remember Sandy, pictured here leading a group in the Costa Rican forest. His passing coincides with the high-profile validation of his work over many years.
Forests Podcast
Ira Flatow interviewed Jesse for a live radio segment (mp3) on NPR Science Friday 17 November 2006 about the PNAS paper by Kauppi et al. on Returning Forests.
Modern India
A pair of articles from the same day’s newspaper about hospitality for elephants and landing an Indian on the moon show the beautiful span of contemporary India, which Jesse enjoyed again last week.
IIASA Softball (circa 1981)
Recalling the 25th anniversary of a memorable banquet of Laxenburg softball players, Judy Wagstrom sent Jesse the IIASA team photo from the 1981 party in Vienna.
Galling thrips split by mtCOI
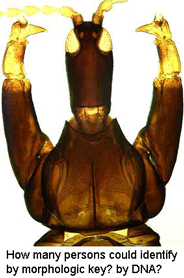 Thrips are tiny (.5 to 2 mm) plant feeding insects; approximately 4500 species are known, and some are serious agricultural pests. Kladothrips is an Australian genus of at least 35 species which form galls on Acacia trees. In Biol J Linn Soc 2006 88:555 researchers from Flinders University, Australia, apply mtDNA analysis to show that two gall morpho-types of Kladothrips rugosus represent different species.
Originally described in 1907, K. rugosus is widely distributed across south and western Australia. Two gall types were noted, but no morphologic differences could be found in the thrips themselves. McLeish, Chapman, and Mound found pairwise uncorrected mtCOI p-distances were 0.0-0.6% within gall morphotypes, and 7.4-7.8% between, similar to distances within and among other gall thrips species. The authors aver the usual taxonomic distaste for distance measures (“Distance values are not intended as a means of identifying different species here, which is a problematic approach for species depiction, but as useful descriptors of genetic variation”). I translate this as distance measures can be used help discover new species, but are verboten in official species descriptions.
The only morphologic differences are that “abdominal segments 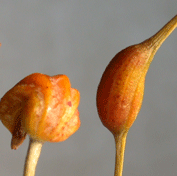 I-III are as brown as IV-VII, the metathorax is scarcely paler than the brown mesothorax and prothorax, and the sculptured reticles on the posterior half of of tergites II-III are all small and equiangular.” Phew! Not many persons could decipher such abstruse morphologic terminology, whereas DNA-based identification promises more democratic access to species identification. The main limiting factors are technological and likely solvable: establishing reference libraries and developing inexpensive DNA analytic methods.
The authors found a third genetic cluster in K. rugosus, but were unable to discover any morphologic characters, so did not describe this as a new species. This seems scientifically inconsistent, and the authors seem to agree: “This lack of morphologic divergence has evident problems for traditional taxonomy..we suggest that “morpho-taxonomy” is little more than an historical artifact in the methodology of species recognition, despite commonly providing the most practical methods”
I hope the large data sets emerging from the barcode initiative and other genetic surveys will enable taxonomists to develop consistent methods of species delimitation, whether in thrips or thresher sharks, and the sequences themselves or their diagnostic nucleotide characters will be routinely incorporated into species descriptions.
Yantovski on Tommy Gold
Under PHE auspices, Evgeny Yantovski, one of the originators of the concept of Zero Emission Power Plants, has written a startlingly imaginative tribute to the late Tommy Gold, “Thomas Gold and the Future of Methane as a Fuel,” in which Evgeny presents Fayalite as a fuel, with methane being the energy carrier. Viewed in this way, methane is a renewable energy source.
PNAS publishes Forests paper
The PNAS has published our new paper “Returning forests analyzed with the forest identity.” We also post a press release about it from the U. of Helsinki and a map showing major countries that are gaining or losing forest. It has been a pleasure over the past year to cooperate with co-authors Pekka Kauppi, Jingyun Fang, Alexander Mather, Roger Sedjo, and Paul Waggoner.
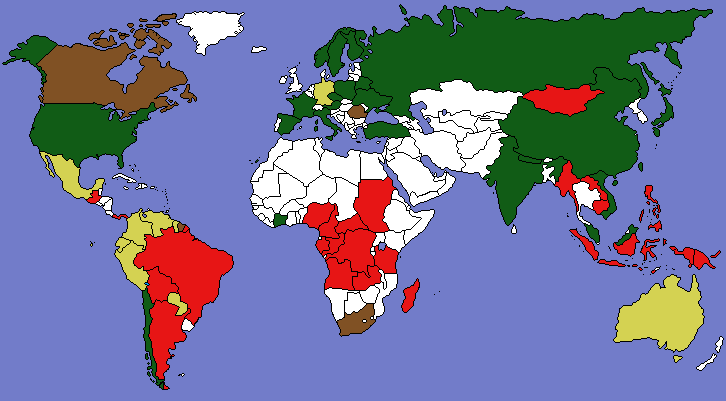
We take this occasion to recall some of our preceding papers on forests:
Foresters and DNA (PDF)
Jesse H. Ausubel, Paul E. Waggoner, and Iddo Wernick
In Williams, C.G., Landscapes, Genomics and Transgenic Forests, pp. 13-29,
Kluwer, Dordrecht, 2006.
Would editing a few bytes of the genetic message for a tree to fit human desires do harm or good? To meet demands of larger populations and changing diets, farmers have used a series of innovations to lift yields and thus reduce the area of land needed to support a person. Since 1950 rising yields have stabilized land for agriculture and now promise a Great Restoration of nature on land spared. Foresters have also lifted yields and could lift them much higher, thus sparing natural forests while meeting demand for wood products, whose growth is anyway slowing. While weak demand, numerous worries, and vague promises will slow penetration of genetically modified trees, any technology that improves spatial efficiency has appeal, and editing DNA could lift yields. Both farmers and foresters must work precisely, using fewer hectares and more bits. Fortunately, foresters have several decades in which to test and monitor their practices before genetically modified trees will diffuse widely.
On Sparing Farmland and Spreading Forest
Jesse H. Ausubel
In Clark, T. and R. Staebler, eds., Forestry at the Great Divide:
Proceedings of the Society of American Foresters 2001 Convention, Society of
American Foresters, Bethesda MD, 2002, pp. 127-138.
How Much Will Feeding More and Wealthier People Encroach on Forests?
Paul E. Waggoner and Jesse H. Ausubel
Population and Development Review 27(2):239-257 (June 2001).
David G. Victor and Jesse H. Ausubel
Foreign Affairs 79(6):127-144, November/December 2000.
The Forester’s Lever: Industrial Ecology and Wood Products
Iddo K. Wernick, Paul E. Waggoner, and Jesse H. Ausubel
Journal of Forestry 98(10):8-13, October 2000.
Searching for Leverage to Conserve Forests: The Industrial Ecology of Wood Products in the U.S.
Iddo K. Wernick, Paul E. Waggoner, and Jesse H. Ausubel
Journal of Industrial Ecology 1(3):125-145, 1997.
The forest and the creatures it shelters exemplify nature, and logging exemplifies the impacts of humans on it. By the early 1990s Americans annually removed 70% more timber from the forest than in 1900. Growing population and affluence far outpaced this rise. Since 1900 U.S. population rose more than three times and gross domestic product (GDP) per person increased almost five. Despite more people, affluence, and timber removals, the area of U.S. forests remained constant over the century. Since mid-century, standing timber volume rose nearly 30%. The practices of consumers, millers, and foresters, responding to style, ethics, technology and the consequent economics, have each contributed to these outcomes . We examine the role of each of these actors in the industrial ecology of forests to reveal their leverage for improving environmental quality. Consumers lessened their intensity of use of wood products (wood products per GDP) during the century by 2.5% annually to substantially offset the expanding population and GDP per person. Sustaining the historic trend will level or lower timber consumption if population and affluence grow at expected rates. Millers became more efficient at getting products out of logs as well as utilizing wood residues and recycled fibers for their material or energy value. Given their already high efficiencies, millers face little opportunity to reduce future harvest of trees. Foresters provide leverage by influencing the environmental impact of logging and the long-term adequacy of timber supplies. By raising productivity they promise to use less forest land to grow and harvest timber. In the future, steady or declining demand for trees coupled to greater forest productivity appear likely to spare more U.S. forest land for sequestering carbon, ecosystem services, and habitat for nature.
