We post “Comprehensive DNA barcode coverage of North American birds” recently published in Molecular Ecology Notes. PHE’s Mark Stoeckle co-authored the paper along with the now almost-classic 2004 paper “Identification of Birds through DNA Barcodes.” As Mark likes to say, Barcoding takes flight.
News
Industrial Ecology of Cadmium
Progress in Industrial Ecology published the Ausubel-Wernick-Barrett-Waggoner paper Industrial Ecology for Leverage to Let Loose Less Cadmium . We thank Peter Elias, who helped us start work on cadmium back in the 1990s. The paper exemplifies a kind of analysis we recommended in our 1997 report Industrial Ecology: Some Directions for Research. The growth of industrial ecology as evidenced by the development of the Journal of Industrial Ecology, Progress in Industrial Ecology, and the International Society for Industrial Ecology is gratifying. And, for those worried about cadmium, remember to think zinc.
Horizontal genomics with bats and birds
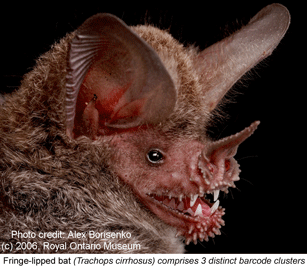 Two papers in early online Mol Ecol Notes report large scale COI surveys of tropical bats and North American birds. In the first paper, Clare et al examined 840 specimens representing 87 (72%) of 121 known bat species in Guyana, each derived from vouchered specimens held at Royal Ontario Museum, including multiple individuals (range 2-74) from 73 (84%) of species. 81 of 87 species had distinct COI barcodes with average intraspecific variation of 0.6%. In the remaining 6 species, 15 distinct mitochondrial lineages were found which likely represent overlooked cryptic species.
As most bats are small brown animals that fly around at night emitting noises that humans cannot hear, it is not surprising that some have been overlooked, and it seems probable many new species will be found lurking in museum drawers. Even in relatively bat-poor temperate regions there may be hidden diversity. It was not until 1997 that Europe’s most abundant and best studied bat, the Pipistrelle (Pipistrellus pipistrellus, Schreber 1774) was suggested to be 2 species through DNA analysis, a hypothesis confirmed by biological covariants and official species designation in 1999.
In the second paper, Kerr et al (I am a co-author) report a continental-scale survey of mtCOI sequences in North American birds, including 2590 individuals from 643 species, representing 93% of the breeding avifauna of Canada and the United States. 94% of species had distinct barcodes, and in the remaining 6%, barcode clusters corresponded to small sets of closely-related species, most of which hybridize regularly. Fifteen (2%) of currently-recognized species were comprised of two distinct barcode clusters, many of which may represent cryptic species.
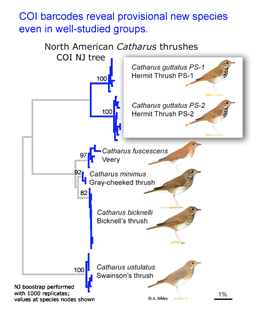 Birds being conspicuous, vocal, diurnal animals it is surprising that there are what appear to be overlooked species, even in an intensively-studied temperate region with relatively few species. Of course barcode clusters are not proof of species status, but to my knowledge all such divergent lineages either correspond to recognized species, or have subsequently been found to show biological covariants and have ultimately been granted species status.
Sequencing of large tissue collections housed in museums can be done relatively rapidly and inexpensively. It is a challenge on how to report results in a way that communicates the genetic findings in a timely fashion without trampling on the careful procedures designed to maintain order in taxonomy.
By using tissues derived from vouchered museum specimens, these barcoding studies lay the groundwork for subsequent taxonomic study. By analyzing a standardized region, DNA barcoding studies can be stitched together to create a large-scale map of biodiversity, a horizontal genomics approach mapping leaves on the tree of life.
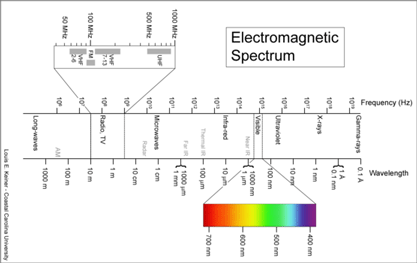 I see the “barcode map of genetic diversity” as analogous to an astronomical sky map that uses just a slice of the electromagnetic spectrum. It does not contain all the information necessary to understand the universe, but by focusing on one part of the spectrum it enables results from various studies to be seamlessly combined and allows both large and small scale comparisions.
DNA barcodes for almost all North American birds published
Our paper establishing DNA barcodes for almost all (94%) of North American birds appears, together with a paper on barcodes for bats as well as a methodological paper, in Molecular Ecology Notes. For a copy of the paper as well as images and other information, visit
https://www.barcodeoflife.org/barcode/batsbirds/
“Why every protist needs a barcode”
In February 2007 Microbiology Today, scientists report on the Barcoding Protists Workshop held in Portland, Maine in November 2006, which was attended by 40 protist experts from 12 countries (Australia, Canada, Denmark, France, Germany, Japan, Malaysia, Netherlands, Norway, Russia, UK, and USA). The workshop was co-sponsored by the US National Center for Culture of Marine Phytoplankton and the UK NERC Culture Collection of Algae and Protozoa.
According to Williamson et al, “most original descriptions for [over 200,000 named] protist species are based on light microscopy and ink drawings, not only making species identification for some groups an inherently subjective and specialist occupation, but also potentially hiding major genetic diversity.”
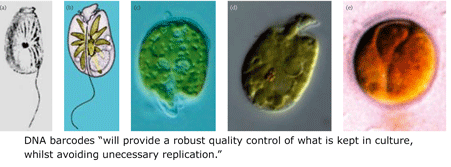
Workshop participants agreed unanimously that “to help resolve many of the contradictions and uncertainties in protist taxonomy, genetic barcoding is the way forward, starting with material, particularly type strains, in internationally recognized culture collections.”
COI characters resolve chitons, distances do also
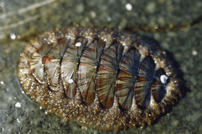 In early online 12 Jan 2007 Mol Ecol Notes researchers from Columbia University, American Museum of Natural History, and California State University analyze COI barcode region sequences of 131 individuals representing 19 species of Mopalia chitons. Chitons are molluscs with flattened segmented shells, and most of the 860 known world species are herbivores that graze in tidal zones, although some are found at depths up to 6000 meters. According to the authors “much of the biology of [Mopalia sp] remains undiscovered” because many “are difficult to distinguish from one another by morphology alone”, making them a good test case for DNA barcoding.
Kelly et al compared three approaches for identifying Mopalia chitons by COI. First, they used a “character based assessment called characteristic attribute organization system (CAOS)”. In this approach, a “guide tree” is generated using maximum likelihood or parsimony, and CAOS identifies sets of characters for each node in the guide tree. CAOS then attempts to assign unknowns based on these characters. If there is insufficient information 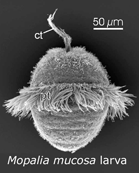 to assign the query sequence, CAOS stops the analysis. The authors compared CAOS to neighbor-joining distance analysis on Barcode of Life Data Systems (BOLD) site, and to BLAST algorithm. All three approaches had overall accuracy of 100% when provided with the entire data set. CAOS was superior to NJ and BLAST when a skeletonized reference set containing of 50% of the total sequences was used.
CAOS automatically identifies diagnostic molecular characters, and this will help integrate DNA barcode data into traditional taxonomy. For practical use, diagnostic sequence differences may aid design of solid-state microarrays that detect species in environmental samples, such as the 0.1mm Mopalia mucosa planktonic larva shown here, which might be found floating in seawater, or in the stomach of a krill.
Revealing krill diets with DNA
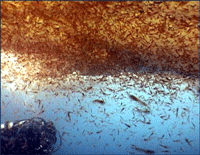 Krill are shrimp-like crustaceans found throughout the world’s oceans. The Antarctic krill, Euphasia superba, is thought to be the most abundant species on the planet in terms of biomass (500 million metric tonnes corresponding to 5 x 10^14 individuals), is a primary food source for whales, seals, and oceanic birds, and functions as a major planetary carbon sink by excreting waste that sinks to ocean floor. What does this very abundant, central-to-food-web species eat? For many animals, observation of eating behavior is impractical, and analysis of stomach contents or feces may be the only way to determine diet. However, such material may be morphologically unrecognizable.
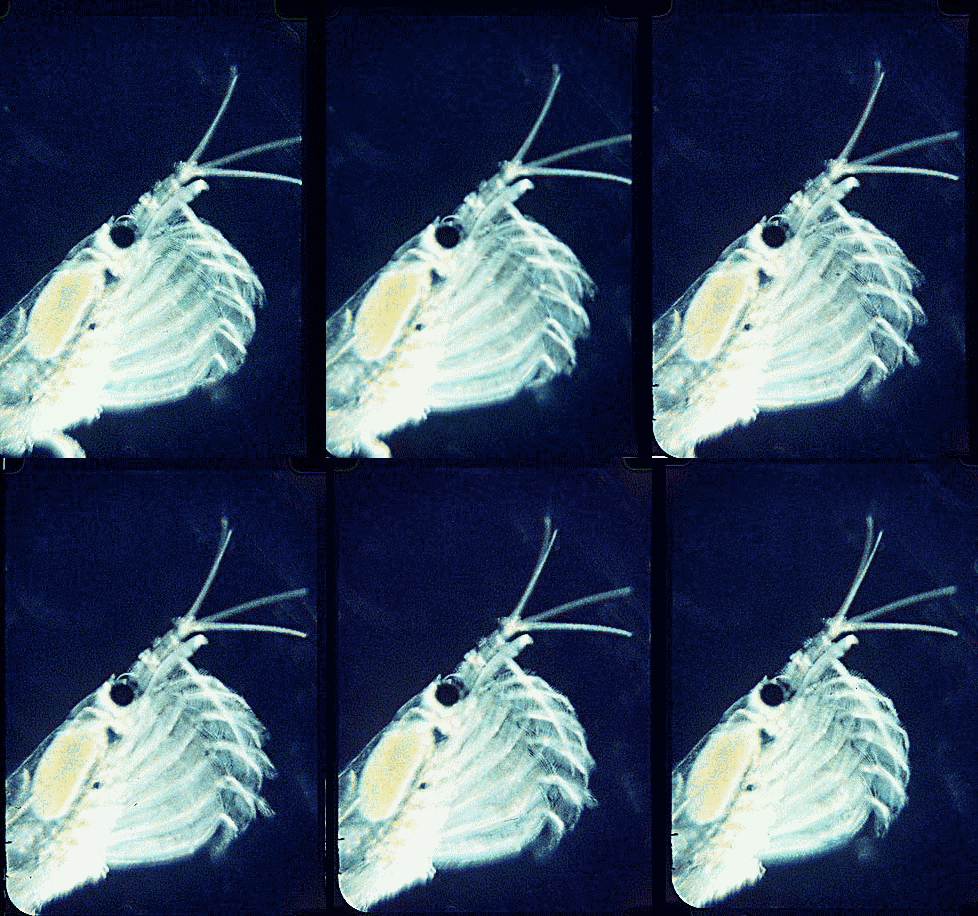 In August 2006 Marine Biotech 8:686, researchers from University of Tasmania and Department of Environment, Tasmania, compare DNA sequencing and light microscopy in identifying prey in stomach contents of E. superba. Passmore et al isolated DNA from stomach contents of 6 ethanol preserved krill and, using diatom-specific primers, amplified a 103 bp portion of nuclear small subunit RNA (ssRNA). ssRNA was used because at present it has the best taxonomic representation in GenBank for krill prey species. The researchers sequenced at least 50 clones from each individual krill and found 14 OTUs (operational taxonomic units), with 86% to 100% match to GenBank sequences. These results were compared to microscopic identification of diatom silica skeleton fragments in stomach contents, which involved counting 1000-3000 fragments per individual. Results were similar, although DNA analysis and light microscopy each appeared more sensitive for certain species. This study might be a best case for light microscopy because silica-skeletoned diatoms are not easily digested. As the authors point out, krill also consume a range of protozoa and small zooplankton, and the importance of these sources may be underappreciated.The authors conclude “the application of DNA diet analysis to krill warrants further investigation, particularly for prey that are difficult to study using other methods“.
This work shows the essential need for a comprehensive reference library, so far lacking. A study underway is examining mitochondrial and nuclear genes as barcodes for phytoplankton. Looking ahead, a “massively parallel” pyrosequencing approach could enable rapid and representative analysis of mixed environmental samples, such as stomach contents, without biases resulting from amplification and cloning.
Tiny barcode identifies food plants, works on 20,000 year old DNA
In early access Dec 2006 Nucl Acid Res, researchers from 9 laboratories in France, Italy, Norway, and Denmark examine a candidate barcode gene for land plants, the group I intron in the chloroplast leucine transfer RNA gene (trnL intron). Prior research has already shown that a simultaneous or tiered multi-gene approach will be needed to distinguish among closely-related land plant species. A project coordinated by Royal Botanic Gardens, Kew aims to identify the best overall approach.
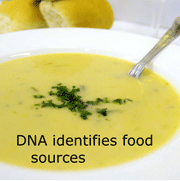 Rather than cracking the tough nut of an ideal plant barcode, Taberlet and co-authors look at a simple approach “emphasizing the point of view of scientists other than taxonomists“, and test this on food plants in archeological and industrial applications. The chloroplast trnL intron is not the most variable non-coding region in chloroplast DNA and does not differ enough to separate many closely-related plant species. On the plus side, there are robust primers which amplify the intron from diverse species. Like other group I introns, the trnL intron sequence has catalytic activity and a conserved secondary structure with alternating conserved and variable sequence domains. Taking advantage of this feature, the researchers designed primers to amplify one of the variable domains, the P6 loop. Binding sites for both the trnL primers, which amplify the entire intron, and the P6 loop primers are “highly conserved among land plants, from Angiosperms to Bryophytes“. Importantly, the P6 loop is only 10 to 143 bp and can be amplified from degraded DNA.
Using “simulated ePCR” with the large GenBank data set, trnL intron and P6 loop sequences identified to species level 67% and 19% of cases respectively. However, in many practical applications, the number of possible species that need to be distinguished is relatively small and they are taxonomically diverse. Following this reasoning, Taberlet et al tested the intron and its P6 loop on a set of 132 species found in the Arctic and 72 species representing the commonest food plants. With Arctic plants, trnL intron and P6 identified to species level 85% and 47%, respectively. With the food data set, the tiny P6 loop was sufficient to identify 78% to species level. The P6 loop was successfully amplified from a 20,000-year old permafrost sample, from human feces, and from various processed foods including detecting potato, leek, and onion DNA in dried soup mix!
This is an exciting study, and DNA barcoding will likely have multiple applications in food safety. Whether or not these exact gene regions are adopted, a standardized approach will enable widespread and inexpensive use.
COI solves leech mix-ups
Relying on morphologic species descriptions lacking DNA sequences is like diagnosing patients without laboratory tests. An experienced clinician can often make the correct diagnosis from examination alone, but laboratory tests are frequently needed to confirm or point to other causes. Many advances in medicine reflect incorporating laboratory testing into routine evaluation. Two papers on leeches suggest similar benefits to taxonomy from incorporating mtDNA analysis into routine practice.
 In May 2005 Conservation Genetics 6:467 researchers at the American Museum of Natural History analyze morphology, mitochondrial COI, and nuclear ND-I sequences of genus Helobdella leeches from Austrialia, New Zealand, South Africa, Hawaii, and South America. The tale starts with a leech discovered in Germany in 1985, H. striata, re-named H. europaea in 1987.
Authors Siddall and Budinoff found that H. europaea is morphologically and genetically indistinguishable from a leech “discovered” in Australia in 1998, H. papillornata. Including COI sequences in initial species descriptions would have prevented wasted taxonomic effort, and a species native to South America would probably not be given the unfortunate name europaea.
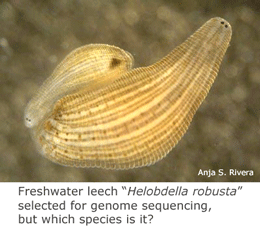
In December 2006 Evol Devel 8:491, scientists from University of Maryland and University of California, Berkeley, apply COI barcoding to another Helobdella leech, H. robusta, a model organism in developmental biology and one of the lucky species selected for genome sequencing. Researchers Bely and Weisblat obtained leech specimens from laboratory cultures and field sites. They found that isolates thought to be H. robusta actually represent four species, 2 of which co-exist at the same locality. The authors observe “the perils of misidentification and taxonomic confusion in the lab are numerous and costly” and conclude with a call for routine application of DNA barcoding and collection of voucher specimens to confirm identity of laboratory organisms.
All Birds Barcoding Initiative in the mail
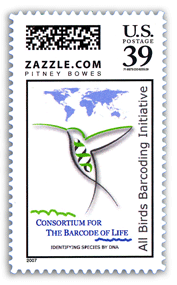
For enjoyment or use, a US postage stamp featuring All Birds Barcoding Initiative (ABBI) and the Consortium for the Barcode of Life (CBOL) is available at zazzle.com.