Birds have been the subject of intense genetic study for over 20 years. How large is the legacy of avian genetic data? Researchers studying species-level differences in birds and other vertebrates have most often used cytochrome b (cyt b). Some have worried that analyzing COI in birds is redundant as there are already cyt b sequences for many avian species. Of course, even if there were a complete set of cyt b sequences for the approximately 10,000 species of world birds, it would still be beneficial to collect COI barcodes to enable wide comparisons across the diversity of life. Here I look briefly at what is in GenBank for birds. To do so, I prepared a spreadsheet “avian name look-up.xls”, which recognizes 2,347 synonyms, alternate and mis-spellings, and extinct species, producing an output list of extant bird names harmonized to Clements.
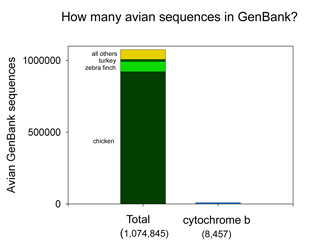 There are more than 1 million sequences in GenBank, but over 900,000 are from the Jungle Fowl (ie chicken, Gallus gallus), and another 85,000 from Zebra finch (Taeniopyga guttata) and Wild turkey (Meleagris gallopavo). That leaves about 67,000 sequences in total representing the rest of the approximately 10,000 species of world birds. According to Clements’ Birds of the World (including updates through 2006), there are 9,919 recognized species. The other world lists are very similar, and differ primarily in whether certain forms are recognized as species or subspecies and in assignment of generic names. I find it surprising there is not a single global taxonomic authority for bird species status, names, spelling, generic and family classification. As a comparison, medicine would be in great difficulty if there were not a single standard nomenclature for pathogenic bacteria.
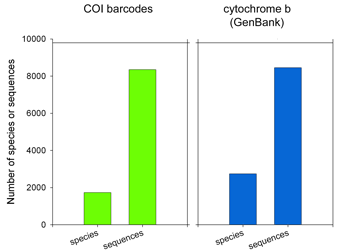 62,571 of the remaining 66,969 sequences are in the “CoreNucleotide” database (the others are unnamed genetic loci, either Expressed Sequence Tag (EST) or Genome Survey Sequence (GSS) records, and these will not be considered further here). Only 4,951 bird species are represented by any sequence (50% of world birds), and there are cytochrome b sequences for only 2,751 species (28% of world birds). Of species with cyt b sequences, 60% are represented by single sequences.
How does this compare to COI barcode data so far? As tracked on the All Birds Barcoding Initiative website, researchers have collected 8,353 COI barcode records from 1,730 species, including 2 or more sequences from approximately 80% of species analyzed to date.
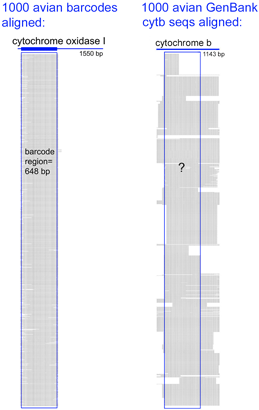 Virtues of the DNA barcode data set include that sequences are linked to vouchered museum specimens and their associated collecting data, sequence records include trace files to confirm sequencing accuracy, and most important all sequences can be directly compared because they derive from a standardized region. GenBank cyt b files include sequences of varying length and position along the gene. An alignment of 1000 avian COI barcodes and 1000 avian cyt b sequences hints at the power of a standardized approach.
.
.
.
.
.
.
.
.
.
 A dream of many came to life this week with launch of
  The Scanning and Digitization Group will accelerate the work of the
 In
In 
 The results show a “variegated picture of the taxonomic status of publicly indexed fungal sequences“. Taxonomic coverage is sparse: of the estimated 1.5 million fungi, less than 1% (9,684 species) are represented. Taxonomic data is lacking for many sequences (27% are not identified to species level), and most of the species-level identifications are unverifiable (82% are not linked to voucher specimens, 63% are not tagged with specimen country of origin, and 42% are marked as unpublished). Sequence comparisions suggest mislabeling is common (11% show best matches to congeneric but heterospecific sequences, and another 7% match among species of a different genus. Overall 10-21% of the INSD sequences have incorrect or unsatisfactory annotations.
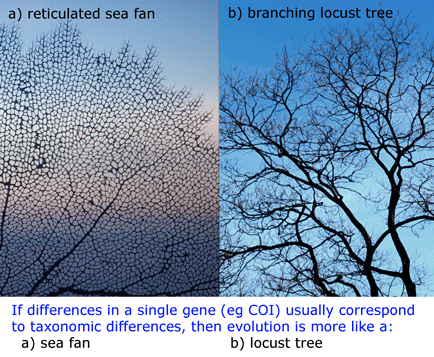
 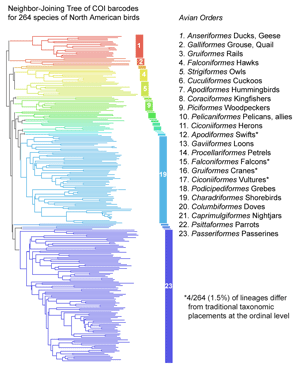 COI barcoding is a standardized approach to identifying species by DNA, helping resolve the “leaves” on the tree of life. Will the growing arrays of COI sequences also help provide insight into evolutionary history, the “branches” of the tree? I am struck that in some cases, simple genetic arithmetic with COI sequences creates trees very similar to modern phylogenies painstakingly created from multiple nuclear and mitochondrial genes, multiple morphologic characters, and exhaustive computerized analysis. Shown at right, a neighbor-joining analysis of