Solving puzzles of mitochondrial variation within and among species

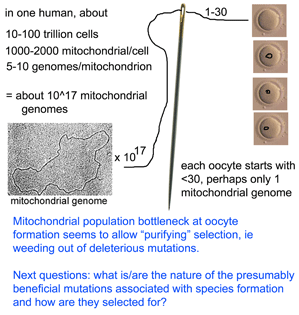
What limits mitochondrial variation within species?  In January 2008 PLoS Biology researchers from Karolinksa Institute, Sweden, and University of Newcastle upon Tyne, United Kingdom, report on an ingenious mouse model that shows strong purifying selection acting within a single generation, or even earlier, during embryogenesis. Stewart and colleagues employed “mtDNA mutator” mice which are homozygous defective for a nuclear gene which encodes a proof-reading subunit of mtDNA polymerase. These mice have increased levels of mtDNA mutations in all tissues, with mutations evenly distributed along all codon positions in mtDNA protein genes, accelerated senescence and “a number of phenotypes associated with mitochondrial diseases.” mtDNA mutator mice were backcrossed to wild-type mice to produce offspring that inherited defective mitochondria but whose nuclear genome is homozygous normal at the mtDNA polymerase locus.  They then sequenced entire mitochondrial genomes from 190 of these progeny individuals in N2 to N6 generations (N2 is the first backcross that is homozygous normal at mtDNA mutator locus). To skip to the conclusion, most of the non-synonomous mitochondrial mutations were eliminated, leaving a pattern of  excess synonymous mutations similar to that seen in human populations (which are the largest dataset so far for mitochondrial variation). The authors conclude that the mitochondrial population bottleneck known to occur at oogenesis, which deposits just one or few mitochondrial genomes per oocyte, means each mitochondrial genome must stand on its own so to speak, with the result that those eggs, embryos, or offspring harboring defective mitochondria will fail to survive. My figure at right tries to illustrate part of this process. 
In the same issue, David Rand, Brown University, provides a lucid commentary on Stewart et al’s research putting it in the context of mitochondrial and evolutionary biology, and suggesting next steps. Among others, he notes “the new mouse study also begs new questions about positive selection on mtDNA. …it is interesting that no signature of a selective sweep leading to fixation of a novel mtDNA variant was evident in the data”.

Purifying selection against deleterious mutations enabled by an embryonic bottleneck may save mtDNA from “mutational meltdown”. Now we need to understand more about the positive selection on mtDNA that presumably occurs when species adapt to new environments or diverge. I believe that growing mtDNA databases in the form of COI barcodes from a diversity of organisms with varying size, lifespan, population size, and reproductive strategy, in a diversity of environments including marine, terrestrial, temperature, and tropical regions will help solve this puzzle.

Testing DNA barcodes to help identify biodiversity hotspot plants including endangered and cryptic species

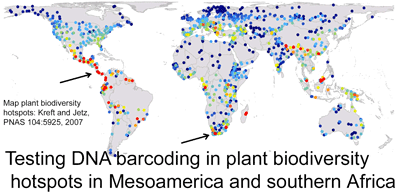
Plants challenge DNA barcoding. It has been difficult to identify candidate barcode regions that amplify readily and also distinguish among closely-related species. In 7 February 2008 PNAS (open access) researchers from University of Johannesburg; University of Costa Rica; Royal Botanic Gardens, Kew; and Imperial College, London, analyze potential barcode regions on specimens collected in plant biodiversity hotspots in Kruger National Park, South Africa, and Costa Rica. They initially tested eight candidate regions identified in earlier studies (coding regions accD, rpoC1, rpoB, ndhJ, ycf5, and matK, and non-coding trnH-psbA). Amplification was done according to earlier studies except that a different set of matK primers was used which appeared to be more effective. All eight regions were examined in 101 specimens representing 32 species of trees, shrubs, and achlorophyllous parasites from South Africa, and on 71 specimens representing 48 species of Costa Rican orchids (in all, 44 species with 2-7 specimens per species, and 36 species with one sample). Based on their analysis, the coding region matK with the new primer set and the non-coding region trnH-psbA were >90% effective in species identification. For reasons I do not understand, the authors favor unweighted pair group method with arithmetic mean (UPGMA) for analyzing genetic clustering, although they tested neighbor-joining, maximum likelihood, maximum parsimony, and Bayesian methods. Given the presumed advantages of a coding region barcode (ease of alignment, greater higher-level phylogenetic signal), Lahaye et al propose 5′ region of plastid gene matK as a first-pass standard barcode for plants.  

The authors then analyzed the 5′ matK barcode in a much larger sample of orchids: 1,566 specimens representing 1,084 Mesoamerican species. It is exciting that this is the largest test of candidate barcode variation within species for plants to date. They report 212 genetic clusters in UPGMA tree, of which “86 fully matched previously recognized species and a further 25 partially matched taxonomic species…an examination of these clusters reveals cryptic species, which need further taxonomic work”. I am unsure from this short report what “partially matched taxonomic species” are and how many possible cryptic species were identified. I look forward to a more detailed report on the DNA barcodes, morphology, and range distribution of this very large sample of Mesoamerican orchids.  A DNA-based method for identifying non-flowering orchids and other plants could help protect many threatened species. 

Science issue on cities

Our work in the 1980s on Cities and Their Vital Systems with Robert Herman, Cesare Marchetti, Alvin Weinberg, Brian Arthur, Nebojsa Nakicenovic and others seems to have acquired cult status, and caused Jesse’s inclusion in a video podcast (high and low bandwidth) to introduce the 8 February 2008 special issue of Science magazine dedicated to cities.The issue also includes an article by Paul Grant on Chauncey Starr’s concept of the supergrid for joint distribution of hydrogen and electricity.

New translation of classic Mendeleev article on origins of petroleum

Where did petroleum come from? How did it form? When? These are the first few questions the great scientist Dmitri Mendeleev asked in the chapter “On the origins of petroleum” in his book “Petroleum industry in Pennsylvania and Caucasus“. The year was 1877, 120 years after Mikhail Lomonosov pronounced that oil is a fossil fuel.

We are happy to post Veselin Kostov’s translation of this chapter together with a list of references on the abiogenic theory of petroleum origin (wherever our limited knowledge of Russian interrupted the continuous flow of Mendeleev’s thoughts and ideas, we’ve put XXX or ??). We leave to the reader to decide which theory holds more merit.

Deepwater clam mtDNAs map in unexplored sequence territory

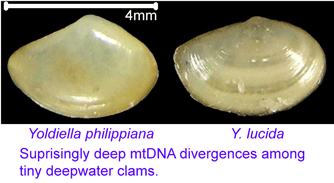
Approximately 8,000 – 15,000 species of bivalves (clams, mussels, scallops, oysters, and relatives) are known. According to BOLD Taxonomy Browser www.barcodinglife.org, 620 bivalve species have COI barcode records so far, so this group is relatively unexplored genetically. In September 2007 Zoologica Scripta researchers from University of Bergen, Norway, analyze COI barcode region sequences of 62 deepwater clams dredged in a single offshore region at 69 m to 567 m, morphologically identified as 12 species from 4 genera (Thyasira, Ennucula, Nucula, Yoldiella) representing 3 subclasses of Bivalvia. The COI barcode region was amplified with broad-range primers (Folmer et al 1994). Mean differences within species collected in this single area were small, 0.0 – 0.48%, similar to results in other animal groups, suggesting assignment of specimens to species will be straightforward. This will be helpful in environmental surveys for example, as some species “are infamous for being difficult to determine to species from morphology” and some “remain difficult to identify for the non-expert.” As one example, some Thyasira species are distinguished only by sperm and egg morphology, which is impractical in most circumstances.

https://www.conchology.be/en/home/home.phpmtDNA differences among these bivalves are remarkably large, even among species in the same genus. The differences among congeneric species in this sample (average 22%, range 12-42%) are larger than differences among entire class Aves (according to my analysis with BOLD software, COI differences among birds in different orders, such as penguins and hummingbirds for example, average 20%, with range 14-28%).

Blastn GenBank searches with these divergent mtDNA sequences showed very limited identity to anything, and the closest matches were short stretches (100-150 nucleotides of the 678 full-length barcode sequence) to COI sequences of species outside the phylum Mollusca (I obtained similar results submitting Thyasira sequences for example to the public BOLD Identification Engine at www.barcodinglife.org.)  It will be helpful if Mikkelsen et al deposit their sequences along with associated collecting data (voucher specimen information, images, collection locations) to the BOLD database. I look forward to learning more about these bivalves, and whether their remarkably deep differences in mtDNA are associated with deep physiological, ecological, or other biological differences.

Mapping biodiversity with DNA: sectors analyzed so far

As of 28 january 2008, there are 341,825 barcode records from 35,798 species in the Barcode of Life Database (BOLD) www.barcodinglife.org . What sectors of biodiversity have been analyzed so far? Here I follow the daily updated pages publicly available through “DNA Taxonomy Browser” link on BOLD home page. One can click downward through the taxonomic hierarchy from phyla to species, with a cogent summary at each level showing barcode records so far, contributing institutions and countries, and collection locations. The summary map shows remarkably good coverage of most terrestrial and coastal regions, and representation of nearly all countries. The open oceans are sparsely sampled so far, and remain an exciting terra incognita for biological exploration, including with DNA barcoding.  The global totals of 342K records/36K species work out to about 10 barcodes/species, and the average number of barcodes/species is similar at least down to the class level for most groups I looked at, suggesting a target of roughly 10 specimens per species is being achieved. 

The densest records so far are from Phylum Arthropoda (244,297), particularly insects (230,838), and of these mostly Lepidoptera (moths and butterflies) (169,145); and Phylum Chordata (74,720), particularly mammals (27,186), fish (26,752), and birds (12,770). There is broad sampling of other groups, including records from 376 animal orders in 80 classes representing 25 phyla. In addition, there are a few thousand records from fungi (3 phyla, 8 classes) plants (mostly red algae; 3 phyla, 8 classes), and protists (7 phyla, 11 classes), the latter of which DNA barcoding is likely to reveal as an enormous, deeply diverse group. 

The first paper proposing DNA barcoding was published in February 2003. The results displayed today on BOLD Taxonomy Browser demonstrate amazing progress in a short time, thanks to the inspiration and hard work of many! 

Standardized DNA analysis gives new vision of biodiversity, disturbing some

By identifying species (leaves) and determining how they are related (branches), taxonomy aims to reconstruct the Tree of Life. To do so taxonomists must distinguish variation within species from that between species, and identify the shared characters that reflect evolutionary ancestry. These tasks require highly-specialized sets of knowledge and skill for each animal and plant group. 

One result is that it has been difficult to compare patterns of diversification between different branches in the Tree. One might ask, how finely and how evenly divided is biodiversity? Are the differences among and within mosquito species (3,400 species), for example, similar to the differences among and within fruit flies (6,200 species) or birds (10,000 species)? Broad application of DNA analysis is beginning to provide some insights. To enable these sorts of comparisons, a standardized locus is needed, as unique genes can solve local branching patterns, but do not allow easy comparisons between branches.

Large-scale surveys of standardized genetic loci, including COI barcoding, commonly reveal distinct groups within what was thought to be a single species. There is also the converse finding that in some cases COI barcode sequences do not distinguish named species, but generally this strikes me as a relatively minor scientific problem that usually involves very closely-related species pairs and can be solved where needed with more DNA sequence, assuming the underlying taxonomy is correct and the named species really are distinct. The greater scientific challenge is finding multiple groups within what appear morphologically to be single species. In many cases so far, organisms with genetically distinct COI barcode clusters show associated biological differences signalling they represent different species.

In December 2007 Mol Ecol 16:4999, researchers from Museum of Comparative Zoology, Harvard, examine genetic differences in Aoraki denticulata, a tiny (2-3 mm) daddy longlegs or harvestman spider found in leaf litter widely through New Zealand.  They determined COI barcode region sequences for 119 individuals from 17 localities in the mountainous northern part of South Island. The two described subspecies A. d. denticulata and A. d. major were genetically distinct. The surprising finding was there were at least 14 distinct clusters within A. d. denticulata, with a different group at almost every site, and 2 clusters at 3 of the sites. The differences between mtDNA clusters were as larger or larger than between other Aoraki species, up to 19.2%, but no morphologic differences were found even with electron microscopic scanning of males. Boyer et al observe “while it is conceivable that some of the geographically widespread populations…represent cryptic species, it is difficult to imagine that morphologically identical individuals from a single sample at a unique geographical point are not conspecific…it is hard to believe that almost every sampled locality would host at least one, if not two, cryptic species.”

Continue reading “Standardized DNA analysis gives new vision of biodiversity, disturbing some”