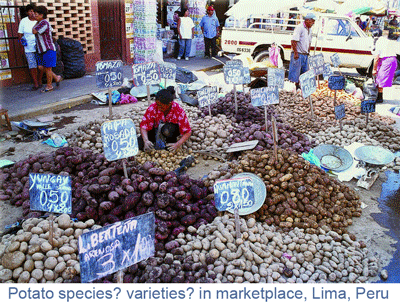
 In 7 May 2009 Amer J Botany, David Spooner, scientist at USDA and University of Wisconsin, applies DNA barcoding to wild potatoes. According to the author, “the taxonomy of sect. Petota [section Petota is a subdivision within genus Solanum which comprises wild and domesticated potatoes] is complicated by interspecific hybridization, introgression, allopolyploidy, a mixture of sexual and asexual reproduction and possible recent species divergences.” As an aside, this one genus Solanum contains over 1500 species, including such seemingly diverse plants such as nightshades, horsenettles, tomatoes, and eggplants. While the most speciose bird genera, for example, have fewer than 100 species, Solanum is one of at least 50 plant genera with over 500 species (Pelser et al 2002 Am J Botany). Such large genera are unwieldy for constructing phylogenies and testing DNA-based identification methods–do they reflect biological differences in rates of speciation among genera, or a lack of phylogenetic knowledge?
The above summary of Petota taxonomy is an understatement of the confusion regarding species boundaries in wild potatoes. For one, the apparent number of taxa seems to be shrinking rapidly: “an account of post-1990 taxonomic decisions of many workers published in Spooner and Salas (2006) reduced the 232 species of Hawkes (1990) to 190, but a taxonomic decision in my laboratory is converging on about 110 species.” Second, experts can be perplexed: “members of the complex are so similar that even experienced potato taxonomists…provided different identifications for identical collections numbers of the Solanum brevicaule complex in fully 38% of cases.” Third, genetic analysis (including multiple studies in the author’s laboratory) has been little help so far: “single- to low-copy nuclear restriction fragment length polymorphism (nRFLPs) and random amplified fragment length (RAPD) data…and amplified fragment length polymorphism (AFLP) data failed to clearly differentiate many wild species in the complex.” Independent work by researchers in the Netherlands (Jacobs et al 2008) similarly documents a challenging lack of concordance between genetics and taxonomy in Petota sp. Jacobs and colleagues performed AFLP analysis (this screens the entire nuclear genome) on 951 accessions representing 196 Petota species. Of the 196 taxa, multiple accessions of species clustered together in 58 cases, 38 formed multiple clusters, and 48 were mixed with accessions of other species. Regarding higher-level groupings, these researchers found absence of support for 4 Petota clades proposed by Spooner and colleagues, and conclude that recent speciation and high levels of hybridization will likely challenge attempts to create a genetic taxonomy of wild potatoes.
Given the above background, one might guess that a minimalist approach (ie DNA barcoding) using 2 or 3 plastid genes might not distinguish among Petota species whose underlying taxonomy and genetics are so jumbled. Thus I am puzzled why the author went to the trouble of performing this study, and why, having set out to do so, he analyzed only a single plastid gene (trnH-psbA spacer) when all recent plant barcoding studies I am aware of are based on a combined analysis of 2 or 3 plastid genes. The author also analyzed ITS nuclear gene segment (approximately 800 nucleotide segment containing ITS 1, 5.8S rRNA, and ITS2). This is interesting, although for some reason the phylogenetic analysis looked at ITS segment and trnH-psbA individually. I believe there is general understanding that a single barcode region will not suffice for distinguishing land plants. Lastly, I am puzzled why only 23 of 63 species analyzed were represented by multiple accessions. The author asserts “many barcoding studies lack robust assessments of intraspecific polymorphism or assessments of all species within a genus that are needed to assess the species-specific nature of barcodes;” as a general criticism I believe this comment is incorrect, but it does apply to the present study.
To summarize the study, 104 accessions of 63 Petota species plus 10 accessions of 9 outgroup species were analyzed (the author does not comment as to whether the selections are drawn from the revised total of 110 Petota species as defined in his laboratory). Regarding ITS, 23 species were represented by more than one accession; of these 10 species formed monophyletic lineages, which seems surprisingly good species-level resolution for a single marker in plants. With trnH-psbA, 17 species were represented by more than one accession; of these only 2 formed separate clades (1 of which did not form a distinct clade with ITS); as above, combined analysis was not done. The author dismisses matK on the basis of two previously published sequences for Petota sp. Finally, the trees used parsimony not neighbor-joining, the latter being the usual first-pass method of looking at barcode data. I find this paper a haphazard assessment of DNA barcoding in a taxonomically intensively-studied but poorly understood group.
High rates of horizontal gene transfer in archaea and eubacteria mean that it is not possible to draw clear species boundaries. It may be that relationships among potato species are similarly complex, and that species boundaries are fuzzier than the current taxonomy of morphologically-defined species would suggest. It seems to me that more taxonomic and genetic work is needed on this important group, including better tests of barcoding with combined analysis of 2 or 3 of the standard plastid regions in multiple accessions from a larger number of species. The goal of a standardized minimalist approach to identifying species, including wild potatoes, is important to help move beyond having only experts being able to identify plant species.
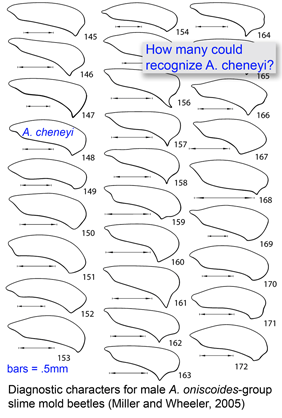 Most DNA barcoding analyses look at DNA identification through the lens of established taxonomy, ie how well does sequence data capture the species-level taxonomic categories established by morphologic analysis? In the special issue article
 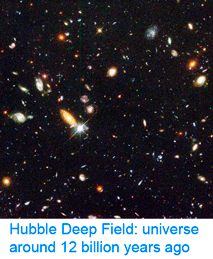 Deep space telescopes gather light from the early universe, providing pictures of the unimaginably remote past. What about the biological universe–can we peer back in time? Geochemical evidence suggests life on Earth arose about 3.5 billion years ago and fossils reveal what life looked like as far back as 3.0 billion years, and important fossil discoveries across that whole span of time continue to be made. What about DNA? As Carl Woese first realized, DNA sequences of living organisms contain signatures of their evolutionary relationships, and enable reconstructing history as far back as the origin of replication, even before cells and DNA. At the near end of the time scale, recovery of DNA from historical samples can help identify organisms that lived hundreds, thousands, tens of thousands, or even, in a few cases so far, hundreds of thousands years ago.
 “Too often a journal’s decision to publish a paper is dominated by what the Editor/s think is interesting and will gain greater readership — both of which are subjective judgments and lead to decisions which are frustrating and delay the publication of your work. PLoS ONE will rigorously peer-review your submissions and publish all papers that are judged to be technically sound. Judgments about the importance of any particular paper are then made after publication by the readership (who are the most qualified to determine what is of interest to them).”
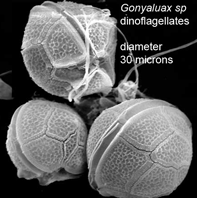
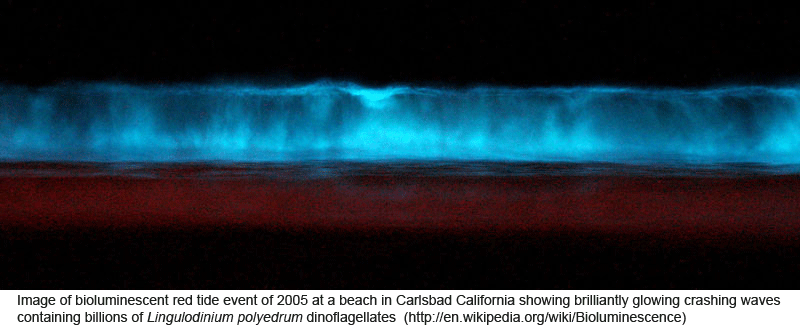
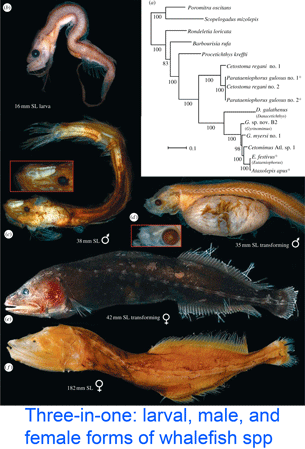 DNA helps flag genetically divergent forms that may represent cryptic species and is equally valuable the other way around: in linking morphologically diverse forms that occur within species. In
 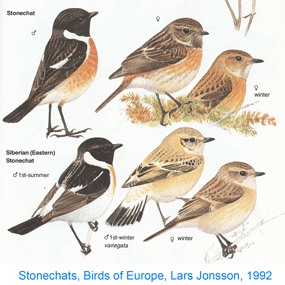 Mitochondria are the power plants of the cell, consuming oxygen and breakdown products of sugars, amino acids, and fatty acids to produce energy as ATP and heat. As originally proposed by
 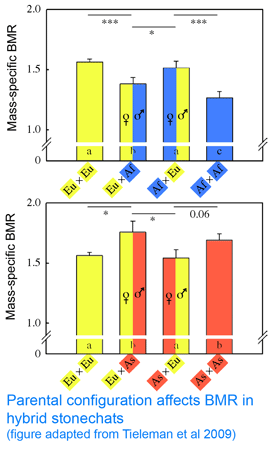 In
In