3rd International Barcode of Life Conference

Mark Stoeckle and Jesse Ausubel attended the 3rd International Barcode of Life Conference [https://www.dnabarcodes2009.org/] 7-13 November in Mexico City and were astonished and thrilled by the progress of the field since the March 2003 Banbury conference on DNA taxonomy that we catalyzed.  The conference press release summarizes vividly the progress, as does an article in the London Daily Telegraph.  Mark presented our new work with Larry Sirovich and Ken Zhang on application of indicator vectors to barcode data sets.

The Big Picture

The quarterly magazine of Woods Hole’s Marine Biologicial Laboratory, Catalyst (Vol. 4, No. 2,Fall  2009), publishes an interview with Jesse, “The Big Picture” about the Encyclopedia of Life.

DNA to help skates

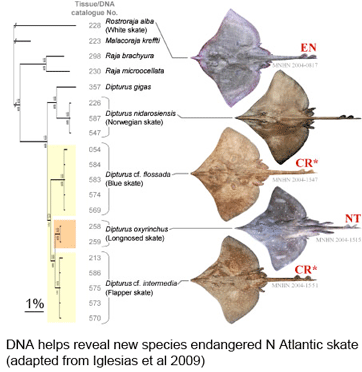
In current Aquatic Conserv Marine Freshwater Ecosys, researchers from Muséum national d’Histoire naturelle, France, report on 80 years of taxonomic confusion that has contributed to near extinction for a once abundant north Atlantic skate. Iglésias and colleagues found that two forms, lumped together in 1926 as European common skate (Dipturus batis, Linnaeus 1798), in fact represent distinct species with morphologic, genetic (in mitochondrial genome), and life history differences.

skateAs the researchers report, this taxonomic oversight obscured the disappearance of one species, the flapper skate (D. cf. intermedia) because it was confused with the less threatened  blue skate (D. cf. flossada).  Iglesias and colleagues marketplace survey revealed additional sources of confusion. They analyzed 4,110 skates landed over a 2 year period from 103 fishing cruises in four main French ports by 41 different French commercial trawlers, and found that five skate species (included the two named above) from two genera are variously lumped together under just two marketplace names, the aforementioned “European common skate (D. batis)” and “longnose skate (D. oxyrinchus);” according to their analysis the latter species, formerly common, is also locally extirpated, and most specimens with this name represent other species.

For newly rediscovered blue and flapper skates, the researchers report 20 diagnostic substitutions in approximately 2600-nucleotide segment spanning 12s and 16s RNA. Other than the 10 mitochondrial sequences included in this report, I find only two other D. batis sequences in GenBank (and none as yet under either of two resurrected names). It is remarkable that so little genetic information has been collected for such recently abundant, commercially important (annual landings in 1000’s of tons), and now threatened species. To aid standardized application of molecular identification techniques, I hope the authors will also analyze COI barcode sequences for their specimens. Then I look forward to school children aiding conservation and helping find new species by DNA barcoding specimens from their local fish markets!

Census of Marine Life in the news

The deep sea projects of the Census of Marine Life make news with their discoveries, as for example covered by AP’s Cain Burdeau in a 22 November 2009 story “Thousands of strange creatures found deep in ocean.” Meanwhile, the weekly Economist magazine features the Census on the cover of its “The World in 2010” issue and in an excellent article by Alun Anderson, “Introducing the transparent ocean.”

“Son et lumiere” – Exciting Updates

A slightly revised version of Jesse’s May 2009 Dalhousie University Commencement Address, Son et lumiere, is published on 23 November 2009 by the monthly science magazine, SEED, as Broadening the Scope of Global Change to Include Illumination and Noise.

The essay’s recommendation for consideration of an International Quiet Ocean Experiment earns coverage by Mike Seccombe in the Martha’s Vineyard Gazette in a 27 November 2009 article, Quiet please, across the seas: Pause ships to hear the fish.

Identifying ocean’s racehorses with DNA

frozen-tunaBluefin tuna are enormous (up to 15 ft/4.5 m, 680 kg/1500 lbs), high-speed (up to 54 km/h, as fast as racehorses) creatures that roam across oceans and return to ancestral waters to spawn. High demand has fueled intensive fishing by international fleets, resulting in 90% population declines heading towards extinction for all three species, Southern (Thunnus maccoyii), Northern (T. thynnus), and Pacific bluefin (T. orientalis). This week in PLoS ONE researchers from the American Museum of Natural History describe DNA-based identification of bluefin and other tuna species using character analysis of COI barcode sequences. Lowenstein and colleagues’ report provides a basis for routine identification of marketplace items to inform consumers and enable enforcement of regulations, including a proposed listing as endangered under Convention of International Trade in Endangered Species (CITES).

bluefi1The eight species in genus Thunnus are not discriminated by regularly used nuclear loci and differ by about 1% or less in mitochondrial coding regions (e.g., Ward et al 2005 Phil Trans R Soc B), challenging DNA-based identification. To construct a diagnostic key, Lowenstein and colleagues analyzed 89 COI sequences in GenBank representing the eight tuna species and by visual inspection found 14 sites that provided 17 “compound characteristic attributes (CAs)” (terminology from Sarkar et al 2008 Mol Ecol Res). Turning marketplace detectives, the AMNH team collected 68 sushi samples from 31 establishments in New York and Denver over 6 month period in 2008. Nearly one-third (22; 32%) of samples were sold as species contradicted by the molecular data, including items from over half (19; 61%) of the restaurants.

Lowenstein found their character-based identifications were more accurate and precise than those provided by BOLD ID engine (www.barcodinglife.org), largely reflecting that the ID engine uses a 2% cutoff for assigning specimens to species, which encompasses all eight Thunnus sp.  In addition, BOLD is a workbench for researchers and so contains many as yet unpublished sequences from ongoing studies; these need to be viewed as provisional data. Indeed, in constructing their key Lowenstein and colleagues set aside 2 of the 89 GenBank tuna sequences as these grouped with other species. These anomalous sequences might reflect hybridization or introgression which is reported to occur in 2-3% of Atlantic bluefin, for example (Viñas and Tudela 2009 PLoS ONE). In this study, researchers from Universitat de Girona, Spain and World Wildlife Fund describe a DNA-based method for distinguishing tuna species using mitochondrial control region and nuclear ITS. Here again the method is validated using published data, in this case 42 GenBank records representing the 8 species.  As an aside, I find it remarkable there are so few records that might enable identification of such commercially-important and now endangered species. These two studies establish a scientific and possible legal standard for tuna identification. Now we begin.

Tracking disease vectors with DNA

mosquitofedWhat hosts sustain arthropod disease vectors when they are not biting humans? In September 2009 PLoS ONE, researchers from Doñana Research Station, Seville, Spain, report on a “universal DNA barcoding method to identify vertebrate hosts from arthropod bloodmeals.” The investigators collected “wildlife engorged mosquitoes, culicoids [biting midges] and sand flies (Phlebotomiae)…using CDC traps supplied with dry ice to attract ectoparasites through light and CO2.”

To design vertebrate-specific primers that would not amplify the more abundant arthropod DNA, Alcaide and colleagues “downloaded all vertebrate COI sequences (N = 18,2980 from the Classes Mammalia, Aves, Amphibia, and Reptilia that were available in the public domain managed by BOLD Systems database in January 2009” and compared these to “6,784 arthropod COI sequences from taxonomic groups that included blood-feeding species.” From this comparison they designed degenerate (multiple nucleotides at some positions) primers that were >99% matched to vertebrate target sequences and >99% mismatched to invertebrate targets. It would be helpful in this and other studies if the description of new primer(s) gave the position of the 3′ end of each primer as compared to mouse mitochondrial COI for instance. This would make it clear which portion of the COI barcode region is being amplified.

The first pass test with these primers gave PCR products in 43 of 100 mosquito bloodmeals, and reamplification with a slightly different primer set yielded sequenceable products in 97 of 100 cases; this re-amplification protocol was applied to the other vector species with “satisfactory” results. All except 5 matched at >99% level to vertebrate sequences from museum voucher specimens. For 3 of the uncertain identity sequences, they used the closest BOLD matches and knowledge of local fauna to “deduce that these species could be the Iberian hare Lepus granatensis, the red-legged partridge Alectoris rufa and the Egyptian mongoose Herpestes ichneumon.” The other two without close matches were from ticks collected while still feeding so the hosts were known. By my count they detected 18 mammalian and 26 avian host species in arthropod bloodmeals; to me this is remarkable variety given the relatively small number of bloodmeals tested. I look forward to learning more through DNA tracking of biting arthropods.

Tropical tree identification with DNA

2frenchguianacanopy-405002-swTwo groups of researchers explore tropical forest plots with DNA barcodes in October 2009 PLoS ONE and Proc Natl Acad Sci USA (both open access, the latter Twittered!). It is just three months ago a community standard for DNA barcoding land plants was announced, namely the plastid genes rbcL and matK, with species-level identification in 72% of cases tested and identification to “species groups” in the remainder. The two papers mentioned above represent the early roll-out so we can expect much more will be learned about DNA barcoding in plants in particular and about plant biology in general.

In PLoS ONE, researchers from France, French Guiana, and New York apply DNA barcoding to two 1-hectare plots in the “pristine lowland tropical rainforest” of central French Guiana, which represents one of the largest tracts of intact Amazonian rainforest. Working out of the Nouragues Research Station (“gateway to European rainforest”) Gonzales and colleagues collected leaf and cambium (living outer layer of wood) samples from all trees 10 cm or greater in diameter, with the assistance of professional tree climbers for large trees and use of climbing spikes for smaller specimens. The extreme efforts required to collect morphologically-identifiable specimens highlights the desirability of a DNA-based approach that could be applied nearer to ground level! A total of 1073 trees were sampled, which were sorted into 301 morphospecies; of these, 254 (85%) were “matched to a reference voucher with an acceptable species name…[encompassing] 143 genera and 54 angiosperm families, so that is a lot of tree diversity! For comparison there about 1000 native tree species in all of North America. PCR was carried out for multiple loci: in addition to above-mentioned standards rbcL and matK, these included plastid genes rpoC1, rpoB, and ycf5, non-coding trnL and psb-trnH, and nuclear ITS. The researchers also applied DNA barcoding to “juveniles” i.e. saplings in the same plots, of which just 27% could be identified to species, plus another 45% to morphotype, and 11% to genus (this leaves 17% not identified to genus). Not surprisingly given the diversity of species, sample types, markers, and uncertainties in the underlying taxonomy, the researchers’ results are complex. Regarding tissue types, they obtained amplifiable DNA from most or all leaf and cambium samples, with high success for some markers (e.g., rbcL sequencing rate 93%), supporting ground-level sampling strategies. Regarding markers, they had difficulty amplifying matK (68% success) and ITS (41%). Similar to prior observations, the overall rate for species-level identification using plastid markers plateaued at about 70%, thus two loci capture most of what is available from this genetic compartment.

In Proc Natl Acad Sci USA, researchers from Smithsonian Institution, Smithsonian Tropical Research Institute (STRI), Imperial College, and Harvard University apply DNA barcoding with rbcLmatK, and trnH-psbA to 1035 tree samples representing 296 species in STRI’s 1,000 x 500 m Forest Dynamics Plot on Barro Colorado Island, Panama. They had similar sequencing success to Guiana study (rbcL, 93%; trnH-psbA, 94%; matK, 69%). Overall success at species-level identification was 92% for rbcL + matK; 95% for rbcL + trnH-psbA, and 98% for all three markers, with the denominator in these comparisons apparently being #samples with available sequences. I am uncertain as to why species-level identification was higher in Panama as compared to Guiana study;  the total number of samples and species is similar so presumably this reflects particular aspects of the species composition such as recent radiations in these locations. Kress and colleagues constructed a supermatrix with this data, generating a “robust community phylogeny for 281 of the 296 species in the plot.” They conclude “DNA barcodes stand poised to serve as an efficient and effective approach to building community phylogenies…[aiding] understanding niche conservation and the dynamics of species composition at landscape and global scales.” Sounds promising!