What Lies Beneath An interview with Jesse Ausubel about the Census of Marine Life for Imagine magazine, Volume 18, Number 3, pp.18-21. Published by The Johns Hopkins University Center for Talented Youth.
News
Breath tests for DNA
In August 2010 PLoS ONE, researchers from University of Queensland, Georgetown University, and National Aquarium look at feasibility of genotyping cetaceans (whales, dolphins, and porpoises) by sampling blow, the exhalations from blowholes. The standard method for collecting cetacean DNA, dart biopsying, is considered inappropriate in some settings, particularly for young animals. Blow sampling has been used to assess disease in free-ranging cetaceans (Acevedo-Whitehouse et al Anim Cons 2009).
In the PLoS ONE report, Frère and colleagues studied six bottlenose dolphins (Tursiops truncatus) housed at the National Aquarium from which they were able to collect both blood and blow samples. Blow sampling involved holding a 50 mL polypropylene tube inverted over the blowhole of “dolphins trained to exhale on cue.” Tubes were placed on dry ice for transport to the laboratory, where the presumably adherent blow material was resuspended in 500 ?L of TE buffer (this worked better than ethanol), and centrifuged at 3000 rpm for 3 min. Excess TE was removed, and DNA was extracted using a Qiagen DNeasy Blood and Tissue Kit. For all six individuals, mitochondrial and microsatellite DNA profiles from blow matched those from blood. The researchers applied this approach to a wild population of bottlenose dolphins in the eastern gulf of Shark Bay, Australia, using “a modified embroidery hoop with sterile filter paper stretched over its centre,” with successful recovery of mitochondrial DNA from one individual so far. 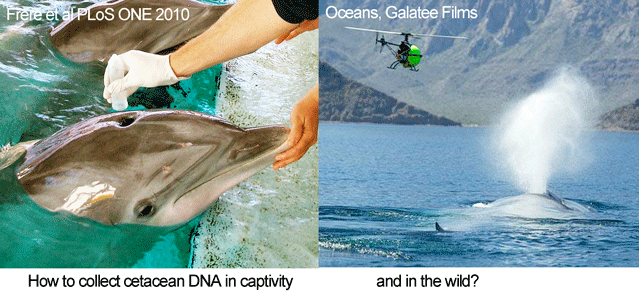
Looking ahead, small, remote-controlled devices might be used for sampling, as were employed in filming cetaceans in Oceans. There may also be applications of DNA breath-testing in 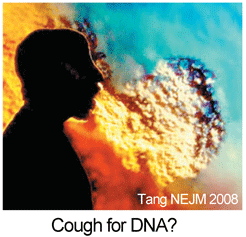 land animals (see Schlieren image of extensive turbulent flow following a cough). More generally, the increasing sensitivity of DNA techniques opens a dizzying array of possibilities for DNA-based identification. For example, forensic laboratories now routinely employ “touch DNA” methods sensitive enough to detect the tiny number of cells that are routinely shed when we touch objects, and the presence of amphibians in a pond can be determined by DNA testing a 15 mL water sample (Ficetola Biol Lett 2008).
Expanding access to DNA secrets
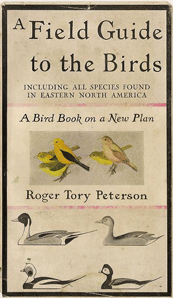 When Roger Tory Peterson’s “A Field Guide to the Birds” was published in 1934, it opened the door to a multitude of persons being able to identify birds, helped create small industry of birding guides and optics, and was a driving force in the much larger social transformation in awareness of the natural world and human impact. I see the library of DNA barcodes as a (near) universal field guide to the immense diversity of multicellular life, with similar potential for large scientific and societal benefits. Of course the library is not complete (so far, >1 M records, >92 K species), but enough work has been done in diverse taxonomic groups to be confident that a library of standardized, short DNA sequences linked to named, vouchered specimens (i.e. DNA barcodes) will enable species-level identification of most multicellular animals and narrow identification to one or few plant species.
So far, it is mostly only scientists who have direct access to DNA secrets. A future in which non-professionals analyze DNA is creeping closer. You can mail a cheek swab to a DNA lab to reconstruct your personal ancestral genealogy ($150) or check paternity ($400). Whole genome sequencing is available too, but to my reading this is too expensive for now ($20,000) and the results and interpretation are not generally useful. Kits for DNA analysis are already in use in high school classrooms and, closer to home, educational DNA barcoding looks to be around the corner. In December 20, 2010, Bio-Rad Laboratories, a scientific supply company, announced a partnership with Coastal Marine BioLabs (CMB) to develop “DNA barcoding instructional activities for classrooms.” CMB has been active in engaging high school students in generating and submitting reference data to the BOLD database. I expect the potential market for DNA barcoding kits in education is large.
Cool new barcode app
The US Global Positioning System (GPS), consisting of 24 to 32 satellites in medium earth orbit, cost $32 billion to develop and is supported by an annual budget of $1 billion. When the high resolution GPS signal was first made available to the public in May 2000 by President Bill Clinton, I imagine that few persons anticipated how useful it would be. Ten years later there are numerous, diverse applications, ranging from a smartphone app for finding the nearest post office in Australia to tracking animals across the Pacific. Like GPS, the Barcode of Life Database (BOLD) is a public, large-scale technology infrastructure resource. Similar to the trajectory with GPS, I expect that over the next 10 years BOLD will enable an expanding array of applications useful for students, consumers, commercial entities, regulators, researchers, and probably some just for fun.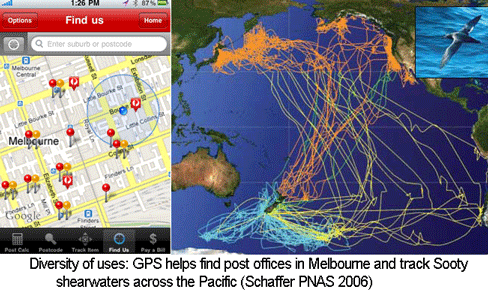
In November 2010 Molecular Ecology (request pdf from author) researchers from University of Guelph, Canada and Institut National de la Recherche Agronomique, France report on “molecular analysis of parasitoid linkages (MAPL)”. As background, parasitoid insects–many or most are wasps (order Hymenoptera)–lay eggs in the larvae of other insects, primarily Lepidoptera (butterflies and moths) and Diptera (flies). Host mortality may exceed 90%, and many parasitoids serve as useful biocontrol agents for agricultural pests. Parasitoid wasps are generally tiny and hard to distinguish morphologically, and identifying hosts may take years of patient observation. Recent molecular data show unexpected diversity and host specificity, i.e. many parasitoid species thought to be generalists are in fact comprised of multiple distinct lineages each limited to a single host.
In this study, Rougerie and colleagues looked at whether it was possible to identify the hosts by looking for leftover DNA in the abdomen of adult wasps. As an aside, the general approach in building up the barcode reference library for animals is to use broad-range primers that amplify COI from a wide taxonomic array of specimens. Now that parts of the library are established, it is possible to make use of the accumulated data to design primers that amplify specific taxonomic groups. Such taxon-restricted primers can help address interesting questions. In this study, researchers utilized two sets of primers, one set (primarily LepF1/LepR1) that amplified COI from the wasps and one set (LepF1/MLepR1) with a reverse primer that was specific to the potential hosts, namely Diptera and Lepidoptera. The first set successfully amplified COI from single legs of 297 adult wasp specimens thought to comprise more than 90 species and 20 genera. Using the same DNA extracts, the host-specific primers yielded PCR products from only 9 (3%) of these specimens, demonstrating good selectivity. Rougerie and colleagues then prepared DNA extracts from the abdominal segment of 3 species of hand-reared wasps (so that the host species were known), collected immediately after emergence. 29 (24%) of 120 specimens yielded readable PCR products, of which all except one matched to the known lepidopteran host species. The authors conclude that “MAPL has immediate applications in the agricultural sciences by facilitating selection of biological control agents” and that it “will drastically accelerate the registration of host-parasitoid associations and that the development of similar approaches for other orders of insects with complete metamorphosis will be equally productive.” I look forward to these new apps!
Census of Marine Life in Santiago, Chile
Jesse gave a talk on the Census of Marine Life in Santiago, Chile. You can watch the video from November 2010 here.
How to make an indentification machine
Successful automation often involves machines that carry out tasks differently than persons. For example, a Coulter counter (developed by Wallace H. Coulter, an American engineer), analyzes blood cells by electrical charge, producing a detailed report of red and white cell types faster and more cheaply than does a technician examining a blood smear under a light microscope. As another case, machine identification of commercial products is enabled by a UPC bar code, which represents a product name in a digital format that can be “read” almost instantaneously by a laser scanner. In a similar way, DNA barcoding “reads” the digital code of DNA, associating that with species names in a reference database, opening the door to fully or partly automated identifications. In 9 September 2010 Nature, scientists from London Natural History Museum, Louisiana State University, and University of Plymouth, UK, propose a different route to automate taxonomic identification, namely, teaching computers to do morphologic pattern recognition. Now that we are on the threshold of “anyone, anywhere, anything” identification with DNA barcoding, this seems a step backward.
I see three major challenges that limit any morphology-based identification system: naming an organism from bits and pieces, recognizing look alikes and life stages, and the diversity of diagnostic features requiring specialized equipment. On the other hand, DNA is the same whether from an intact specimen or an unrecognizable stomach fragment, readily distinguishes look alikes in any life stage, and can be analyzed using the same equipment regardless of specimen. More generally, at the end of the day, little scientific insight will have been gained from a system that distinguishes life forms by the multitidinous particulars of appearance, whereas a library of DNA barcodes linked to named specimens offers a broad view of species-level differences across the diversity of life.
According to MacLeod and colleagues, “a [DNA] bar code isn’t useful until the reference species has been identified by experts”. This makes no sense to me. All large barcode surveys of animals, from ants to fish, have revealed hidden genetic divergences, in many cases leading to recognition of new species. In fact, DNA barcoding is fast way of screening existing collections for unrecognized species. In this same section, as part of discounting a DNA approach, they state “researchers frequently need to identify non-living objects as well as living ones”. I don’t understand how this is an objection, since, for example, DNA barcodes from ancient bone fragments have been used to define species of extinct flightless Moa (Lambert et al J Heredity 2005).
I know from iPhoto’s remarkable ability to recognize individuals that computers are getting better at pattern recognition. Further development focused on taxonomic specimens may lead to useful tools. However, this seems unlikely to lead to a widely applicable automated system. In a study cited by the authors, phytoplankton identifications by 16 marine ecologists were compared to those with DiCANN, a machine learning system (Culverhouse et al Marine Ecol Prog Series 2003). The authors of that study conclude what is likely to be generally true about morphology based identification: “In general, neither human nor machine can be expected to give highly accurate or repeatable labeling of specimens”.
One biodiversity database to the next
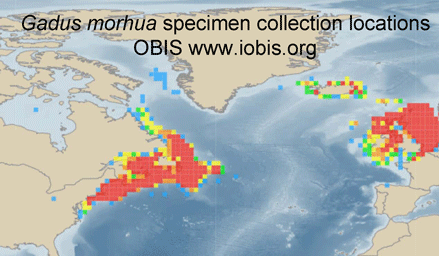
 Jumping between biodiversity databases is getting easier. For example, typing in “Atlantic cod” at Ocean Biogeographic Information System (OBIS) takes you to a Gadus morhua species page summarizing 616,444 records, a zoomable map of its geographic range based on specimen collection locations, and direct links to G. morhua pages in other databases, including, for example, Barcode of Life (BOLD), Encyclopedia of Life (EOL), Catalog of Life, World Register of Marine Species (WorMS), and Google images, among others. Having all that, inspired by Matt Damon’s character in The Bourne Ultimatum, we want to take more leaps–perhaps to G. morhua pages in Arkive, Biodiversity Heritage Library, FishBase, and/or GenBank?
Something new is having links to Encylopedia of Life species pages embedded in research articles (so far in some papers in PLoS ONE; for an example, see shark names in Ward-Paige et al 2010 PLoS ONE). Having direct links to literature sources is a wonderful enhancement of research articles, and I believe that species name links will be equally valuable, particularly for biodiversity literature, so I hope this catches on. Species name links have potential to increase the audience and impact of research papers, since many otherwise interested persons will not recognize scientific names or will be entirely unfamiliar with the organisms being studied.
Dinochelus ausubeli
CoML – 10 Years!
15 years after conception by Jesse Ausubel and Fred Grassle, the
scientific community presented the First Census of Marine Life 4
October in London. For an overview of the newly released materials
visit the CoML portal or the site of the news
release. Jesse served as
leader editor of the Highlights report.
For a more personal view of the program, read Jesse’s
poem,
The Census of Marine Life is about the total
richness of the sea,
which serves as the foreword to
the new book, Life in the World’s Oceans: Diversity,
Distribution, and Abundance, A. McIntyre (ed.), Wiley-Blackwell, 2010.
For a view of Jesse’s early vision of the program,
see JH Ausubel. The census of marine life: Progress and prospects. Fisheries 26(7): 33-36, 2001
and JH Ausubel. Toward a Census of Marine Life. Oceanography 12(3): 4-5, 1999
The achievements of the community are extraordinary.
The books by
Paul Snelgrove,
Alasdair McIntyre,
Nancy Knowlton
and the National Geographic map reporting the Census are printed.
So, is the 64-page Highlights report, and its 1600-word summary
translated into 10 languages. The greatly enhanced OBIS portal is up and now contains what/where
records for over 120,000 species. The valid names in the
Register of Marine Species now exceed 200,000.
The Encyclopedia of Life has pages with vetted content for more than
90,000 species and you can make EOL an Encyclopedia of
Marine Life simply by going to its Preferences
tab and highlighting “cmarine species” in the content
settings / browse classification box. Marine barcoders have DNA
identifiers for about 35,000 species. Scores of papers are appearing
in the PLoS CoML
Collections
and almost all these papers will shortly have embedded links from
species names to the relevant species page in the Encyclopedia of
Life. The overview paper for the NRIC collection in
PLoS One
has already been viewed more than 5,300 times.
Galatee’s Oceans film is an incomparable emblem for marine life,
and has so far grossed more than $80 million globally, and thus ranks
as the 4th most successful documentary of all time.
The performance stems from great ideas and determined implementation.
Every one of the 14 field projects flourished, as well as the History
and Futures projects and OBIS . The National and Regional
Implementation Committees performed superb studies and rooted the
Census in many more locales. The Education and Outreach Team, Mapping
and Visualization Team, and Synthesis Group multiplied the value of
everyone else\u2019s work. The Scientific Steering Committee and
Secretariat managed an effort of enormous complexity with endless
energy, wisdom, and focus.
The Census has far exceeded our expectations. It has gratified both
through accomplishment of tasks we anticipated and wonderful
surprises.
Ground beetles join in
 On September 25, 2010, BOLD passed 1 M barcode records, and the International Barcode of Life ( iBOL) was officially launched in Toronto, Canada, with a goal of 5 M records representing 500 K species in 5 years, the largest biodiversity genomics project to date. In terms of DNA sequencing, the iBOL targets (5 x 10⁶ barcodes x 650 bp/barcode = 3.3 x 10⁹ bp) are equivalent to the Human Genome Project (human genome = 3.4 x 10⁹ bp). However, whereas HGP involved sequencing DNA samples from a few individuals, the DNA barcode library is built by thousands of scientists examining thousands of individual specimens, one by one. So a big challenge is obtaining, identifying, tracking, processing, and preserving millions of specimens.
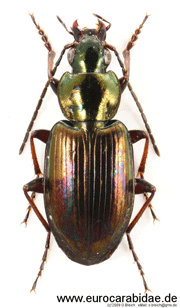 What are recent arrivals to library? For one example, in current Frontiers Zool, researchers from Germany and US (I am co-author) report on DNA identification of Central European ground beetles (family Carabidae). This family comprises “no less than an estimated 40,000 described species that inhabit all terrestrial habitat types from the sub-arctic to wet tropical regions,” making identifications a challenge for taxonomists and non-specialists alike. Raupach and colleagues successfully amplified and sequenced COI barcodes and nuclear ribosomal DNA expansion segments D3, V4, and V7, from 344 specimens representing 75 species in 28 genera (average 4 specimens/species, range 2-13). Most specimens were preserved in 96% alcohol for 1-2 years; some were stored as dry pinned specimens for up to 12 years. 73 (97%) species were resolved by COI, whereas the 3 nuclear markers individually resolved a smaller proportion, 81% (D3), 57% (V4) and 87% (V7), and combining the 3 nuclear markers gave 95% discrimination. The one species pair with shared COI haplotypes also showed identical nuclear markers. Two species exhibited distinct COI clusters (intra-specific p-distances 2.7%, 3.8%), 1 of which also had distinct nuclear haplotypes.
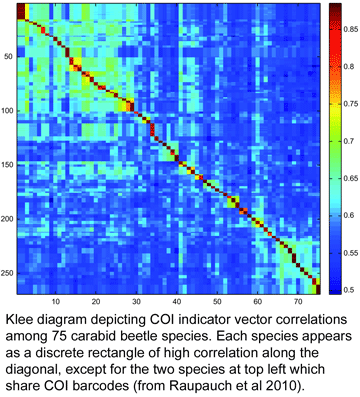 To my knowledge, this is the first taxonomic paper with a “Klee diagram” depicting indicator vector correlations among COI barcode sequences. As developed by mathematician Larry Sirovich and his colleague Yu Zhang (Sirovich et al PloS ONE 2010), indicator vectors are digital representations of DNA sequences that “preserve diagnostic character probabilities, enable automated classification of test sequences, and generate high-information density single-page displays” such as Klee diagram shown here. According to BOLD Taxonomy Browser, there are DNA barcodes for 495 carabid beetle species so far, so I look forward more of the remaining 39,505 or so species joining the barcode library, and dream of a comprehensive indicator vector/Klee analysis of ground beetle family.
In closing, professional and non-professional insect specialists alike may may enjoy recently released film “Beetle Queen Conquers Tokyo” by Jessica Oreck, a lyrical look at beetle and insect fanciers in Japan.
