DNA reveals panoply of tiny fish

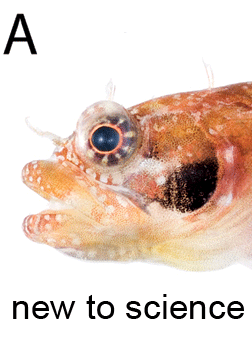
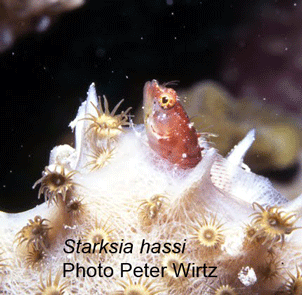
Starksia is a genus of tiny (most less than 2 cm) blennoid fishes found in rocky inshore areas and coral reefs along the Atlantic and Pacific coasts of North and South America and the Caribbean. In 11 February 2011 ZooKeys (open access) researchers from Smithsonian Institution, Ocean Science Foundation, and Nova Southeastern University describe 7 new western Atlantic Starksia species which they first discovered through DNA barcoding.

DNA barcoding revealed divergent clusters within four previously described species and careful re-inspection revealed morphologic characters associated with each genetic cluster.  It is interesting that many of the distinguishing characters are around the head, which may fit with fact that these fish often spend their time largely hidden with only the head exposed. The ZooKeys article is about 51 pages, or about 7 pages per new species, which I think is about average for a species description. If there were a similar printed key for all fishes (about 25,000 named species so far) that would be 175,000 pages long, which is one reason that methods for non-specialists are needed! Of course keys can be posted on the web, as this is, but it is still a challenge to find the right key, especially if you don’t already have a good idea of what you are looking at.

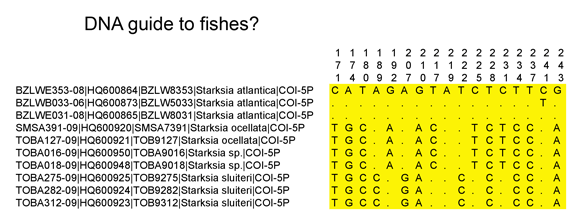
I was surprised that the key did not include barcode sequences of the holotypes (primary specimen chosen to represent the species) (of course these are in GenBank). Even better might be a table of the diagnostic barcode differences among these species, a molecular key.  To try this out, I downloaded the Starksia sequences from Public Projects section of BOLD www.barcodinglife.org, opened in MEGA (free sequence analysis software available at www.megasoftware.net), highlighted all positions that differed among the set, and exported these to Excel including the position numbers which are shown at the top. An excerpt of the output is shown below.

This sort of display could be useful including in a legal setting when you need to document the basis for identification by barcode. The NJ tree gives the right answer of course but it is an abstract representation of the data. A table such as above would show the actual nucleotide sequence differences which are used to generate the tree.

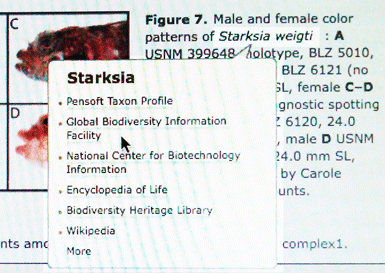
Addendum: I meant to include this very neat feature reading the ZooKeys article online, which is a menu of links that appears if you place your cursor over any species name!

Mao and Deforestation

From the 10 February 2011 New York Review of Books, p. 27, essay by Roderick MacFarquhar on Mao’s Great Famine: The History of China’s Most Devastating Catastrophe, 1958-1962 by Frank Dikötter, Walker, 2010:
“Dikötter’s accounts of the tornado of destruction that the GLF [Great Leap Forward] unleashed continue with … the environment, including the decimation of forests to provide fuel for the backyard furnaces and for homes and construction. As he remarks: The damage varied from place to place, and even in the archives statistics are political artefacts rather than objective reflections of reality. What is certain is that never before had such a large diversity of forests, from the bamboo groves in the south to the alpine meadows and boreal stands of fir and pine in the north, suffered such a prolonged and intense attack.

Mexico barcode surprises

In December 2010 Mitochondrial DNA special issue (open access!) devoted to the Mexican Barcode of Life Initiative (MexBOL), Mexican scientists and colleagues report on barcoding explorations of their megadiverse fauna and flora. A few highlights:

Martínez-Salazar and León-Règagnon from University of Guelph and Universidad Nacional Autónoma de México respectively, examined two morphospecies of Langeronia lung flukes that parasitize Mexican frogs, finding three deeply divergent clusters (approximately 8% uncorrected sequence divergence among specimens from the different regions and 0.3% within). Surprisingly, these clusters were observed in both morphospecies (and did not differ among host species). Based on their results, the researchers conclude that the morphospecies are conspecific, perhaps representing alternative developmental pathways, but it may also be that there are species-level biological differences among the clades not yet recognized. Of note, the 368 bp COI fragment analyzed only partly overlaps the standard barcode region; primers effective for Trematodes are needed.

Cervantes and colleagues (same institutions as above) demonstrated that Common Opposum (Didelphis marsupialis) and Virginia Opposum (D. virginiana), which are sympatric (live in the same area) in Mexico, are readily distinguished by COI barcode (average K2P distances between species are approximately 8%, and within are 1.5%). These species have diagnostic skull morphology but external characters are unreliable, making field identification inaccurate and even museum specimens can be misidentified, including 4 museum specimens in this study.

Zaldívar-Riverón and colleagues from Mexico, Canada, and Argentina applied DNA barcoding to braconid wasps collected during three field trips during 2009 in the Chamela-Cuixmala biosphere reserve, near the Pacific coast. Braconidae is an extraordinarily rich (50,000 -150,000 species) family of tiny parasitoid wasps that attack butterfly larvae, with many species exquisitely specialized to a single host. The researchers obtained barcode sequences from 407 of 483 specimens, and applied computer software (Yule coalescent model) to estimate how many species were present, which turned out to be 185! I’m guessing they sorted specimens to select different morphospecies before sequencing, as it seems improbable that there could be 185 different species among 407 randomly-collected specimens. In this short report, the researchers did not comment on how many of the “barcode coalescent species” correspond to known wasp species. The rate of species discovery did not plateau over the course of the study, pointing to many, many more braconid wasps in just this one area.

At the beginning of the barcode initiative, there was worry from some taxonomists that it wouldn’t work. After 8 years, we know now that a comprehensive library built around taxonomic reference specimens unambiguously names 95% of animal species from mayflies to mammals, and resolves the remainder into small sets of closely-related species. Looking ahead, it seems obvious that one or another analytic approach, such as coalescent modeling described above, will enable construction of a provisional species and higher-level taxonomy from barcode data alone which will be particularly useful for impossibly diverse or poorly-studied groups, such as nematodes. Experts will improve this draft taxonomy as other information becomes available.

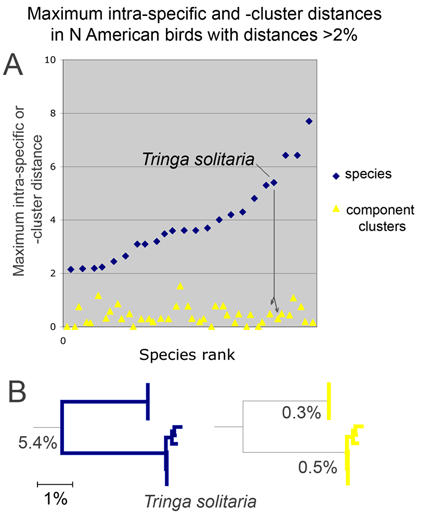
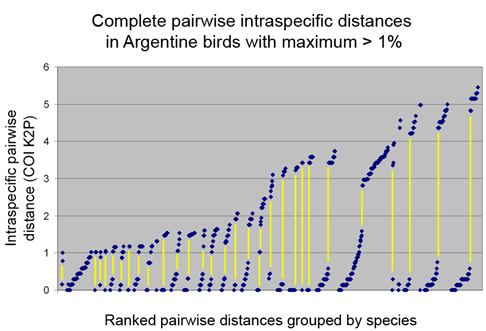
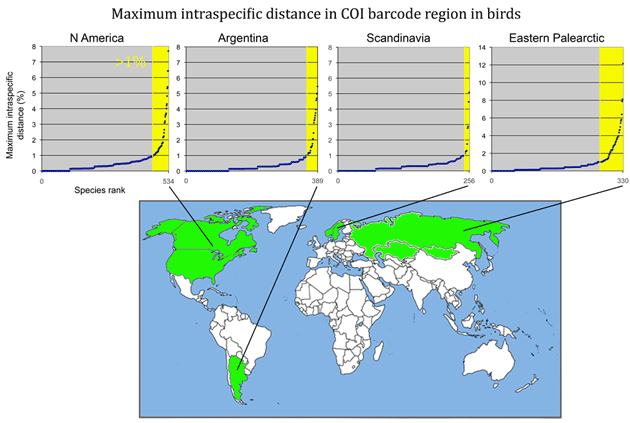
I have long thought that the biggest scientific challenge raised by DNA barcoding is not that it doesn’t work to distinguish some closely-related species, but that it works too well–it reveals biodiversity is much more finely divided and highly-specialized than we knew. Even in birds, the best studied large taxonomic group, a comprehensive DNA barcoding survey demonstrated that 24% of bird species that live in Europe and North America are comprised of isolated populations that have been diverging for more than a million years, likely representing distinct species (Johnson J Ornithol 2010; open access). To my mind, the big picture results so far are an exciting provocation–we need to better understand specialization–how do organisms navigate their environment—for example what signals (chemical, behavioral, acoustic, electric, visual?) enable a wasp to find and distinguish one butterfly larvae from another, or to determine whether the larva is already parasitized? Animals can be viewed as highly-discriminating and sensitive detectors of other life forms. A genetic approach might identify parts of the nervous system or sensory system that enable these feats. With better understanding we might construct highly-specific biosensors, say to detect pathogens.

Addendum: Correcting my supposition about whether specimens were sorted prior to barcoding, Dan Janzen tells me that high species counts are the norm when collecting braconid wasps in tropical sites, such that 185 braconid wasp species from 483 specimens is not unusual.

What Lies Beneath

What Lies Beneath An interview with Jesse Ausubel about the Census of Marine Life for Imagine magazine, Volume 18, Number 3, pp.18-21.  Published by The Johns Hopkins University Center for Talented Youth.

Breath tests for DNA

In August 2010 PLoS ONE, researchers from University of Queensland, Georgetown University, and National Aquarium look at feasibility of genotyping cetaceans (whales, dolphins, and porpoises) by sampling blow, the exhalations from blowholes. The standard method for collecting cetacean DNA, dart biopsying, is considered inappropriate in some settings, particularly for young animals. Blow sampling has been used to assess disease in free-ranging cetaceans (Acevedo-Whitehouse et al Anim Cons 2009).

In the PLoS ONE report, Frère and colleagues studied six bottlenose dolphins (Tursiops truncatus) housed at the National Aquarium from which they were able to collect both blood and blow samples. Blow sampling involved holding a 50 mL polypropylene tube inverted over the blowhole of “dolphins trained to exhale on cue.”  Tubes were placed on dry ice for transport to the laboratory, where the presumably adherent blow material was resuspended in 500 ?L of TE buffer (this worked better than ethanol), and centrifuged at 3000 rpm for 3 min. Excess TE was removed, and DNA was extracted using a Qiagen DNeasy Blood and Tissue Kit. For all six individuals, mitochondrial and microsatellite DNA profiles from blow matched those from blood. The researchers applied this approach to a wild population of bottlenose dolphins in the eastern gulf of Shark Bay, Australia, using “a modified embroidery hoop with sterile filter paper stretched over its centre,” with successful recovery of mitochondrial DNA from one individual so far.

Looking ahead, small, remote-controlled devices might be used for sampling, as were employed in filming cetaceans in Oceans. There may also be applications of DNA breath-testing in land animals (see Schlieren image of extensive turbulent flow following a cough). More generally, the increasing sensitivity of DNA techniques opens a dizzying array of possibilities for DNA-based identification. For example, forensic laboratories now routinely employ “touch DNA” methods sensitive enough to detect the tiny number of cells that are routinely shed when we touch objects, and the presence of amphibians in a pond can be determined by DNA testing a 15 mL water sample (Ficetola Biol Lett 2008).

Expanding access to DNA secrets

When Roger Tory Peterson’s “A Field Guide to the Birds” was published in 1934, it opened the door to a multitude of persons being able to identify birds, helped create small industry of birding guides and optics, and was a driving force in the much larger social transformation in awareness of the natural world and human impact. I see the library of DNA barcodes as a (near) universal field guide to the immense diversity of multicellular life, with similar potential for large scientific and societal benefits. Of course the library is not complete (so far, >1 M records, >92 K species), but enough work has been done in diverse taxonomic groups to be confident that a library of standardized, short DNA sequences linked to named, vouchered specimens (i.e. DNA barcodes) will enable species-level identification of most multicellular animals and narrow identification to one or few plant species.

So far, it is mostly only scientists who have direct access to DNA secrets. A future in which non-professionals analyze DNA is creeping closer. You can mail a cheek swab to a DNA lab to reconstruct your personal ancestral genealogy ($150) or check paternity ($400). Whole genome sequencing is available too, but to my reading this is too expensive for now ($20,000) and the results and interpretation are not generally useful. Kits for DNA analysis are already in use in high school classrooms and, closer to home, educational DNA barcoding looks to be around the corner. In December 20, 2010, Bio-Rad Laboratories, a scientific supply company, announced a partnership with Coastal Marine BioLabs (CMB) to develop “DNA barcoding instructional activities for classrooms.” CMB has been active in engaging high school students in generating and submitting reference data to the BOLD database. I expect the potential market for DNA barcoding kits in education is large.

Cool new barcode app

The US Global Positioning System (GPS), consisting of 24 to 32 satellites in medium earth orbit, cost $32 billion to develop and is supported by an annual budget of $1 billion. When the high resolution GPS signal was first made available to the public in May 2000 by President Bill Clinton, I imagine that few persons anticipated how useful it would be. Ten years later there are numerous, diverse applications, ranging from a smartphone app for finding the nearest post office in Australia to tracking animals across the Pacific. Like GPS, the Barcode of Life Database (BOLD) is a public, large-scale technology infrastructure resource. Similar to the trajectory with GPS, I expect that over the next 10 years BOLD will enable an expanding array of applications useful for students, consumers, commercial entities, regulators, researchers, and probably some just for fun.

In November 2010 Molecular Ecology (request pdf from author) researchers from University of Guelph, Canada and Institut National de la Recherche Agronomique, France report on “molecular analysis of parasitoid linkages (MAPL)”. As background, parasitoid insects–many or most are wasps (order Hymenoptera)–lay eggs in the larvae of other insects, primarily Lepidoptera (butterflies and moths) and  Diptera (flies). Host mortality may exceed 90%, and many parasitoids serve as useful biocontrol agents for agricultural pests. Parasitoid wasps are generally tiny and hard to distinguish morphologically, and identifying hosts may take years of patient observation. Recent molecular data show unexpected diversity and host specificity, i.e. many parasitoid species thought to be generalists are in fact comprised of multiple distinct lineages each limited to a single host.

In this study, Rougerie and colleagues looked at whether it was possible to identify the hosts by looking for leftover DNA in the abdomen of adult wasps. As an aside, the general approach in building up the barcode reference library for animals is to use broad-range primers that amplify COI from a wide taxonomic array of specimens. Now that parts of the library are established, it is possible to make use of the accumulated data to design primers that amplify specific taxonomic groups. Such taxon-restricted primers can help address interesting questions. In this study, researchers utilized two sets of primers, one set (primarily LepF1/LepR1) that amplified COI from the wasps and one set (LepF1/MLepR1) with a reverse primer that was specific to the potential hosts, namely Diptera and Lepidoptera. The first set successfully amplified COI from single legs of 297 adult wasp specimens thought to comprise more than 90 species and 20 genera. Using the same DNA extracts, the host-specific primers yielded PCR products from only 9 (3%) of these specimens, demonstrating good selectivity. Rougerie and colleagues then prepared DNA extracts from the abdominal segment of 3 species of hand-reared wasps (so that the host species were known), collected immediately after emergence. 29 (24%) of 120 specimens yielded readable PCR products, of which all except one matched to the known lepidopteran host species.  The authors conclude that “MAPL has immediate applications in the agricultural sciences by facilitating selection of biological control agents” and that it “will drastically accelerate the registration of host-parasitoid associations and that the development of similar approaches for other orders of insects with complete metamorphosis will  be equally productive.” I look forward to these new apps!