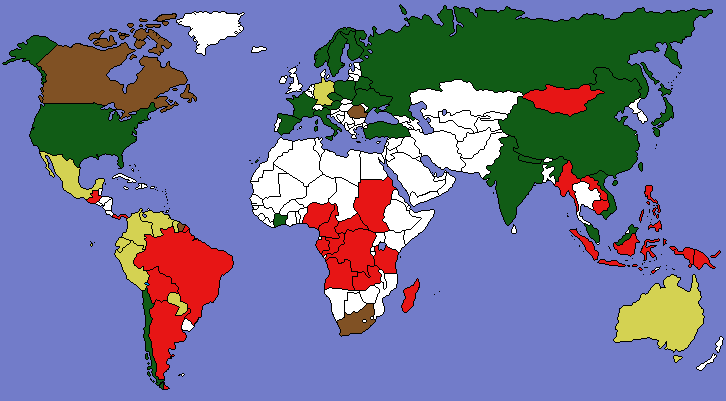
The PNAS has published our new paper “Returning forests analyzed with the forest identity.” We also post a press release about it from the U. of Helsinki and a map showing major countries that are gaining or losing forest. It has been a pleasure over the past year to cooperate with co-authors Pekka Kauppi, Jingyun Fang, Alexander Mather, Roger Sedjo, and Paul Waggoner.
We take this occasion to recall some of our preceding papers on forests:
Foresters and DNA (PDF)
Jesse H. Ausubel, Paul E. Waggoner, and Iddo Wernick
In Williams, C.G., Landscapes, Genomics and Transgenic Forests, pp. 13-29,
Kluwer, Dordrecht, 2006.
Would editing a few bytes of the genetic message for a tree to fit human desires do harm or good? To meet demands of larger populations and changing diets, farmers have used a series of innovations to lift yields and thus reduce the area of land needed to support a person. Since 1950 rising yields have stabilized land for agriculture and now promise a Great Restoration of nature on land spared. Foresters have also lifted yields and could lift them much higher, thus sparing natural forests while meeting demand for wood products, whose growth is anyway slowing. While weak demand, numerous worries, and vague promises will slow penetration of genetically modified trees, any technology that improves spatial efficiency has appeal, and editing DNA could lift yields. Both farmers and foresters must work precisely, using fewer hectares and more bits. Fortunately, foresters have several decades in which to test and monitor their practices before genetically modified trees will diffuse widely.
On Sparing Farmland and Spreading Forest
Jesse H. Ausubel
In Clark, T. and R. Staebler, eds., Forestry at the Great Divide:
Proceedings of the Society of American Foresters 2001 Convention, Society of
American Foresters, Bethesda MD, 2002, pp. 127-138.
How Much Will Feeding More and Wealthier People Encroach on Forests?
Paul E. Waggoner and Jesse H. Ausubel
Population and Development Review 27(2):239-257 (June 2001).
David G. Victor and Jesse H. Ausubel
Foreign Affairs 79(6):127-144, November/December 2000.
The Forester’s Lever: Industrial Ecology and Wood Products
Iddo K. Wernick, Paul E. Waggoner, and Jesse H. Ausubel
Journal of Forestry 98(10):8-13, October 2000.
Searching for Leverage to Conserve Forests: The Industrial Ecology of Wood Products in the U.S.
Iddo K. Wernick, Paul E. Waggoner, and Jesse H. Ausubel
Journal of Industrial Ecology 1(3):125-145, 1997.
The forest and the creatures it shelters exemplify nature, and logging exemplifies the impacts of humans on it. By the early 1990s Americans annually removed 70% more timber from the forest than in 1900. Growing population and affluence far outpaced this rise. Since 1900 U.S. population rose more than three times and gross domestic product (GDP) per person increased almost five. Despite more people, affluence, and timber removals, the area of U.S. forests remained constant over the century. Since mid-century, standing timber volume rose nearly 30%. The practices of consumers, millers, and foresters, responding to style, ethics, technology and the consequent economics, have each contributed to these outcomes . We examine the role of each of these actors in the industrial ecology of forests to reveal their leverage for improving environmental quality. Consumers lessened their intensity of use of wood products (wood products per GDP) during the century by 2.5% annually to substantially offset the expanding population and GDP per person. Sustaining the historic trend will level or lower timber consumption if population and affluence grow at expected rates. Millers became more efficient at getting products out of logs as well as utilizing wood residues and recycled fibers for their material or energy value. Given their already high efficiencies, millers face little opportunity to reduce future harvest of trees. Foresters provide leverage by influencing the environmental impact of logging and the long-term adequacy of timber supplies. By raising productivity they promise to use less forest land to grow and harvest timber. In the future, steady or declining demand for trees coupled to greater forest productivity appear likely to spare more U.S. forest land for sequestering carbon, ecosystem services, and habitat for nature.
 Insiders can be mistaken, in science and in other fields. At the beginning of the Human Genome Project, “the great majority of scientists dismissed the original proposal with hostility or indifference” (
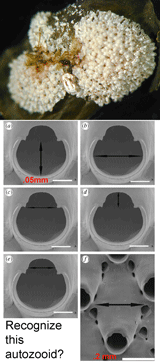
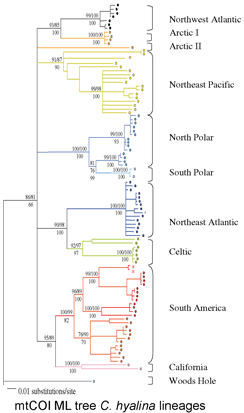
 The Sponge Barcoding Project
 In 1987, the few dozen GPS models available were mostly larger than 200 cu in and cost $15,000 to $45,000. (
 Good news for taxonomic science: