The Winter 2007 issue of IIASA’s Quarterly Options newsletter includes profiles of five alumni, including Jesse, who remains very grateful for his formative experience in Laxenburg 1979-1981.
News
DNA plus database of sounds help reveal new bird species
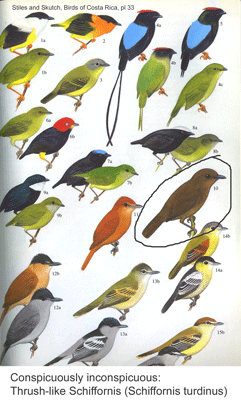 Birds are relatively large, conspicuous, vocal, and mostly diurnal creatures, making it relatively easy for humans to tell apart. Even so, new species continue to be discovered; these usually represent distinct forms within what were thought to be single species. In 27 February 2007 Mol Phylogenetics Evol, Arpad Nyari, University of Kansas, reports on molecular and vocal differentiation in a widespread South American songbird, the Thrush-like Schiffornis Schiffornis turdinus. S. turdinus is a “dull-colored, secretive bird distributed throughout Neotropical humid lowland forests from southeastern Mexico south to northern Bolivia and the Atlantic Forest of southeastern Brazil.” The thirteen recognized subspecies show “subtle differences in plumage hue and intensity, and body size”. How to sort out which forms might represent distinct species?
Nyari analyzed 38 individuals representing 10 of the 13 subspecies, plus 3 congeneric individuals of S. virescens or S. major. 8 of the 41 specimens were from University of Kansas, and the remainder were loaned from 6 museum collections in the US and Brazil, which highlights the distributed nature of avian tissue collections and the benefit of sharing resources. 2475 bp of mtDNA including COI barcode region, ND2, and cytochrome b were sequenced as molecular markers. Vocalizations were downloaded from Macaulay Library of Natural Sounds, Cornell University and spectrographs analyzed with RAVEN bioacoustic software which is provided on the Cornell site. The ability to combine these disparate data sets hints at power of making biological data widely available. Molecular analysis revealed 7 distinct geographically restricted clades, 5 of which had characteristic vocalizations. On this basis, S. turdina is recommended to be split into 5 species. When analyzed separately, the COI barcode region (615 bp) recovered the same 7 clades as the full 2475 bp. As in other studies, the branching order among clades and congenerics was better shown with the larger data set.
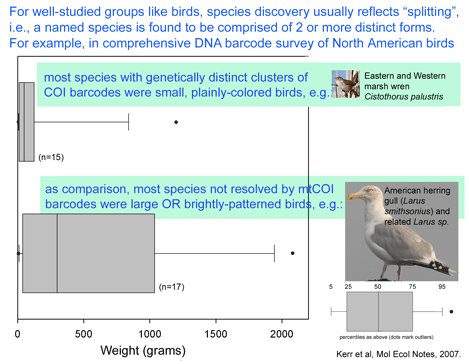
To my reading, this and other studies suggest that large-scale COI barcode screening of avian tissue collections will be a scientifically productive and efficient approach that will speed discovery of new bird species and advance understanding of avian diversity. As in Kerr et al’s recent study of North American birds, it seems likely that many or most of the new bird species awaiting discovery will be found among birds similarly inconspicuous as S. turdinus.
Sylvia CoML Poem
Elated by progress of the Census of Marine Life shared at the Auckland All-Program meeting 14-16 November 2007, we recall and post Sylvia Earle’s delightful poem written in October 2003 for the public launch of the program:
To COML, a worthy endeavor
May all gathered here be honored forever
For daring to count all of the creatures
Their habitats, their range, their various features.
Those in the future will raise their glasses
If we succeed in saving the masses
Of fishes and squids, polychaetes, too
The algae, the microbes, the whole ocean zoo.
A toast to the known, the unknown, the unknowable
We have a good start and the list is growable.
A toast with your choice of liquid potions
To the past, to the future of the living oceans.
POGO
The Census of Marine Life (CoML) has partnered with the Partnership for Observation of the Global Oceans (POGO) to produce a pair of videos, a press release, and a website about improving ocean observing for the GEO Ministerial Summit that will take place this week, 28-29 November 2007 in Cape Town. The POGO video (covering all aspects of ocean observing) and the CoML video (focusing on biological observing) are available in both high and low resolution on the POGO site for the Cape Town Summit. We hope these outreach activities will help create a durable legacy of CoML and its cousin experimental observing programs. We are heartened that Reuters has distributed a news story. Australian Radio did a short interview with Jesse about ocean observing.
DNA helps identify African agricultural pests
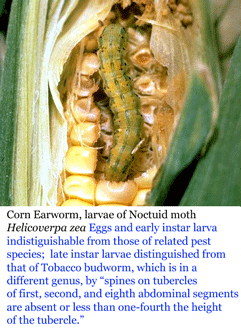 Among the 35,000 known species of noctuid moths, a number are destructive agricultural pests, including for example Corn earworm Helicoverpa zea and Tobacco budworm Heliothis virescens. Accurate identification is the essential first step in pest management, but morphologic identification can be difficult, particularly of eggs and larval forms.
In September 2007 African Entomology, researchers from South Africa, Australia, and France analyze COI mtDNA of Busseola sp. larva in Ethiopian sugarcane. The DNA barcode region of COI was amplified from 7 morphologically-indistinguishable larval specimens using standard invertebrate primers (Folmer et al, Mol Marine Biol Biotech 3:294, 1994). Rearing of the larva was attempted, but none of the collected larva developed to the adult stage. Sequence analysis revealed two distinct clusters that matched sequences derived from adult B. fusca and B. phaia. Assefa and co-authors conclude “DNA-based methods were found to be a quick, easy and reliable method for identification of species…[and] may then be solutions for conditions in Africa where there is an acute shortage of experts and rearing facilities to keep field-collected insects alive until emergence of adults for morphological identification.”
PAX
Our long-standing interest in science and diplomacy bears fruit in the growing use of Asi Burak’s interactive video game Peacemaker, supported by the Richard Lounsbery Foundation. The Peres Center for Peace is distributing 100,000 free copies of the game to people in Israel and the Palestinian territories. Meanwhile, Carnegie-Mellon faculty are using Peacemaker in a social science experiment about behavioral aspects of conflict resolution.
Web initiative aims to help clear name confusion
“The first part of knowledge is getting the names right.” Chinese proverb quoted in Evolution of Insects, Grimaldi and Engel, 2005.
Species names are the primary entrance for accessing biological knowledge about organisms. However, the tangled bank of nomenclature created by 250 years of diverse communities of taxonomic specialists working largely in isolation challenges those seeking knowledge. It can be difficult to know what is already known. Identifying even well-studied organisms in backyards, such as North American ants for example, may require graduate-level training. As taxonomic knowledge moves increasingly onto the web, tools that enable non-specialists and specialists alike to access biological knowledge of organisms are beginning to be developed. In my view, the solution will be a combination of information science tools enabling access to biological literature together with a universal library of standardized genetic sequences, ie DNA barcodes, and simple technologies for barcode sequencing.
An exciting development in taxonomic information science is 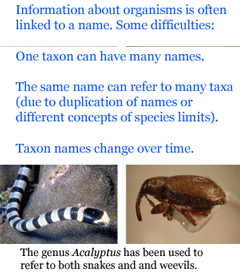 uBio (Universal Biological Indexer and Organizer) www.ubio.org, “an initiative within the science library community to join international efforts to create and utilize a comprehensive and collaborative catalog of known names of all living (and once-living) organisms. The Taxonomic Name Server (10,699,999 NameBank records so far) catalogs names and classifications to enable tools that can help users find information on living things using any of the names that may be related to an organism.??”
The uBio site provides a sophisticated and enjoyable illustrated introduction (excerpt at right) to the variety of challenges in retrieving information using organism names. Another feature is Nomenclator Zoologicus, a searchable list of the names of genera and subgenera in zoology from the tenth edition of Linnaeus 1758 to the end of 2004, developed with Zoological Society of London. uBio is helping organize and index Encyclopedia of Life (“a web page for every species”) and Biodiversity Heritage Library (1.124 million pages digitized and on the web so far).
I close with an example from birds. Some taxonomic confusion reflects the struggle to integrate older works that use outdated taxon names or species limits with modern knowledge. Other discordances reflect lack of consensus among current experts. Given the intensity of scientific study and public interest in birds, it is surprising there is no single authoritative world checklist, especially since most of the differences at the species level reflect minor disagreements about generic assignment, a few cases of splitting/lumping, or differences in spelling. As one step until there is an expert consensus checklist, for those interested in birds, we have prepared an “ABBI Name Lookup” (Excel, 8 MB) file for harmonizing specimen lists that recognizes 2,462 synonyms, alternate and misspellings, and extinct species.
CoML – Wild Chronicles
National Geographic’s weekly tv show Wild Chronicles featured the Census of Marine Life, including a few comments from Jesse.
We Welcome Veselin Kostov
We welcome our new Research Assistant Veselin Kostov!
Optimizing PCR primers for amphibian COI sequences
“Amphibians are globally in decline, yet there is still a tremendous amount of u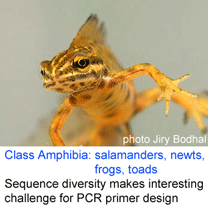 nrecognized diversity” observed Vences et al in 2005 Phil Trans R Soc B 360:1859, the first report applying DNA barcoding to amphibian diversity. Vences and colleagues highlighted the pressing need for fast and reliable identification tools, including for eggs and larva, which are often unrecognizable morphologically.
Here I focus on one technical aspect of DNA barcoding amphibians, namely designing primers that amplify the target sequence from a broad range of species. Previous research had shown remarkable mitochondrial sequence diversity among closely-related amphibians, and even within what appear to be single species, some of which may represent cryptic species. In the 2005 Proc R Soc B paper, researchers used COI primers designed for invertebrates (Folmer et al 1994); suprisingly these “worked in a large proportion of specimens”. They concluded “We support attempts to build up a global and complete cox1 database of [animal] eukaryotes”.
In 2005 Frontiers Zool 2:5 the same group of researchers quantified their PCR amplification success on specimens from 38 individuals representing 20 amphibian species. Using a well-established primer set for vertebrate 16s (Palumbi et al 1991) 38 of 38 (100%) samples amplified; with 3 COI primer sets (1 for invertebrates, 2 for birds), 36 of 38 (95%) amplified, although there was only 50-70% success for the individual COI primer pairs. The authors did not attempt to design new primers for amphibians. They concluded “we strongly advocate use of 16s rRNA as standard DNA marker for vertebrates to complement COI”. This seems reasonable but the advantages of standardizing on a single gene call for an effort to design primers that amplify COI from amphibians before abandoning the field to 16s or some other marker.
In 2007 Mol Ecol Notes Smith and colleagues from University of Guelph analyzed 83 amphibian COI sequences in GenBank to design new primers. The 3′ ends of the forward and reverse primers bind at 1st or 2nd codon position G-C residues, which they found to be highly conserved among amphibian species, and each primer contains three 2-fold degenerate sites. Using this set, they amplified full-length PCR products from 267 of 377 specimens (71%) representing 39 amphibian species (including Triturus vulgaris illustrated at right), and recovered an additional 34 sequences (9%) using a “mini-barcode” primer set designed for butterflies. The authors comment “many of the specimens…which failed to amplify had been fixed in formalin or were collected more than 15 years ago”, so further work to test these primers on fresh material and a diversity of species is needed.
Amphibians are an exciting group. A comprehensive amphibian DNA barcode library will likely provide many, many new insights. I believe further work will help establish robust primer sets for amphibian COI sequences.