NAP books from 1983 (Thanks, Google).

Thanks to scanning by Google Books, we post two vintage reports for which Jesse early in his career was the lead scribe: Changing Climate, Report of the Carbon Dioxide Assessment Committee, National Research Council, Washington DC , 1983. Toward an International Geosphere-Biosphere Program: A Study of Global Change, National Research Council, Washington DC , 1983.

“Changing Climate” was the first comprehensive review of the now popular global warming issue, while “Toward an IGBP” defined what became the Global Change Research Program.

DNA analysis helps unravel food webs

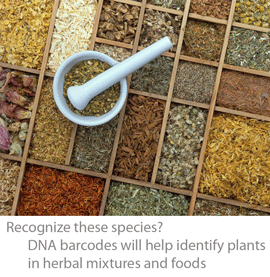
What do leaf beetles (Chrysomelidae) eat? In 11 Nov 2008 Proc R Soc B researchers from Spain, London, and Australia, apply DNA analysis to 76 species (1 individual/species) of Australian leaf beetles. Jurado-Rivera and colleagues extracted DNA from whole beetles using DNAeasy kit. To identify plant DNA in beetle extracts, they amplified chloroplast trnL intron (313 to 581 bp in analyzed samples). 70 (92%) of samples gave high quality reads after direct sequencing of the PCR products, consistent with ingestion of a single plant species; the remaining samples were sequenced from cloned PCR products; these gave 2 divergent clones in 3 of seven cases, for a total of 81 different trnL intron sequences. Why use trnL intron? The authors cite the large number of sequences in GenBank and favorable experience (ie successful amplification and good taxonomic resolution) in their prior work and that of others (eg Taberlet et al 2007 Nucleic Acids Res 35:e14). This certainly makes sense, but I hope a general agreement for plant barcode standards will be published shortly, otherwise the field will continue to be hobbled by having multiple incomplete and non-overlapping databases for the various markers. For example, according to the authors “only 14 and 15 of approximately 1000 and 800 described Australian species of Acacia and Eucalyptus, respectively, are represented in GenBank by trnL intron sequences. As to what resolution is possible with current trnL database, the authors found “reliable identification to plant family in every case and very frequently the inference is possible at lower taxonomic levels.” 

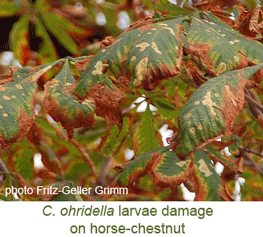
There also needs to be an agreement to have a curated plant barcode database. As the authors report, “in the course of this study, we found several examples of erroneous taxonomic assignments (e.g. Sapindaceae identified as Cypripedium, Cypripedioideae; Apocynaceae labelled as Sesamum, Pedaliaceae; one case of names switched between Pittosporum and Cheiranthera, both Pittosporaceae; suspicious generic assignment for Aesculus x carnea), and of sequencing artefacts (e.g. Tragopogon spp., Acacia usumatensis) and chimeras (e.g.Pentaphylax euryoides). Problems introduced by these sequences were only apparent after careful inspection of trees revealing suspicious relationships, and required phylogenetic re-evaluation after removing problematic sequence data.” 

This is helpful for the present study, but the problematic sequences remain in the reference databases, ready to trip up the next set of researchers who might not be so careful. To fix this problem, Jurado-Rivera and colleagues make what I think is the wrong suggestion, namely “all of the above would argue for the use of additional markers”. Adding markers may improve the ability to make species-level identifications in plants, but if the goal is to construct an error-free database, adding markers is an expensive and likely ineffective way to ferret out mislabeled or otherwise inaccurate sequences. What is needed is a stand-alone database, closely-linked to GenBank, in which problematic sequences can be weeded out or re-labeled (ie Barcode of Life Database (BOLD) www.barcodinglife.org).

To construct a beetle phylogeny, the authors amplified COI and EF1a from their specimens. They found strong concordance between the evolutionary histories of Australian Chrysomelinae beetles and their host plants, indicating long-term co-evolution. They conclude “our analysis not only shows the details of ecological associations for a dominant herbivore group but also offers the basis for their evolutionary interpretation.”

I am puzzled that the authors amplified a segment in the 3′ half of COI that does not overlap with the standard animal barcode region, making it impossible to combine their data with the 500,000+ COI sequences analyzed to date (www.barcodinglife.org). This important caveat aside, I look forward to many more studies that utilize DNA barcoding to join ecology and phylogenetics.

Joshua Lederberg

Great scientist and friend Joshua Lederberg passed away 2 February 2008. Josh recruited Jesse to The Rockefeller University in 1984, promoted him in 1989, and supported the formation of the Program for the Human Environment in 1993. Jesse was honored to offer recollections of Josh at his memorial service in February 2008 and a tribute to Josh’s foresight at the January 2009 Rockefeller symposium celebrating his contributions. The tribute highlights Josh’s astonishing anticipation in 1978 of the growth of email and the Internet.

Why we make maps

In 1 Oct 2008 Syst Entomol researchers from University of Alberta report on “Widespread decoupling of mtDNA variation and species integrity in Grammia tiger moths.” Authors Schmidt and Sperling analyzed COI sequences from 274 specimens representing 28 of 36 known Grammia species, collected across Canada and US. An NJ tree showed 13 haplogroups (loose clusters); 11 of these “largely or exclusively corresponded to nominal species,” while the other two, “designated the Western and Eastern haplogroups, contained polyphyletic asemblages of 13 and 10 species, respectively.” The researchers conclude that these two tangles of sequences and species represent historical or ongoing mating between species and “research on factors governing hybridization would be particularly informative in gaining an understanding of the role of isolating mechanisms in speciation” (ie DNA barcoding highlights an interesting group for further study). 

Like explorers mapping new territory, Schmidt and Sperling’s study creates a map that can be used by the next investigators studying these moths, whether as eggs, larva (according to Caterpillars of Eastern North America by David Wagner, Princeton University Press, 2005 “there are no keys that can be used to identify the [Grammia] caterpillars with reliability”), intact adults, or as fragments retrieved from droppings of predator species such as bats. Specimens with COI barcodes in the two polyphyletic tangles will at least be identifiable to a subset of species within the genus.       

This study brings to mind an analogy between GPS and DNA barcodes. Handheld GPS devices enable us to pinpoint our location on the earth’s surface within a few meters. We then use a map to translate the numerical coordinates into useful information. In areas where the mapping is incomplete or out of date, GPS coordinates are less informative and may be misleading. 

A DNA sequencer (handheld version soon perhaps) is a “biodiversity GPS” device, a DNA barcode is a set of biodiversity GPS coordinates, and a barcode reference library is a biodiversity map on which the specimen’s taxonomic identity can be located. In areas that have been mapped in detail (ie records from multiple specimens across the species range and from closely-related species), a barcode sequence will usually enable precise species-level identification with a high degree of certainty. In groups less-well surveyed or in which the taxonomy is unknown, there will be more uncertainty. Nonetheless, the general coherence of genera, families, and even orders in simple COI NJ trees (see figure below) suggests a DNA barcode will usually provide useful taxonomic information even in the absence of comprehensive taxonomic coverage.

I expect that in the future there will be good methods for defining species based on sequence data, including COI barcode records. While the importance of genetic data as an indicator of species status is informally recognized in science reporting (eg “DNA analysis confirmed it was a new species”), it is generally relegated to an ancillary role in species descriptions. It is remarkable to me that of all the mathematical tools of phylogeography, population genetics and phylogenetic reconstruction, none are designed to diagnose species. Just as a node in a ML tree may have 90% bootstrap support, why not apply the same rigor to species-level genetic data and say, for example, 90% confidence that this particular cluster represents a distinct species. I understand this would involve adopting a particular species concept, but at least it would be a place to start. If the data were only COI or other mtDNA sequences, then there might need be a warning about possible introgression as the above study demonstrates. I believe the flood of data from the barcode initiative, with multiple sequences from tens or hundreds of thousands of species, will help push development of such tools.

Neotropical explorers map avian diversity

There are more bird species in the Neotropics than in any other biogeographic region (including many more as yet undescribed; see for example application of COI barcoding to cryptic diversity in Brazilian tyrant flycatchers Chaves et al Nov 2008 Mol Ecol Resources). Mapping this diversity with COI is both exciting and perhaps challenging. Some have wondered if the plethora of neotropical avian species might overwhelm the ability of a single mtDNA gene to resolve differences among species.

There is apparently no need to worry. In February 2009 PLoS ONE researchers from University of Guelph, Canada, and Museo Argentino de Ciencias Naturales, Argentina report on 1,594 COI barcode sequences from 500 species, which represents 51% of of Argentine birds. Kerr and colleagues find COI barcodes work here as elsewhere, ie most species show deep divergences from their “nearest neighbor” in the data set. Overall, 491 of 500 (98%) of species had distinct barcode(s). Of the nine species not resolved, six were Sporophila spp (common name “seedeaters”); these comprised a single cluster of shared barcodes. Although morphologically distinct, I wonder if these might be analogous to North America juncos, which have regional plumage variants without genetic differentiation. As recently as 1973 they were considered to be a complex of 5 species; these are now lumped into one, Junco hyemalis.  

21 Argentine birds showed 2 or more distinct clusters (maximum intraspecific distance 1.52-5.41%). Do these represent different species? The authors genuflect to taxonomic tradition, ie “levels of genetic differentiation do not dictate taxonomic status” and gently suggest “barcode analysis illuminates those taxa and those segments of their ranges where further research is justified.”

I am impressed with the ease of analyzing combined data sets; in this case the scientists merged their Neotropical COI data with that of Nearctic birds (2,615 sequences/659 species). With a click of a button so to speak, Kerr and colleagues were able to determine that 10 of 42 (24%) species shared between the 2 regions showed large genetic differences, which common sense tells us indicate long-standing reproductive isolation (ie species status).  Most of these North-South divergences were in plain-colored passerines or nocturnal species, and often with disjunct ranges consisting of a northern migratory and southern resident population. The former suggests why these might have been overlooked and the latter suggests how they arose. This work highlights how merging data sets amplifies the power of regional studies–one of the benefits of standardizing on a defined barcode mtDNA region, one that will grow with increasing size of barcode library.

In addition to enabling rapid and low-cost mapping of avian diversity including discovery of divergent lineages, which in most cases are indicators of new species, avian DNA barcoding establishes a genetic reference library with practical benefits to society, as in examples illustrated above. The DNA barcoding effort including All Birds Barcoding Initiative (ABBI) draws interest from many persons who live outside of museum walls.

DNA barcoding re-tested in Madagascar butterflies

In addition to their regular classes, most US high school students take and re-take a multitude of national standardized tests (and tests to practice for the tests) starting with the PSAT in 10th grade, then various SAT subject tests, AP tests, and the SAT or ACT achievement test (sometimes taken two or more times). Fortunately for students and their parents, this process usually comes to an end once they actually apply to college or university. For DNA barcoding, after six years and 500,000 sequences from 50,000 species, it seems it is still in midst of exams! 

In Nov 2008 Mol Phylogenet Evol, in “a test of the DNA barcoding approach,” researchers from University of New Orleans, USA; University of Antioquia, Colombia; and Natural History Museum, London; analyze barcode region COI sequences in a “hyperdiverse” genus (includes about 70 species) of butterflies endemic to Madagascar. They collected 109 specimens of 6 Heteropsis species, including 2 “undescribed species” and 1 species from a related genus. To confuse biological databases, Heteropsis is also a genus of flowering plant in family Aracaea. 

As an aside, and I know this is a commonplace observation, there needs to be a way of mapping biodiversity that gets around having “described” and “undescribed” species. For one, many of the “undescribed” species that are the focus of biological study, including perhaps those in this paper, will never be formally described. As an analogy of an alternate approach, in astronomical science, a first step is creating detailed sky maps based on particular wavelengths of the electromagnetic spectrum. Such sky maps are “just data,” in this case recordings of radiation-emitting stellar objects. Then, based on study, astronomers label certain objects as quasars, for example. Of course, this “annotation” does not change the underlying data, and astronomers may later change the labels on some objects based on new information or new understanding.

Following the suggestions of others, I believe some sort of sequence-based map of species-level biodiversity is a necessary way forward. Like the sky map, sequences are “just data” (the “just data” also include collection location, date, voucher specimen, and photographs).  Taxonomists would then annotate the “data map” with taxonomic interpretations, assigning species names to particular clusters for example. Species-level taxonomic revisions or conflicting taxonomies are easily accomodated–this simply involves re-labeling a cluster in the former case, or adding alternate names in the latter case. This sequence data map approach explicitly recognizes that species names are hypotheses. 

The present system is the inverse of the above: a taxonomic map (ie species names) is “annotated” with sequences. Under this system, there is no easy way to register biological information about organisms unless they have been already formally described as a species. Without a name or description of diagnostic characters, how does the next researcher know if they are studying the same “undescribed” species unless they examine the original specimens (in this case, stored in Natural History Museum, London)? On the other hand, one could easily report biological findings (eg coloration, larval morphology, food plants) associated with a specimen and its barcode sequence. 

Going back to the astronomical analogy, barcode-region COI is the appropriate “wavelength” for the species-level map of animals. This map will not be perfect. Just as gravitational lensing distorts the positions of some stellar objects, and others are obscured by intergalactic dust, the COI wavelength map will mislead in some areas and be obscured in others, not enabling one to “see” the existence of certain species–e.g. corals with slow mtDNA sequence evolution.

Would this be “DNA taxonomy?” No. First, community standards would ensure that the sequence map is not the arbiter of species status. Just as there are morphologically cryptic species and others that are phenotypically diverse, what we recognize as distinct species might be “hidden” within a single sequence cluster, and on the other hand, some named species might comprise a set of more distantly related sequences. Thus there would not be a fixed numerical determinant (eg distance, characters) of what constitutes a species cluster. Second, the COI-wavelength map would not establish higher-level relationships. Of course the shape and distinctness (or lack thereof) of clusters will change as new sequence data becomes available, as well as the taxonomic annotation, but that is the nature of biological diversity–we just don’t know everything yet! 

Why bother? Taking a sequence-mapping approach, I believe one can accelerate exploration of biodiversity and harness efforts of those outside the taxonomic priesthood. For example, one can predict much of the next ten years of species- and genus-level revisions in avian taxonomy simply on the basis of currently available COI and other mitochondrial DNA data (sequence plus specimen data). I suggest to collate and disseminate the available data in a publicly accessible form. This might even help harness “citizen science” by encouraging submission of birds that died of natural causes, or feathers naturally shed or collected in banding/ringing operations (or barcodes of feathers for those with resources and access to sequencing facilities), along with date, gps coordinates, and digital photo. If so, then legions of devoted birders could help with creating the genetic map, as they are already doing with observational records (see eBird). Because collecting sequence (and specimen-associated data) that establish the map is separate from the taxonomic process of “naming” this would not devolve into taxonomic chaos, rather, like astronomy amateurs, citizens could contribute to the observational database on which the sequence map is built. One utility that is needed is an easy graphical interface that collates available mtDNA on birds for example and highlights areas where information is missing either taxonomically or geographically; this sort of display would likely be of interest both to scientists and scientifically-minded amateurs.

Finally, going further out on this limb, depending on community standards, there might be agreement to consider a sufficiently divergent cluster a new species, until proven otherwise by more biological data. So a specimen plus a sequence could potentially be a “described species.” I prefer keeping the everyday designation of “species” rather than for example molecular operational taxonomic units (MOTU) or (evolutionarily significant units (ESU), but that is a discussion for another time!

Back to the paper. Linares and colleagues found that all 6 Heteropsis spp (including the 2 “undescribed” species) were evolutionarily distinct (ie formed reciprocally monophyletic lineages in Maximum Likelihood and Bayesian analysis of barcode-region COI), and that the mtDNA phylogeny was corroborated by nuclear DNA sequences. Given the large distances among and small within species, a neighbor-joining tree would likely have shown the same species clusters (although not necessarily the same branching pattern; the COI sequences do not appear to be public on GenBank yet, so I could not try NJ analysis). Unsurprisingly, one species pair showed less than “10X distance” (ie interspecies distance less than 10 times the average intra-species distance). Most barcode studies that include multiple congeneric species have sister species pairs that fall below this threshold. The results were initially confounded by amplification of Wolbachia (an intracellular parasitic bacteria of insects) DNA, leading them to design alternate primers. Wolbachia is unevenly distributed in tissues and often concentrated in reproductive tract, so perhaps the use of abdominal segments for DNA extraction is part of the reason this was a problem.

Jesse visits Niceville High School in FL

The students of Niceville High School in the Florida Panhandle regularly contribute valuable samples from the sandy bottom of their beautiful shoreline to the near-shore (NaGISA) field project of the Census of Marine Life. On 23 January, Jesse had the privilege of visiting with the students and their exceptional instructor Rick Hernandez. The Okaloosa County School district reported the visit.