Next-generation DNA barcode application

DNA barcoding efficiently identifies species from flies to fish to flowers, including from bits and pieces and other unrecognizable forms: eggs, larvae, seeds, pollen, roots, damaged museum specimens, and even DNA shed into aquatic and terrestrial environments. What else can we do with this new instrument? With the BOLD reference library at >800,000 records from > 68,000 species, DNA barcoding combined with high-throughput sequencing can be a macroscope for studying large-scale patterns in biodiversity.

glyophodes-margaritaria1In March 2, 2010 Proc Natl Acad Sci USA researchers from University of Minnesota, National Museum of Natural History, University of Guelph, and University of South Bohemia, Czech Republic, apply DNA barcoding to measure species diversity and distribution in tropical moths and butterflies. In an earlier study (Novotny et al Nature 2007), some of the same researchers had shown surprisingly low beta diversity and little host specialization in herbivorous insects across 75,000 square kilometers in lowland rainforest in Papua New Guinea, an area 1 1/2 times as large as Costa Rica. (Note: alpha diversity is number of species at a given site; beta diversity refers to differences in species composition among sites).

For the Nature report, the researchers hand-collected 74,184 caterpillars representing 370 species; each caterpillar was tested for food preference in the field, and 25,346 were raised to adults. In the PNAS study, the researchers analyzed COI barcodes of 1,359 individuals representing 28 apparently widespread Lepidoptera species for which they had collected large numbers of individuals at 8 sites across the region (average individuals per species, 49, range 29-80; average sites per species, 6.1, range 3-8; average distance between sites, 160 km, range 59 -513 km).

Craft and colleagues found “no universal pattern of population genetic structure among 28 Lepidoptera species in lowland New Guinea.” Although about half of the species showed genetic diversity associated with host plant specialization and/or geographic isolation (some of the variant lineages may represent distinct species), the phylogeographic patterns differed among species and there were a surprising number of widely sympatric species with overlapping diets, a challenge for ecological theory. As the authors note, their results contradict estimates of insect diversity and host specialization in the Americas, and they call for “comparative population genetics of ecological guilds” to enable testing “major hypotheses for the origin and maintenance of species diversity.” Like a new telescope for astronomy, DNA barcoding offers biologists a new instrument for exploring the structure of biodiversity.

The City Ant and The Country Ant: DNA tells the story

North_America_satellite-tsessileDNA helps answer the origin of infectious diseases: are cases sporadic events or part of larger epidemic, such as the recent Salmonella Montevideo outbreak involving at least 245 persons in 44 states, traced to a single importer of crushed red pepper used in salami manufacturing. In a similar way, DNA helps answer the origin of apparently widespread species–are they part of single outbreak so to speak, or are they multiple independent populations or species. (This suggests useful connections between phylogeography, the genetic study of populations, and molecular epidemiology of disease.)  As with pathogen diagnostics, a minimalist DNA testing approach will help make feasible analyzing large numbers of specimens.

In February 2010 PLoS ONE, six researchers from University of North Carolina report on Odorous house ant Tapinoma sessile (smells like rotten coconuts when crushed), collected from 47 urban and rural localities across the US.  According to the authors, T. sessile is the most common and widely distributed ant in North America, found “from the West coast to the East coast and the deserts nearly all the way to the tundra.” The structure of the 18 colonies examined in detail ranged from a monogynous (single queen) colony in an acorn with 50 workers, to a polygynous colony with 2 queens and 250 workers, to a large, dispersed colony of “several million workers and thousands of queens in and around several buildings on a college campus.”  For DNA analysis, 68 individual were analyzed (1 from each of the 18 colonies, plus 23 collections in natural environments made by entomologists, 26 collections in urban environments mostly provided by pest control professionals, and 1 T. erraticum specimen). Menke and colleagues found 4 distinct genetic groups, corresponding to geographic areas, with 7.5 – 10% COI sequence differences among groups, and relatively small (0.2 – 2.3%) differences within groups, a pattern that “may represent multiple species.” Counter to initial expectations, urban ants were genetically similar or identical to non-urban ants within each region, and colony structure was not associated with urban vs natural environment, namely monogynous and polygynous colonies were found in both environments.

I conclude there is much we don’t know about the commonest, most everyday species, and that DNA barcodes are just the right size for many of the relevant scientific and practical questions. In closing, for a view of complexity of ant life, please see E.O. Wilson’s wonderful short story “Trailhead”, in March 6, 2010, New Yorker, an excerpt from his upcoming book Anthill.

International barcoders get into print

iBOLlogoNow that 3rd International Barcode of Life Conference (held in November 2009 in Mexico City with over 350 researchers from 54 countries) is behind us, where to turn for DNA barcode science and organizational news? A bright answer arrived in today’s email: the first issue of the International Barcode of Life (iBOL) Bulletin (download pdf or view online flash version). The 12-page illustrated quarterly iBOL newsletter has a promising diversity of news. To take one example, I learned that some members of the North American Moth Photographers Group (MPG) are submitting their hard-to-identify specimens to Biodiversity Institute of Ontario, thus building up the reference library, and in turn receiving DNA-based identifications! This sort of crowd-sourcing approach to specimen collection could be a big thing for barcoding in particular, and for biodiversity science in general. There are many dedicated, expert, non-professionals who are likely to contribute given the right framework.

iBOL-Barcode-Bulletin1In terms of citizen participation, the MPG story suggests expanding opportunities for biological research that harnesses the skill and energy of non-professionals, a step beyond the successful BioBlitz model, which still requires a lot of on-site organization. If North American birders can create a comprehensive, regularly-updated database documenting migration, i.e. eBird (1 1/2 to 2 million sightings submitted monthly), then there must be a large potential for crowd-sourcing specimen collection, at least for certain organisms. After all, the most expensive part of biodiversity science is often collecting and/or documenting specimens. How to encourage and streamline data collection is suggested by Cornell University’s recently-released iPhone app BirdsEye, which displays current local sightings based on eBird database and user’s GPS location, with planned update that will enable birders to instantly update eBird with their own sightings.

The Barcode Bulletin aims to “inform and entertain iBOL collaborators, the global DNA barcoding community and the wider world of biodiversity genomics”; this issue is a promising start.

PLoS ONE paper “Structural Analysis of Biodiversity”

In 24 February 2010 PLoS ONE paper “Structural Analysis of Biodiversity”, PHE researcher Mark Stoeckle and colleagues at Mt. Sinai School of Medicine apply their recently-developed indicator vector technique to over 16,000 DNA barcode sequences from 12 diverse animal groups, with correct assignment in all 11,000 test cases. This approach generates “Klee diagrams” which represent affinities among large numbers of nucleotide sequences in condensed, single-page displays. The computationally-efficient indicator vector analysis could be applied to even larger datasets  (BOLD database at > 800,000 records, >67,000 species), an exciting prospect.

Medicinal orchids unmasked

Herbal products make a compelling case for DNA-based identification–how else to recognize dried bits of roots, leaves, stems, bark, and flowers from a multitude of species? In December 2009 J Nat Med, researchers from Ochanomizu University and Showa Pharmaceutical University, Japan, apply recently agreed-upon standards for DNA barcoding land plants, namely matK and rbcL, to distinguish among Dendrobium species. Dendrobium is a large (about 1200 species) genus of orchids widely distributed through east Asia to Philippines, Australia, and New Zealand.  Over 50 Dendrobium species are used in traditional medicines and are thought to have various pharmacologic activities, although the active ingredient(s) are not yet characterized.

Asahina and colleagues analyzed rbcL and matK from 12 samples representing 5 Dendrobium sp. and 3 hybrid cultivars whose genetic histories are uncertain. Single primer sets successfully amplified matK and rbcL from all specimens. The researchers cloned PCR products (and then sequenced at least 3 clones per species), rather than directly sequencing amplified products (rationale for the cloning step is not given). They found that matK, but not rbcL, distinguished among the five species; this is consistent with general observation that rbcL varies less among closely-related species than does matK. Results were similar when 22 matK Dendrobium sp. sequences from GenBank were added to analysis (bringing species total to 6), with one exception; 1 of 11 D. officinale GenBank matK sequences was unique, and in NJ diagram appeared on branch distant from the other 10. In this modest sampling, there was no intra-specific variation in the original 12 samples; some intra-specific differences were noted in 2 species in comparison with GenBank sequences.

Untitled-7This study demonstrates advantages of DNA barcoding approach for plant identification. Of course, there is already a lot of interest in DNA identification of herbal plants in general and Dendrobium orchids in particular. For example, I found over a dozen articles describing DNA methods for distinguishing Dendrobium sp. However, the methods described are limited to identifying species in this one genus, which means one has to have a pretty good idea what the specimen is before applying DNA testing! This highlights the essential advantage of barcoding–a standardized approach can be applied to any unknown, and makes feasible creation of a comprehensive reference library.

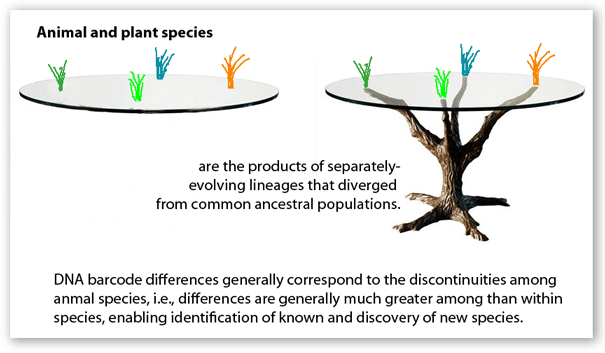
Looking ahead, we want to know more about intra- and inter-specific variation in plants. In animals, the patterning of mitochondrial variation is quite uniform, with intra-specific << inter-specific variation, such that most species form relatively tight clusters distinct from those of other species in NJ diagrams. Results so far in plants generally show little intraspecific variation in chloroplast genes (including rbcL and matK), but a diversity of distances among closely-related species. Assuming these early results are borne out, we then want to know why plants and animals differ? For more genetic variation in plants and animals, see Rieseberg et al Nature 2006, Fazekas et al Mol Ecol Res 2009).