On 26 April the New York Times ran a profile by Nicholas Wade about the span of Jesse’s career, “Commodore of a Global DNA Census.â€
News
Learning about lichens with DNA
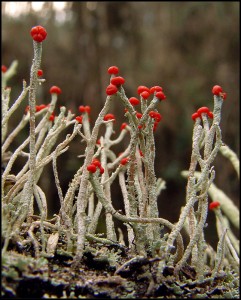 In 1867 Swiss botanist Simon Schwendener was the first to recognize that lichens were symbiotic associations of fungi and algae (or, as subsequently discovered, cyanobacteria) (for more info, try this EOL podcast on lichen–“a tropical rainforest in miniature”). Today about 13,500 species are described (lichens are named for fungal component), representing 18% of the 74,000 known fungi. It is remarkable that so few fungi have been named, given that estimated diversity is 1.5 million (Hawksworth, 2001). This presumably reflects difficulty of morphologic diagnosis of often microscopic, unculturable organisms with diverse life forms and highlights a need for molecular methods. Several recent epidemics causing serious animal and plant mortality have turned out to be newly recongized fungi [including Batrochochytrium dendrobatidis (chytridiomycosis in amphibians), Geomyces destructans (White-nose Syndrome in bats), Cryophonectria parasitica (Chestnut blight), and Ophiostoma spp. (Dutch elm disease)], hinting at the hidden diversity and importance of fungi.
Back to lichens–in March 2011 New Phytologist, researchers from Royal Botanic Garden (RBG) at Edinburgh and Kew report on DNA barcoding of lichenized fungi using internal transcribed spacer (ITS) region. ITS has been widely used in fungal taxonomy and has been proposed as a standard barcode region for this group (the standard barcode for animals, COI, has so far been difficult to reliably amplify from the diversity of fungi either due to variability at primer binding sites or introns). ITS refers to 2 regions in the nuclear ribosomal RNA gene complex (5′ external transcribed sequence—18s rRNA—ITS1–5.8s rRNA—ITS2—28s rRNA—3′ external transcribed sequence), which is present in several thousand copies in each cell. Advantages of ITS as a barcode region include availability of broad-range primers that bind to conserved regions in 18s and 28s rRNA; presence of multiple copies per cell, facilitating recovery from small or degraded samples; and the legacy of ITS fungal sequences in GenBank. Disadvantages of ITS as barcode locus are that is a non-coding region, making it more difficult to align and compare sequences; multiple copies per cell of which may differ from one another; and presence of misidentified sequences in the legacy data.
Kelly and colleagues sampled 112 freshly collected and herbarium specimens from one genus (Usnea) including 16 of the 19 species occurring in the British Isles and 248 specimens from native woodland habitats in Britain, comprising “94 species from 55, 28, and 8 genera, families and orders, respectively.” In the latter floristic set, 66.0% of species were represented by 3 or more samples and 77.7% by 2 or more samples. DNA was extracted using DNAeasy Plant Mini Kit and amplifications were performed with sets of standard primers that amplify the entire ITS segment (ITS1-5.8s rRNA-ITS); nested PCR was performed on “a small number of samples that failed to yield a single discrete product with standard PCR.” If these failed to generate a suitable product for sequencing, then a “thin slice of a single apothecium” was placed directly into the PCR mix and amplified as above or using primers for ITS2 only. The full ITS region was obtained from 80.9% of combined 351 samples (75.9% of Usnea and 83.9% floristic). 22 (6.3%) of products showed heterogeneity on direct sequencing and required cloning to obtain suitable products for sequencing. The commonest regions for failure were no amplification [7.1% overall, largely with older (>3y) specimens; and amplification of non-target fungi (2.0% overall, only with field samples from floristic dataset)].
Is there a “barcode gap” (intraspecific<<interspecific distance) among fungal ITS sequences? In this study at least, usually yes. The RBG researchers defined clusters as nodes with ? 70 BP under BIONJ method or PP ? 0.95 under Bayesian inference. Under these criteria, species discrimination was 73.3% for Usnea dataset and 92.1% for floristic dataset. Simple BLAST analysis was also usually accurate–80% of Usnea species and 92.1 of floristic species were correctly assigned. This bodes well for cataloging the “dark matter” of fungal biodiversity using ITS DNA barcodes. So little is now known, it is exciting to contemplate what will be learned!
What you can learn from a tiny bit of DNA
Infectious diseases may determine survival of individuals, entire species, and perhaps even large branches on the Tree of Life. Beginning in the late 1970’s, rapid declines in amphibian populations around the globe were noted and today about 40% of world’s 6,671 amphibian species are threatened with extinction (e.g. Stuart et al 2004). The major cause appears to global dissemination of a pathogenic chytrid fungus, Batrachochytrium dendrobatidis, first reported in 1998 and formally described in 1999.
Although the global pattern is clear, many local population declines remain enigmatic due to absence of histologic data. In addition, the pattern of spread of the fungus and its timing in relation to mortality are not known. In April 2011 Proc Natl Acad Sci USA (open access), researchers from San Francisco State University and University of California, Berkeley, describe a non-invasive, DNA-based method for detecting B. dendrobatidis (Bd) in formalin-preserved specimens. Although exceptions are reported, DNA recovery after formalin treatment usually fails, so these are remarkable results.
Cheng and colleagues analyzed formalin-preserved salamander and frog specimens collected in Mexico, Guatemala, and Costa Rica in areas where population declines had occurred. Specimens were rinsed in 70% ethanol, then, using a skin swab or dental brush, “stroked 30 times over the ventral surface…from neck to vent” [salamanders] or “on the ventral surface, including the inner thighs, abdomen, and between toes” [frogs]; the swab/brush was then stored in a microfuge tube at 4 oC until processing. DNA was extracted with a standard kit (Prepman Ultra or Qiagen DNeasy), and a 146-bp segment of Bd ITS-1 region was amplified, using 1/80th of recovered DNA for each amplification, run in triplicate using real-time PCR along with positive and negative controls.
Initial trials were done with 29 Bd-infected (as determined by histology) and 9 Bd-uninfected formalin-preserved Batrochoseps salamander specimens. Bd was detected in in 24 (84%) of infected specimens and none of uninfected specimens. They suggest that their success with such unlikely specimens may reflect “(i) the very short length (146 bp) of the target sequence for Bd amplification, (ii) the presence of many copies per Bd cell of the ITS-1 region being targeted in our assay, and (iii) recovery of many cells of Bd in our swabbing technique because Bd grows on the skin surface of the host.”
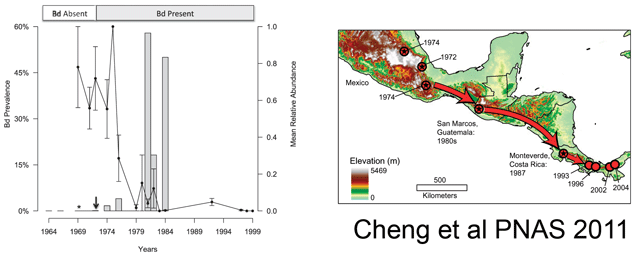
The researchers then applied this assay to frogs and salamanders collected in Mexico (n=537), Costa Rica (n=74), and Guatemala (n=615) between 1964 and 2010. They found Bd as early as 1972, with a large increase (>50% prevalence) beginning in 1980, coincident with the observed population declines (see figure above). Combining their results with those of Lips et al 2006 indicated a steady southward movement of Bd from southern Mexico in 1972 to Panama in 2004. They interpret this remarkably slow expansion to mean that the pathogen is spread by the animals themselves, perhaps as they move between the tiny pools of water that collect in the crowns of bromeliads. The near coincident appearance of Bd around the world suggests additional modes of spread, possibly including human activities. I look forward to additional studies that will shed light on the global dissemination of Bd and point to interventions to limit this ongoing disaster for amphibians.
Deep carbon interest
The newsletter Oilprice.com takes an interest in the Deep Carbon Observatory and abiogenic methane in a good article,The Search for Deep Oil and Gas, by Brian Westenhaus.
Publication in PLoS One of article on Forest Area and Density Trends
PHE continues its longstanding work on land use and land cover with a new publication in PLoS One on Forest Area and Density Trends. The work, a product of collaboration between researchers at PHE, Connecticut Agricultural Experiment Station, and the University of Helsinki, analyzes trends in forest area and forest density in the United States and global regions over the last decades. We learned that changes in forest area do not correlate steadily with changes in density.
U Adelaide, CBOL to host IBOL 4 (abstracts by 15 may!)
From the conference website: www.dnabarcodes2011.org:
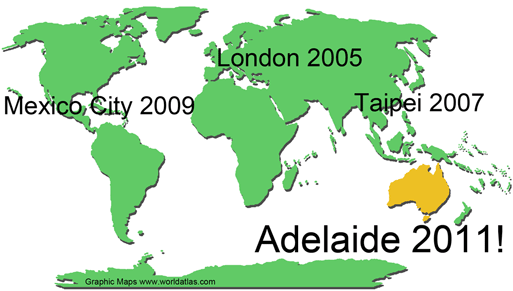
The Consortium for the Barcode of Life and the University of Adelaide invite you to join us in Adelaide, Australia from 28 November – 3 December 2011 for the Fourth International Barcode of Life Conference. Barcoding has seen extraordinary growth since the Mexico City Conference in November 2009 so join participants from around the world for the biggest barcoding event ever!
The organizers have developed this website to provide potential participants, co-sponsors, and other stakeholders with information about the conference. The conference organizers are also eager to have your feedback as we plan the conference so please share your ideas through Connect, the DNA Barcoding network. You can do this by using the links found throughout this website.
Important Dates
- Preliminary agenda available: 1 April
- Online abstract submission system opens: 1 April
- Sponsorship opportunities open: 1 April
- Travel bursary applications open: 15 April
- Online registration and hotel reservation site opens: 1 May
- Deadline for submission of Abstracts: 15 May
- Deadline travel bursary applications: 19 May
- Agenda with speakers available: 1 August
Jesse Ausubel elected to AAAS Class of 2011
The American Academy of Arts and Sciences elects Jesse as a member of the Class of 2011.
AAAS Class of 2011 (PDF)
Rockefeller University Newswire press release
Make a lasting contribution
In December 2010 Mol Ecol, researchers from University of Alaska Museum compare mitochondrial and nuclear DNA differences among 9 pairs of bird populations, subspecies, or species, with a total of 162 individuals from 12 species analyzed. What did they find? Their gloomy conclusion is “our results suggest that using a genetic divergence estimate from part of an organism’s genome does not accurately represent organismal divergence and that commonly used measures are not strongly correlated with the speciation process.” I translate this as “DNA barcoding is not reliable.” Since we already have large surveys demonstrating effectiveness of DNA barcoding in more than two thousand bird species, their findings are surprising. Let’s go to the data.
For mtDNA, Humphries and Winker analyzed 1037 bp of ND2 (why not COI!) and employed Amplified Fragment Length Polymorphism PCR (AFLP) to assess differences in nuclear DNA. AFLP is a widely-used, indirect method of assessing nuclear genome differences that to my knowledge has never been compared to whole genome sequencing. Counting differences among aligned mtDNA sequences is straightforward. For AFLP, interpretation is more complex–in this study the banding patterns were converted to FST (fixation index) values using “AFLP-SURV 1.0 with the Bayesian method with uniform priors and 10,000 random permutations to test for significant levels of differentiation.”
The researchers chose 3 pairs of populations, subspecies, and species in 3 orders of birds that live in Alaska or Russia. The study design had two aims, first, do levels of genetic distances follow taxonomic categories, i.e. are differences among species > subspecies > populations? Contrary to their conclusion, my answer is yes, as there were no mtDNA differences between populations, and differences among subspecies and species ranged from 1.99-5.48%. Two of the three subspecies pairs are already recognized as different species by some authors, and the third pair is divergent enough (3.02%) to likely represent different species. So I conclude there are really just two categories–populations, which had no mtDNA differences, and species or candidate species, which showed a typical range of divergences. It is puzzling that the discussion did not include the possibility that taxonomy is imperfect rather than DNA data being misleading. The second question addressed by this study is: do nuclear DNA distances co-vary with mtDNA differences? The answer turned out to be no, which I find interesting but of uncertain significance. It may be that AFLP analysis of nuclear DNA is not a reliable indicator of divergence time or species status, at least in comparisons across lineages. Here more data is needed. To my mind, AFLP is a little bit like acupuncture–it may work, but we don’t understand why, so it’s hard to be confident in its application. Patterns of variation in the human genome revealed by whole genome sequencing have turned out to be much more complicated than expected, and I expect there will be a flood of data using whole genome sequencing to look at species boundaries.
For a lasting, publicly useful contribution to science, I hope that the many researchers who are analyzing mtDNA differences among animal species will include barcode region COI if not doing so already. The mitochondrial genome evolves in close but not exact parallel, and there is no particular reason to pick one coding region over another. By analyzing barcode region COI and depositing their sequences and associated collecting data in BOLD and GenBank, researchers can amplify the value of their work. For birds, the BOLD COI database helps identify remnants from bird-airplane collisions, leading to improved airline safety. For studies such as this, by analyzing COI the researchers can easily combine their results with existing records, adding power and potentially new insights to their analysis.
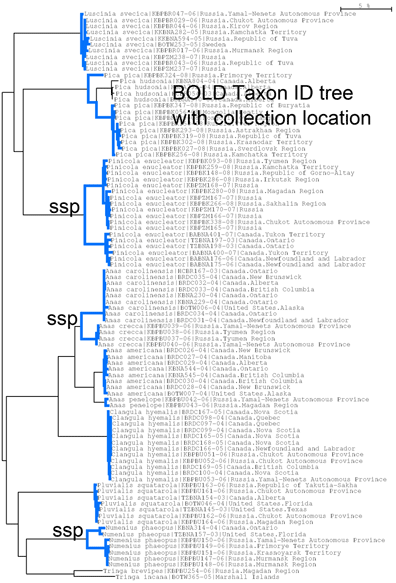
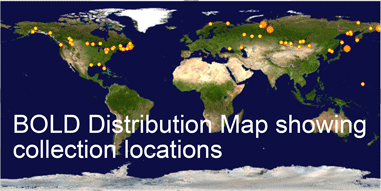
To give an idea, I went to BOLD, merged the “Birds of North America” and “Birds of Eastern Palearctic” projects, selected all records for the 12 species in this study, and generated an NJ tree (blue highlighting added to species branches) and a Distribution Map of where the specimens were collected. The highly divergent subspecies pairs are immediately evident. It would be of interest to see where the specimens from this study fit, and this would help build a highly detailed online map of genotype distribution, something that does not yet exist for any animal species. An exciting prospect!
Visualizing birds: 4. Diagnostic differences
In 2004, the American Ornithologists’ Union (AOU) (Banks et al. 45th supplement) recognized most of the smaller-bodied forms of Canada Goose (Branta canadensis) as a separate species, Cackling Goose (B. hutchinsii). It can be difficult to distinguish these birds in the field including for banders, as there is overlap between some of the smaller forms of candensis and the larger forms of hutchinsii (see for example David Sibley’s account). Given morphologic approximation in some cases, one might also expect a range of genetic differences between the species, with some Canada geese being very similar to some Cackling Geese.
Using COI as a genetic flashlight, a surprising finding to me is that sequence differences between species are generally fixed. Individuals of a species do differ from each other in COI, but they usually differ in ways that do not change the distances between species. There are exceptions, particularly with species that hybridize regularly, and perhaps with very young species, but these are a small minority of birds analyzed so far. Stated another way, for most species there are no genetically intermediate forms. One important corollary is that early results with small numbers of individuals are likely to be indicative of results with more comprehensive sampling, which is what has been seen with All Birds Barcoding Initiative (ABBI) to date.
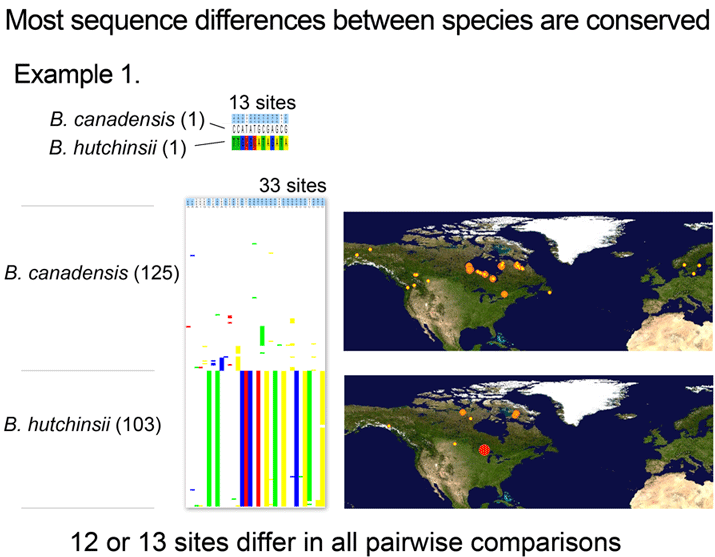
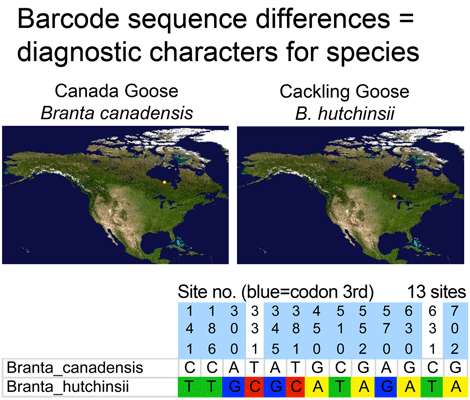 Where’s the data? Here are some illustrations of results so far. For figure at left, I downloaded one B. canadensis and one B. hutchinsii barcode from public records section of BOLD (www.barcodinglife.org), and printed the map showing where each specimen was collected (a very useful tool in BOLD). For this and subsequent sequence analyses, I used publicly-available MEGA software to highlight all sites at which the two sequences differed. (In MEGA you click “variable” to highlight and then “export highlighted sites to Excel.” I then used Excel’s “conditional formatting” color the cells according to letter). These two sequences differed at 13 out of 653 COI positions, 11 of which were 3rd codon position (codon position may turn out to be interesting later on).
Now what happens if you analyze a larger number of individuals? For next illustration, I used BOLD Taxonomy Browser, navigated to Chordata-Aves-Anseriformes-Branta, downloaded all public sequences, and used MEGA as above to highlight and export all sites that differed among the set (there are several other Branta species; these were deselected for this analysis).
With over 100 individuals for each taxa collected at widely dispersed sites (including some canadensis in Norway and Sweden), variation within both species was observed. Most of this was scattered differences found in one or a few individuals, although there did appear to be a number of canadensis individuals with a shared variant, which might be of interest for further study.
However, the intraspecific variation rarely involved diagnostic sites, with the result that all pairwise comparisons between canadensis and hutchinsii differed at 12 or 13 sites.
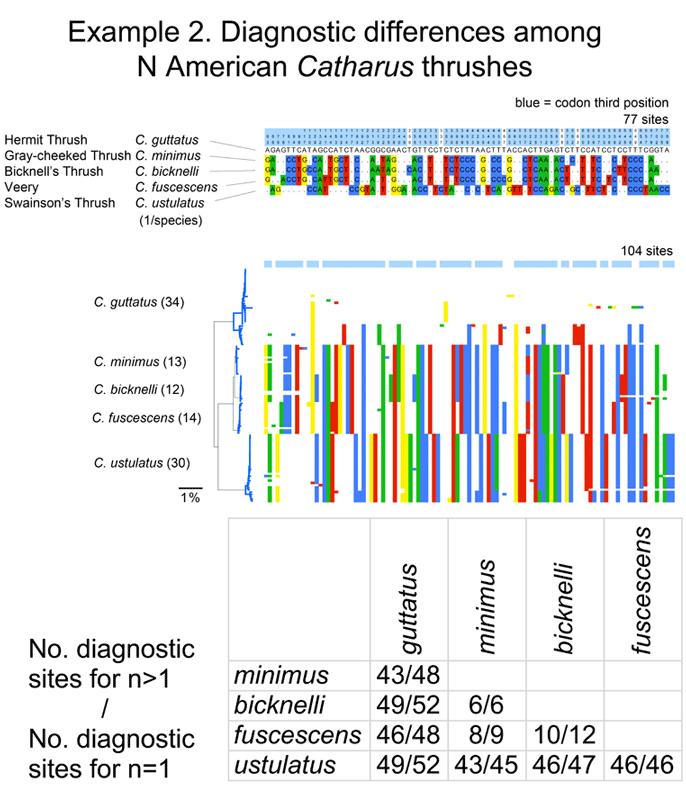
I close with another slightly more complex example. There are 5 Catharus thrushes in North America. These are relatively small, drab woodland birds with haunting, ethereal songs (you can listen to Hermit Thrush (C. guttatus) song on Cornell Laboratory of Ornithology site). One bird, Bicknell’s Thrush (C. bicknelli) was first recognized by AOU as a species distinct from Gray-cheeked Thrush (C. minimus) in 1998, and distinguishing individuals except by song is difficult even for experts with hand-held birds.
I downloaded all public Catharus barcodes using BOLD Taxonomy browser, and analyzed as described above. In comparing single sequences from the 5 species, these differed at 6 to 52 sites. With larger sample sizes (12-34/species), some intraspecific variation was observed, particularly in Hermit and Swainson’s Thrushes (see NJ tree at left of larger alignment), but diagnostic differences were mostly unchanged, even for very closely related minimus-bicknelli-fuscescens group.
[On a separate note–the nature of intraspecific variation might be of interest–a disproproportionate number are singletons (present in one individual in the set) and are codon first or second position substitutions (whereas most interspecific differences among closely-related birds are at codon third position). No doubt evolutionary biologists have investigated this previously, but perhaps not with such a large number and diversity of species with multiple individuals analyzed.]
These figures help illustrate the nucleotide sequence differences that distinguish species. In the language of evolutionary biology, these sequence differences are diagnostic characters. An NJ tree is a powerful shorthand way of representing these differences. In some situations, analyzing the actual diagnostic characters will be important. It might be a useful exercise for the scientific community to compile and display on the web diagnostic differences, at least for groups in which most or all the closely-related species have been surveyed.
Visualizing birds: Part 3. DNA barcode’s-eye view of taxonomic practice
Who decides what is a species and how do they do so? The primary source of information related to species is the peer-reviewed scientific literature, with standards of evidence presumably applied by appropriate experts before an article is accepted for publication. For most groups of animals, once a new species description or revision is published, then it is considered a valid species.
For birds, there is often an additional layer of review in the form of expert committees and handbook authors. Committees and their geographic domains include the American Ornithologists’ Union (AOU) (North and South America), British Ornithologists’ Union (Britain), International Ornithological Congress (IOC) (world), and International Taxonomic Information System (ITIS) (world), plus many nations maintain their own lists; handbooks include Howard and Moore Complete Checklist of the Birds of the World (most recent edition published in 2003), The Clements’ Checklist of Birds of the World (most recent edition 2007, with updates available online), and Handbook of Birds of the World (first volume covering ostriches to ducks published in 1992, 16th and final volume covering tanagers to blackbirds to be published this year). Phew, it’s tiring just listing the lists! Although by my assessment the various lists are about 90% concordant at species level, they do differ, only partly because some have been updated more recently, so we can observe that experts sometimes disagree on species limits in birds, and conclude that taxonomy, like medical diagnosis, involves human judgment. 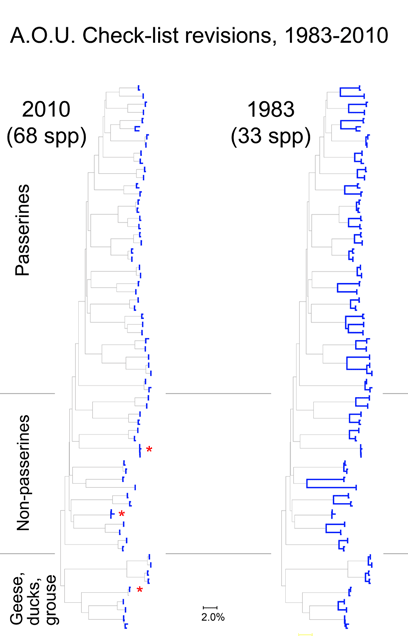
Here I focus on AOU Check-list of North American Birds, picking out just those species that have been revised since the 6th edition (1983). The current Check-list is the 7th edition (1998) plus updates which are published annually since 2003. Over this time by my count there have been 274 changes in species definitions; this includes 6 species lumped into 3, and 121 species split into 268 taxa (note: splitting changes both halves–one is new, and the “parent” taxa has been pared down). The 50:1 predominance of splits suggests a bias against lumping species, perhaps analogous to the bias in medical research against negative studies.
For the figure at left, I compiled all revised species for which COI barcodes were available for both sides of a split or lump, which worked out to 68 species by 2010 definitions (all the available sets were splits), picked two representatives for each, and generated an NJ tree. This represents about 1/4 of all revisions so presumably is representative. Species differences according to 2010 or 1983 definitions are highlighted in blue. Red asterisks mark 3 splits not distinguishable by COI barcode.
Viewed through the lens of DNA barcodes, 91% of revisions involved assigning different names to distinct clusters previously grouped under one name. None of revisions led to taxa with larger intraspecific distances. 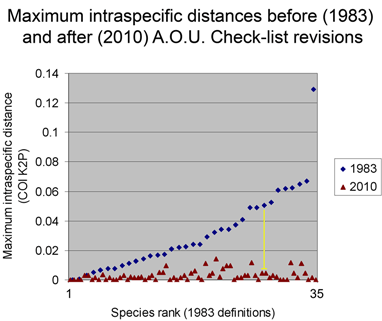
Below is another way of looking at same data–a before and after graph of maximum intraspecific distances (similar to layout in yesterday’s figure, maximum 2010 distances appear below that for the 1983 “parent” taxa; the yellow line highlights one such set; there are two 3-way split in the NJ tree, each of which is shown here as two separate splits.).
One of my reactions to these figures is that taxonomic revision looks pretty simple! On a more helpful note, I think we can observe that what taxonomists consider species based on traditional biological criteria (differences in morphology, song, range, and relative absence of interbreeding) are generally visible with a “COI flashlight” as distinct clusters. As noted in the first post, why this is so is an important unsolved question.
From the above I surmise that essentially all species with unusually large intraspecific distances will eventually be recognized as comprised of distinct species. (Of course there are exceptions, which are interesting.) This echoes an assessment by Zink in 2004 (Proc Biol Sci 2004 271: 561–564). He noted the widespread discordance of mitochondrial DNA divergences and species-level classifications, concluding “a massive reorganization of classifications is required so that the lowest ranks, be they species or subspecies, reflect evolutionary diversity.” Looking at revisionary progress over the past 30 years, I think we are moving very slowly toward that goal, raising the possibility of a more dedicated effort to speed species-level avian taxonomy.
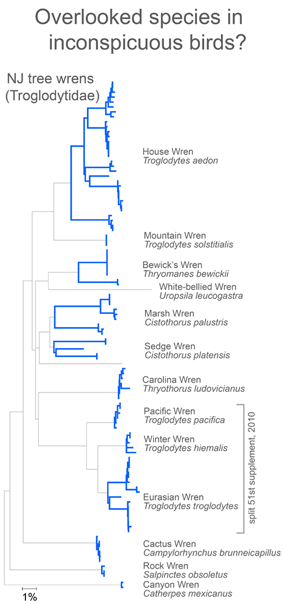 In closing this post, I look at whether there is anything unusual about divergent taxa that might lead them to be overlooked. After all, the world’s ornithologists have expended a lot of effort to uncover hidden diversity. I see most divergent species as falling into one of two categories: 1) inconspicuous birds, usually small, drab, secretive, or nocturnal species and 2) birds with large breeding ranges, particularly those that extend across different countries or islands.
The first group are difficult for visually-oriented, diurnal humans to distinguish and with the second group it is difficult to assemble sufficient specimens collected at widely dispersed sites. Where’s the evidence?
For small, drab, secretive birds, in figure at right I look at wrens, which based on results so far, have an exceptional degree of intra-specific diversity (highlighted in blue). In 2010 the Winter Wren Troglodytes troglodytes was split into 3 species by AOU, but there remains a lot of diversity in 5 of the 12 species with 2 or more records, including the newly named Eurasian Winter Wren T. troglodytes.
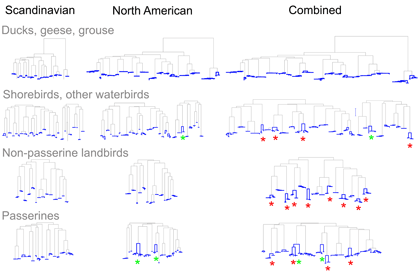
As evidence for hidden diversity in species with large ranges, I illustrate the findings from Johnsen et al 2010 “DNA barcoding of Scandinavian birds reveals divergences in trans-Atlantic species” . In this study 78 Scandinavian species had ranges that extended to North America; of these 24 (19%) showed large trans-Atlantic divergences in COI. In the figure, separate NJ trees for N American, Scandinavian, and combined data sets are shown with intraspecific differences highlighted in blue; red asterisks mark species with large trans-Atlantic divergences; green asterisks mark species with large divergences within N America. A small version of figure is shown, for larger version, click on picture.
In the next post, I look at the effect of sample size on intra- and inter-specific distances. 