In 2004, the American Ornithologists’ Union (AOU) (Banks et al. 45th supplement) recognized most of the smaller-bodied forms of Canada Goose (Branta canadensis) as a separate species, Cackling Goose (B. hutchinsii). It can be difficult to distinguish these birds in the field including for banders, as there is overlap between some of the smaller forms of candensis and the larger forms of hutchinsii (see for example David Sibley’s account). Given morphologic approximation in some cases, one might also expect a range of genetic differences between the species, with some Canada geese being very similar to some Cackling Geese.
Using COI as a genetic flashlight, a surprising finding to me is that sequence differences between species are generally fixed. Individuals of a species do differ from each other in COI, but they usually differ in ways that do not change the distances between species. There are exceptions, particularly with species that hybridize regularly, and perhaps with very young species, but these are a small minority of birds analyzed so far. Stated another way, for most species there are no genetically intermediate forms. One important corollary is that early results with small numbers of individuals are likely to be indicative of results with more comprehensive sampling, which is what has been seen with All Birds Barcoding Initiative (ABBI) to date.
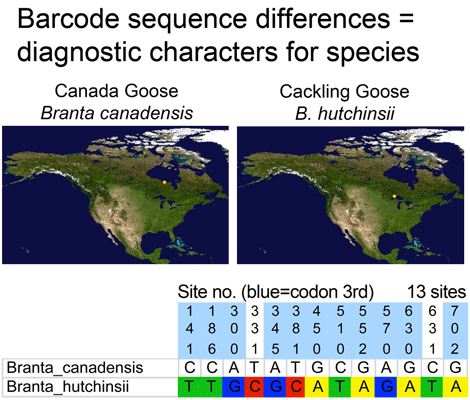
 Where’s the data? Here are some illustrations of results so far. For figure at left, I downloaded one B. canadensis and one B. hutchinsii barcode from public records section of BOLD (www.barcodinglife.org), and printed the map showing where each specimen was collected (a very useful tool in BOLD). For this and subsequent sequence analyses, I used publicly-available MEGA software to highlight all sites at which the two sequences differed. (In MEGA you click “variable” to highlight and then “export highlighted sites to Excel.” I then used Excel’s “conditional formatting” color the cells according to letter). These two sequences differed at 13 out of 653 COI positions, 11 of which were 3rd codon position (codon position may turn out to be interesting later on).
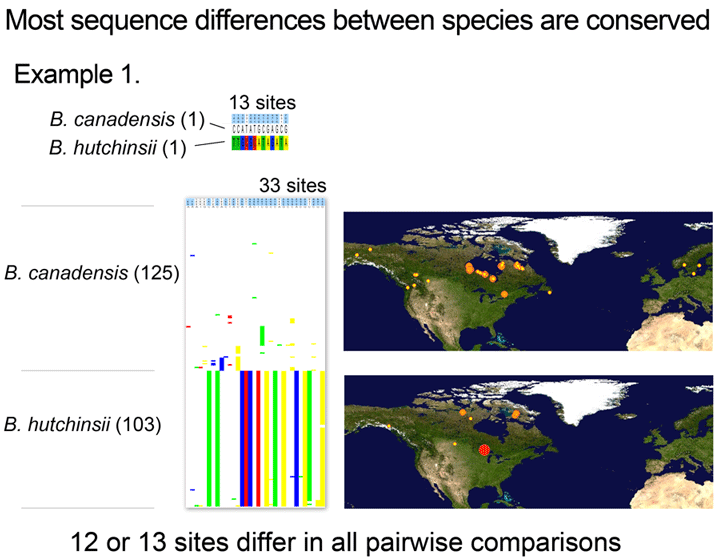
Now what happens if you analyze a larger number of individuals? For next illustration, I used BOLD Taxonomy Browser, navigated to Chordata-Aves-Anseriformes-Branta, downloaded all public sequences, and used MEGA as above to highlight and export all sites that differed among the set (there are several other Branta species; these were deselected for this analysis).
With over 100 individuals for each taxa collected at widely dispersed sites (including some canadensis in Norway and Sweden), variation within both species was observed. Most of this was scattered differences found in one or a few individuals, although there did appear to be a number of canadensis individuals with a shared variant, which might be of interest for further study.
However, the intraspecific variation rarely involved diagnostic sites, with the result that all pairwise comparisons between canadensis and hutchinsii differed at 12 or 13 sites.
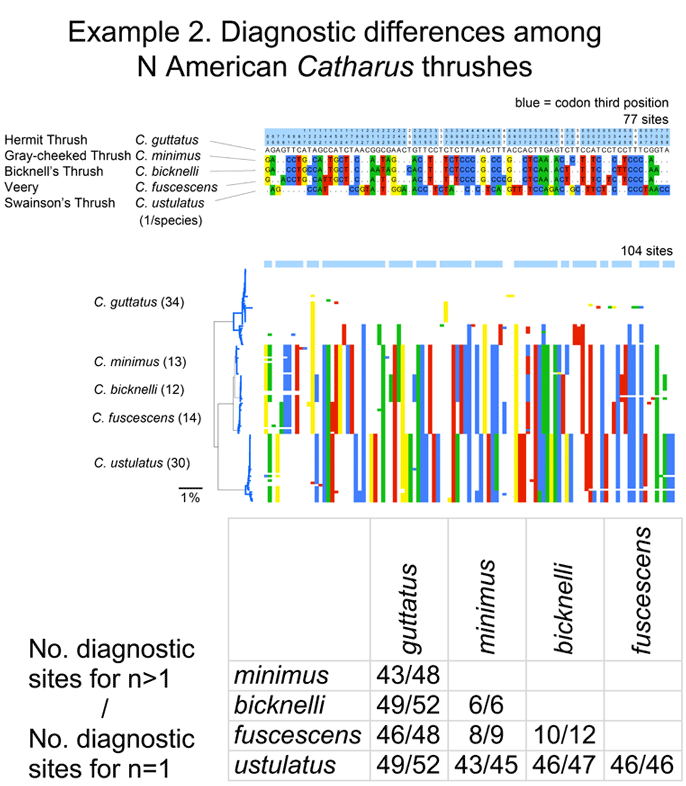
I close with another slightly more complex example. There are 5 Catharus thrushes in North America. These are relatively small, drab woodland birds with haunting, ethereal songs (you can listen to Hermit Thrush (C. guttatus) song on Cornell Laboratory of Ornithology site). One bird, Bicknell’s Thrush (C. bicknelli) was first recognized by AOU as a species distinct from Gray-cheeked Thrush (C. minimus) in 1998, and distinguishing individuals except by song is difficult even for experts with hand-held birds.
I downloaded all public Catharus barcodes using BOLD Taxonomy browser, and analyzed as described above. In comparing single sequences from the 5 species, these differed at 6 to 52 sites. With larger sample sizes (12-34/species), some intraspecific variation was observed, particularly in Hermit and Swainson’s Thrushes (see NJ tree at left of larger alignment), but diagnostic differences were mostly unchanged, even for very closely related minimus-bicknelli-fuscescens group.
[On a separate note–the nature of intraspecific variation might be of interest–a disproproportionate number are singletons (present in one individual in the set) and are codon first or second position substitutions (whereas most interspecific differences among closely-related birds are at codon third position). No doubt evolutionary biologists have investigated this previously, but perhaps not with such a large number and diversity of species with multiple individuals analyzed.]
These figures help illustrate the nucleotide sequence differences that distinguish species. In the language of evolutionary biology, these sequence differences are diagnostic characters. An NJ tree is a powerful shorthand way of representing these differences. In some situations, analyzing the actual diagnostic characters will be important. It might be a useful exercise for the scientific community to compile and display on the web diagnostic differences, at least for groups in which most or all the closely-related species have been surveyed.

