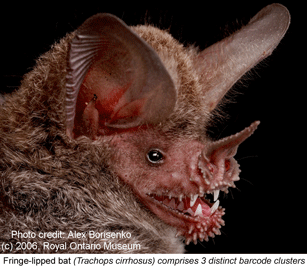
 Two papers in early online Mol Ecol Notes report large scale COI surveys of tropical bats and North American birds. In the first paper, Clare et al examined 840 specimens representing 87 (72%) of 121 known bat species in Guyana, each derived from vouchered specimens held at Royal Ontario Museum, including multiple individuals (range 2-74) from 73 (84%) of species. 81 of 87 species had distinct COI barcodes with average intraspecific variation of 0.6%. In the remaining 6 species, 15 distinct mitochondrial lineages were found which likely represent overlooked cryptic species.
As most bats are small brown animals that fly around at night emitting noises that humans cannot hear, it is not surprising that some have been overlooked, and it seems probable many new species will be found lurking in museum drawers. Even in relatively bat-poor temperate regions there may be hidden diversity. It was not until 1997 that Europe’s most abundant and best studied bat, the Pipistrelle (Pipistrellus pipistrellus, Schreber 1774) was suggested to be 2 species through DNA analysis, a hypothesis confirmed by biological covariants and official species designation in 1999.
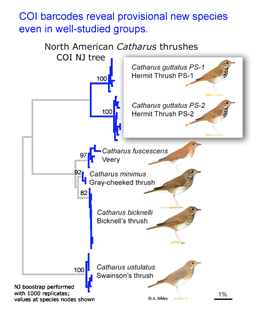
In the second paper, Kerr et al (I am a co-author) report a continental-scale survey of mtCOI sequences in North American birds, including 2590 individuals from 643 species, representing 93% of the breeding avifauna of Canada and the United States. 94% of species had distinct barcodes, and in the remaining 6%, barcode clusters corresponded to small sets of closely-related species, most of which hybridize regularly. Fifteen (2%) of currently-recognized species were comprised of two distinct barcode clusters, many of which may represent cryptic species.
 Birds being conspicuous, vocal, diurnal animals it is surprising that there are what appear to be overlooked species, even in an intensively-studied temperate region with relatively few species. Of course barcode clusters are not proof of species status, but to my knowledge all such divergent lineages either correspond to recognized species, or have subsequently been found to show biological covariants and have ultimately been granted species status.
Sequencing of large tissue collections housed in museums can be done relatively rapidly and inexpensively. It is a challenge on how to report results in a way that communicates the genetic findings in a timely fashion without trampling on the careful procedures designed to maintain order in taxonomy.
By using tissues derived from vouchered museum specimens, these barcoding studies lay the groundwork for subsequent taxonomic study. By analyzing a standardized region, DNA barcoding studies can be stitched together to create a large-scale map of biodiversity, a horizontal genomics approach mapping leaves on the tree of life.
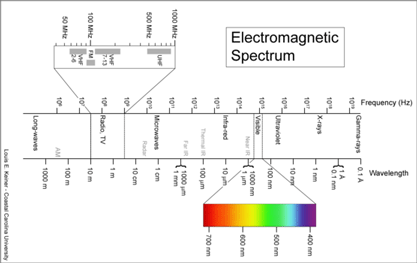
 I see the “barcode map of genetic diversity” as analogous to an astronomical sky map that uses just a slice of the electromagnetic spectrum. It does not contain all the information necessary to understand the universe, but by focusing on one part of the spectrum it enables results from various studies to be seamlessly combined and allows both large and small scale comparisions.