Suggested metric, terminology, and standard graphic
How well do barcodes distinguish among species? A standardized, simple quantitative method and terminology for comparing barcoding performance among different data sets will be helpful.
In trying to answer this question, I aim to promote terminology that does not include “error”. In my view, it generally does not make sense to talk about the error rate of barcoding. Barcoding is an instrument akin to a telescope, except that it is designed to resolve species, not stars. A telescope that does not resolve a double star is not wrong, it simply lacks sufficient resolution. Also, the term error rate implies there is an accurate reference standard in species identification. As systematists emphasize, species definitions are hypotheses and frequently undergo revision. Thus in this view barcoding performance, effectiveness, and resolution are useful descriptive terms and are more informative than barcoding error rate.
What we want is an approach that quantitatively compares barcoding with current taxonomy. In the future, taxonomy may incorporate some of the groups discovered through barcoding as recognized species, perhaps will combine some of the recognized species with overlapping barcodes into single species, and additional sequence data may enable resolution of species with overlapping barcodes. To start, a 2 x 2 table comparing recognized species to distinct barcode groups:

Suggested terminology:
Barcode group (or cluster): the shallowest branch in a neighbor-joining tree that corresponds to one or more recognized species or potential split within a recognized species.
Distinct barcodes: a barcode group that corresponds to a recognized species or a potential split within a recognized species. This definition can incorporate whatever criteria are used for recognizing splits (such as criteria that have been used to define provisional species, ESUs).
Barcode resolution: #barcode groups/total #species, in which total #species includes recognized species plus provisional species/ESUs.
This definition of barcode resolution incorporates “partially-resolved” species, so that if, for example, 8 species are resolved into 4 barcode groups, then resolution for that set would be 4/8 = 50%. Alternatively, if idea of partial resolution is not helpful, resolution could be defined more simply as a + b (green + yellow)/total #species.
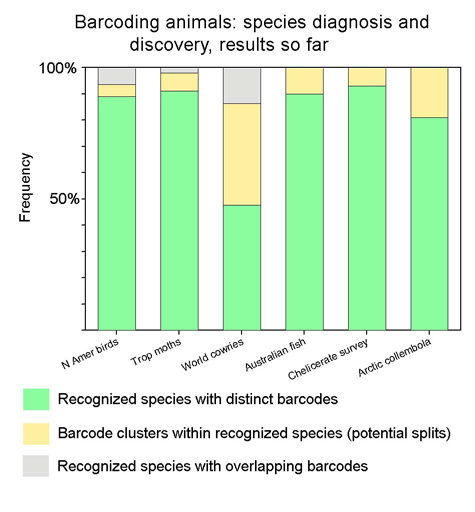
Suggested graphic: Applying this to recent barcode data sets:

Suggested color scheme: As in table, green (=good!) matches current taxonomy; yellow represents novel species/provisional species/ESUs (yellow like an early bud that lacks chlorophyll), and gray (as in a gray indeterminate zone) represents recognized species with overlapping barcodes. By definition, all potential splits/ESUs have distinct barcodes, so d) in the 2 x 2 table is blank. As barcode findings are incorporated into taxonomy, I expect that the proportion that is green will increase—the greening of barcoding and taxonomy!
Mark Stoeckle
1 thought on “Comparing barcoding performance”