Blog

Deepwater clam mtDNAs map in unexplored sequence territory

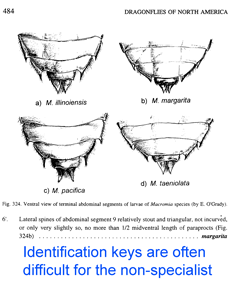
Approximately 8,000 – 15,000 species of bivalves (clams, mussels, scallops, oysters, and relatives) are known. According to BOLD Taxonomy Browser www.barcodinglife.org, 620 bivalve species have COI barcode records so far, so this group is relatively unexplored genetically. In September 2007 Zoologica Scripta researchers from University of Bergen, Norway, analyze COI barcode region sequences of 62 deepwater clams dredged in a single offshore region at 69 m to 567 m, morphologically identified as 12 species from 4 genera (Thyasira, Ennucula, Nucula, Yoldiella) representing 3 subclasses of Bivalvia. The COI barcode region was amplified with broad-range primers (Folmer et al 1994). Mean differences within species collected in this single area were small, 0.0 – 0.48%, similar to results in other animal groups, suggesting assignment of specimens to species will be straightforward. This will be helpful in environmental surveys for example, as some species “are infamous for being difficult to determine to species from morphology” and some “remain difficult to identify for the non-expert.” As one example, some Thyasira species are distinguished only by sperm and egg morphology, which is impractical in most circumstances.

https://www.conchology.be/en/home/home.phpmtDNA differences among these bivalves are remarkably large, even among species in the same genus. The differences among congeneric species in this sample (average 22%, range 12-42%) are larger than differences among entire class Aves (according to my analysis with BOLD software, COI differences among birds in different orders, such as penguins and hummingbirds for example, average 20%, with range 14-28%).

Blastn GenBank searches with these divergent mtDNA sequences showed very limited identity to anything, and the closest matches were short stretches (100-150 nucleotides of the 678 full-length barcode sequence) to COI sequences of species outside the phylum Mollusca (I obtained similar results submitting Thyasira sequences for example to the public BOLD Identification Engine at www.barcodinglife.org.)  It will be helpful if Mikkelsen et al deposit their sequences along with associated collecting data (voucher specimen information, images, collection locations) to the BOLD database. I look forward to learning more about these bivalves, and whether their remarkably deep differences in mtDNA are associated with deep physiological, ecological, or other biological differences.

Mapping biodiversity with DNA: sectors analyzed so far

As of 28 january 2008, there are 341,825 barcode records from 35,798 species in the Barcode of Life Database (BOLD) www.barcodinglife.org . What sectors of biodiversity have been analyzed so far? Here I follow the daily updated pages publicly available through “DNA Taxonomy Browser” link on BOLD home page. One can click downward through the taxonomic hierarchy from phyla to species, with a cogent summary at each level showing barcode records so far, contributing institutions and countries, and collection locations. The summary map shows remarkably good coverage of most terrestrial and coastal regions, and representation of nearly all countries. The open oceans are sparsely sampled so far, and remain an exciting terra incognita for biological exploration, including with DNA barcoding.  The global totals of 342K records/36K species work out to about 10 barcodes/species, and the average number of barcodes/species is similar at least down to the class level for most groups I looked at, suggesting a target of roughly 10 specimens per species is being achieved. 

The densest records so far are from Phylum Arthropoda (244,297), particularly insects (230,838), and of these mostly Lepidoptera (moths and butterflies) (169,145); and Phylum Chordata (74,720), particularly mammals (27,186), fish (26,752), and birds (12,770). There is broad sampling of other groups, including records from 376 animal orders in 80 classes representing 25 phyla. In addition, there are a few thousand records from fungi (3 phyla, 8 classes) plants (mostly red algae; 3 phyla, 8 classes), and protists (7 phyla, 11 classes), the latter of which DNA barcoding is likely to reveal as an enormous, deeply diverse group. 

The first paper proposing DNA barcoding was published in February 2003. The results displayed today on BOLD Taxonomy Browser demonstrate amazing progress in a short time, thanks to the inspiration and hard work of many! 

Natural Gas and the Jackrabbit

This a talk given by Jesse at the PowerSouth Energy Cooperative in Sandestin Florida on 22 January 2008 explaining why methane is green and destiny, and why renewables are neither green nor destiny.

Standardized DNA analysis gives new vision of biodiversity, disturbing some

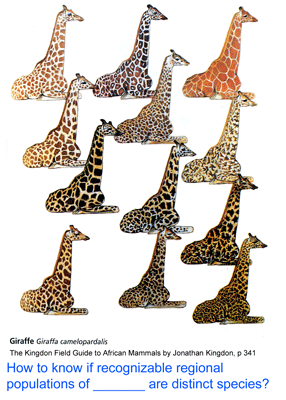
By identifying species (leaves) and determining how they are related (branches), taxonomy aims to reconstruct the Tree of Life. To do so taxonomists must distinguish variation within species from that between species, and identify the shared characters that reflect evolutionary ancestry. These tasks require highly-specialized sets of knowledge and skill for each animal and plant group. 

One result is that it has been difficult to compare patterns of diversification between different branches in the Tree. One might ask, how finely and how evenly divided is biodiversity? Are the differences among and within mosquito species (3,400 species), for example, similar to the differences among and within fruit flies (6,200 species) or birds (10,000 species)? Broad application of DNA analysis is beginning to provide some insights. To enable these sorts of comparisons, a standardized locus is needed, as unique genes can solve local branching patterns, but do not allow easy comparisons between branches.

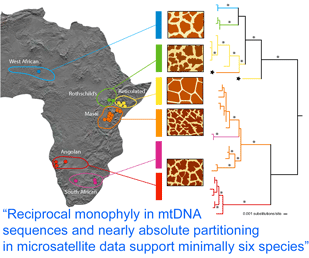
Large-scale surveys of standardized genetic loci, including COI barcoding, commonly reveal distinct groups within what was thought to be a single species. There is also the converse finding that in some cases COI barcode sequences do not distinguish named species, but generally this strikes me as a relatively minor scientific problem that usually involves very closely-related species pairs and can be solved where needed with more DNA sequence, assuming the underlying taxonomy is correct and the named species really are distinct. The greater scientific challenge is finding multiple groups within what appear morphologically to be single species. In many cases so far, organisms with genetically distinct COI barcode clusters show associated biological differences signalling they represent different species.

In December 2007 Mol Ecol 16:4999, researchers from Museum of Comparative Zoology, Harvard, examine genetic differences in Aoraki denticulata, a tiny (2-3 mm) daddy longlegs or harvestman spider found in leaf litter widely through New Zealand.  They determined COI barcode region sequences for 119 individuals from 17 localities in the mountainous northern part of South Island. The two described subspecies A. d. denticulata and A. d. major were genetically distinct. The surprising finding was there were at least 14 distinct clusters within A. d. denticulata, with a different group at almost every site, and 2 clusters at 3 of the sites. The differences between mtDNA clusters were as larger or larger than between other Aoraki species, up to 19.2%, but no morphologic differences were found even with electron microscopic scanning of males. Boyer et al observe “while it is conceivable that some of the geographically widespread populations…represent cryptic species, it is difficult to imagine that morphologically identical individuals from a single sample at a unique geographical point are not conspecific…it is hard to believe that almost every sampled locality would host at least one, if not two, cryptic species.”

Continue reading “Standardized DNA analysis gives new vision of biodiversity, disturbing some”

Taxonomy needs DNA, and quick, simple ways to analyze it

NOAA Alaska Fisheries CenterLumpsuckers are globular, scaleless marine fish with bony tubercles on head and body, and a ventral sucking disc, derived from specialized pelvic fins, which allows them to adhere to environmental substrates. The genus Eumicrotremus comprises 16 species distributed in the Arctic and northern Atlantic and Pacific oceans; the commonest and most widespread in the north Atlantic is the Spiny lumpsucker E. spinosus, which was first described by Fabricius in 1776. A new subspecies E. s. eggvinii was described in 1956, based on a single specimen, and this was later elevated to species level “on the basis of wrinkled skin, numerous dermal warts and a large sucking disk, in addition to the low number of bony tubercles.”

In August 2007 J Fish Biol 71A: 111, researchers from University of Bergen, Norway, analyze DNA and morphologic characters of E. eggvinii (n=16) and E. spinosus (n=67).  All specimens were easily classified by morphologic characters. However, the two species had identical mitochondrial DNA sequences (COI barcode region, COII, cytb) and identical nuclear gene Tmo-4C4. Further genetic testing revealed that E. eggvinii were all males, and E. spinosus were all females. The authors conclude that the two morphologically distinct “species” represent the sexually dimorphic forms of E. spinosus

In this study by Byrkjedal et al, identical mtDNA sequences suggested synonymy, and this in turn suggested that morphologic divergence might represent sexual dimorphism, confirmed by further genetic testing. To my reading, this study suggests DNA testing needs to be as commonplace in taxonomy as recording size, shape, and coloration, and counting rays in fins and placement of tubercles. Every new species should have a representative DNA sequence as part of the species description. For animals, the standard should be a COI barcode. One of the remaining impediments to widespread adoption is that simple protocols for sequencing COI barcode region need to be better disseminated. In this study, the researchers were able to recover COI barcode region using primers designed for invertebrates (Folmer et al 1994), although others have published primer pairs that have greatly increased effectiveness with diverse fish (Ward et al 2005, Ivanova et al 2007). Compiling primer pairs and amplification protocols and displaying this information prominently on the various barcoding web sites will help (see for example SpongeBOL home page www.spongebarcoding.org link to illustrated primer primer!). I close with note this is post #100 since the first DNA barcode blog entry of March 15, 2006!

Embedding standardized DNA analysis in taxonomic practice

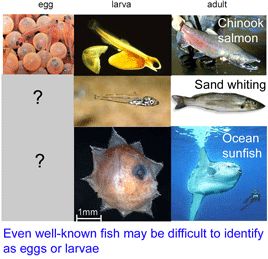
In 17 September 2007 Zootaxa (open access full article) researchers from Museo Nacional de Ciencias Naturales-CSIC, Madrid, make a plea for routinely incorporating standardized DNA sequence analysis, ie DNA barcoding, into modern taxonomic practice. In their view, “integrative taxonomists should use and produce DNA barcodes.” Of course, this is already happening in many areas, but new practices diffuse slowly through the fragmented world of taxonomy, and so Padial and de la Riva’s exhortation is an important step. With growing DNA barcode libraries and increasingly inexpensive sequencing technologies, DNA testing will likely be the fastest way to sort specimens into species and will enable identification of multiple forms that now go unnamed or misidentified while waiting for an expert, waiting for eggs and larva to mature, or waiting to find an identifiable adult male or a recognizable fragment in stomach contents.

One might view taxonomic science as an effort to construct detailed, reliable “maps” of species and their historical relationships. Adopting Padial’s and de la Riva’s advice to routinely “use and produce DNA barcodes” will speed taxonomic research and, more importantly, will naturally produce a “map of species” with general scientific and public utility. Few persons can have the requisite knowledge to distinguish larval fish for example, whereas anyone can submit a sample for DNA sequence analysis. In this way, a DNA barcode library is a map of species, one that anyone can read with the right device, a DNA sequencer. Of course, more work is needed to identify the best approaches for assigning sequences to named species and for flagging divergent sequence clusters that might represent new species. With improved analytic software and as more species and specimens per species are analyzed, the reliability of DNA barcode maps will increase. Based on results so far, I expect rapid growth in mail-order identification services, analogous to today’s DNA ancestry companies, that do DNA barcode analysis of submitted specimens, and, as others have envisioned, soon enough there will be table-top or hand-held devices that pinpoint where the specimen in hand belongs on the biodiversity map. Best wishes to all this holiday season!