Jesse drafted a foreword, The Beep of the Barcode of Life, for the forthcoming book about DNA barcodes of John Kress and David Erickson. The final version will differ a bit
Blog
Top predators project – Census of Marine Life
A new Nature paper by Barbara Block et al. of the top predators project of the Census of Marine Life, Tracking apex marine predator movements in a dynamic ocean, earns wide attention, Nature, Published online 22 June 2011, doi:10.1038/nature10082 including in the Washington Post and the German language media, which also quote Jesse.
Quiet Ocean Experiment
“An International Quiet Ocean Experiment,†co-authored by Jesse and 22 colleagues led by Ian Boyd and George Frisk, appears in the June 2011 issue of Oceanography magazine. The paper and project derive from Jesse’s 20 May 2009 commencement address at Dalhousie University
News Flashes
 You have 1 more day! Abstract deadline is 12 midnight tomorrow, June 15, for the Fourth International Barcode of Life Conference, Adelaide, Australia, 28 November-3 December 2011. Online submission form here.
Young scientists to help document what lives on Earth! Coastal Marine BioLabs (CMB), a private, research-based scientific educational organization in Ventura, California was awarded a 3-year NSF grant to train high school teachers and students in DNA barcoding, with the goal of contributing reference sequences to Barcode of Life Database. CMB students and their teachers will be part of the International Barcode of Life project, which aims to expand BOLD (currently about 1.2M barcodes from 130K species) to 5M records from 500K species, the largest biodiversity intiative ever. For more on how students are helping build the genetic database of global species diversity, see Sacramento Bee news story and CMB web page.

Barcode of Life Connect tops 1000 members! If you haven’t already, I encourage you to visit and join the Barcode of Life Connect site, a “network to allow DNA barcoding professionals to discuss issues, share profiles, form special interest groups, and more.”The more includes webinars and links to upcoming relevant conferences. The core of the site is the chance to connect with like-minded barcoding professionals, either directly through their profiles or through discussion groups–so far there are 40 groups ranging from “Medicinal Plants” to “Madagascar” and “Portugese-Speaking Barcoders.”
To get an idea of how barcoding has taken hold around the world, particularly with young scientists, try perusing recent pictures posted by Connect members–I take the liberty of re-posting some images of the investigators and their specimens-enjoy!
Nighttime Illumination
Concerned about ecological effects of nighttime illumination, we take note of an important research project on ‘Loss of the Night’ of Franz Hoelker and colleagues in Berlin:
Forest Density Press Release 5 June 2011
The Press Release announcing the publication of our analysis on changes in forest density in nations around the globe, performed in conjunction with researchers at the University of Helsinki, provides a helpful map of changes in forest density for those nations studied in the paper:. Rautiainen A, Wernick I, Waggoner PE, Ausubel JH, Kauppi PE, 2011 A National and International Analysis of Changing Forest DensityPLoS ONE 6(5): e19577.
The Sunday 5 June publishes an excellent article about forests by Andrew Marszal that reports on our recent analysis of forest density. http://www.independent.co.uk/environment/nature/forests-fight-back-all-over-the-world-2293215.html
The Sunday 5 June Independent published an excellent article about forests by Andrew Marszal that reports on our recent analysis of forest density.
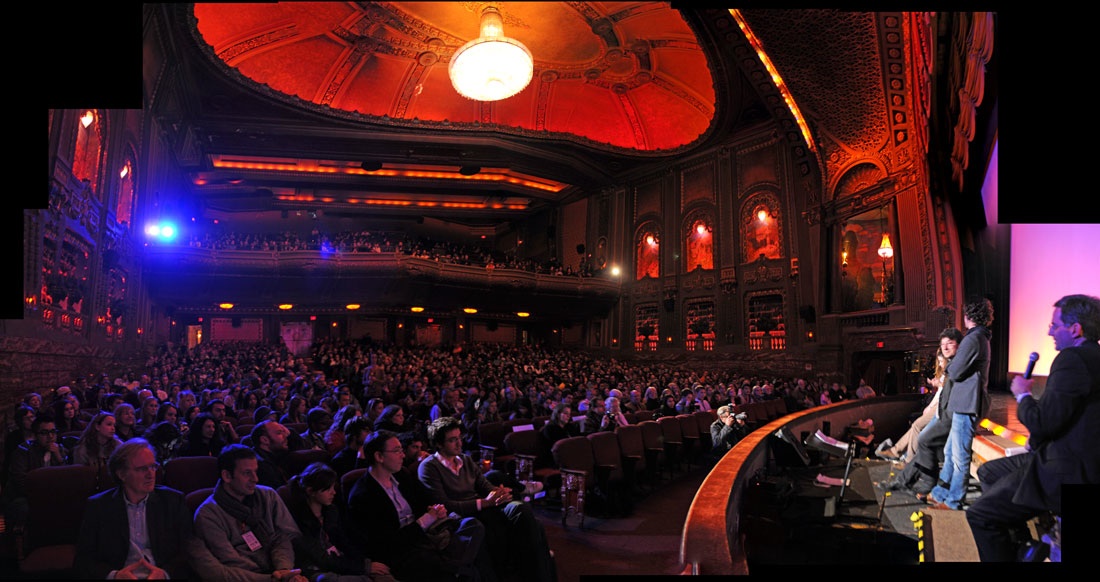
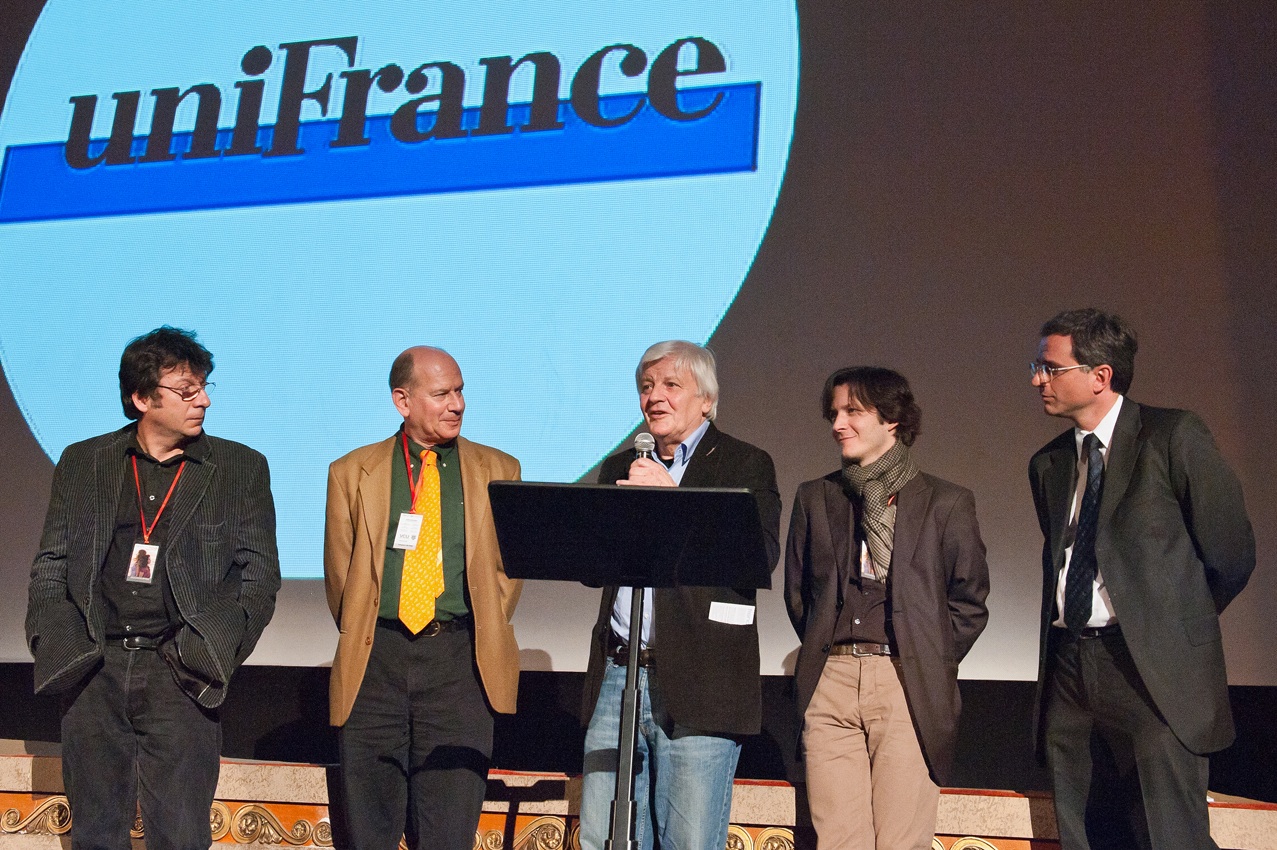
French Film Festival in Richmond VA
On Saturday 26 March 2011 the annual French Film Festival in Richmond VA organized by Peter and Francoise Kirkpatrick featured Galatee’s film Oceans. Over 1000 people filled the magnificent Byrd Theater and also asked questions about the film to filmmakers Jacques Perrin, Olli Barbe, and Mathieu Simonet and science advisor Jesse Ausubel in a discussion moderated by Peter Kirkpatrick. We post photos of the theatre and panel.
On February 18, 2011 the Martha’s Vineyard Gazette ran a story about Jesse and the Census of Marine Life
On February 18, 2011 the Martha’s Vineyard Gazette ran a story about Jesse and the Census of Marine Life, including the new lobster Dinochelus ausubeli.
New York Times profile of PHE Director Jesse Ausubel April 26, 2011
On 26 April the New York Times ran a profile by Nicholas Wade about the span of Jesse’s career, “Commodore of a Global DNA Census.â€