Indicator Vector and TreeParser Software for Generating Klee diagrams
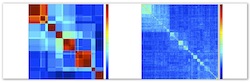
Klee diagrams generated by indicator vector analysis are alternatives to trees for representing nucleotide sequence alignments (Sirovich et al 2009, 2010). Indicator vectors are digital representations of nucleotide sequences in vector space, and can represent single sequences or sets of sequences. Indicator vector correlations, which are similar but not identical to distances, are displayed in a Klee diagram, a heat map of the indicator vector correlation matrix. The indicator vector/Klee method is computationally and visually scalable to large sets of aligned sequences–it readily displays patterns among 10K sequences in a single-page figure, for example.
What follows is a step-by-step protocol for applying indicator vector analysis to a set of aligned nucleotide sequences.
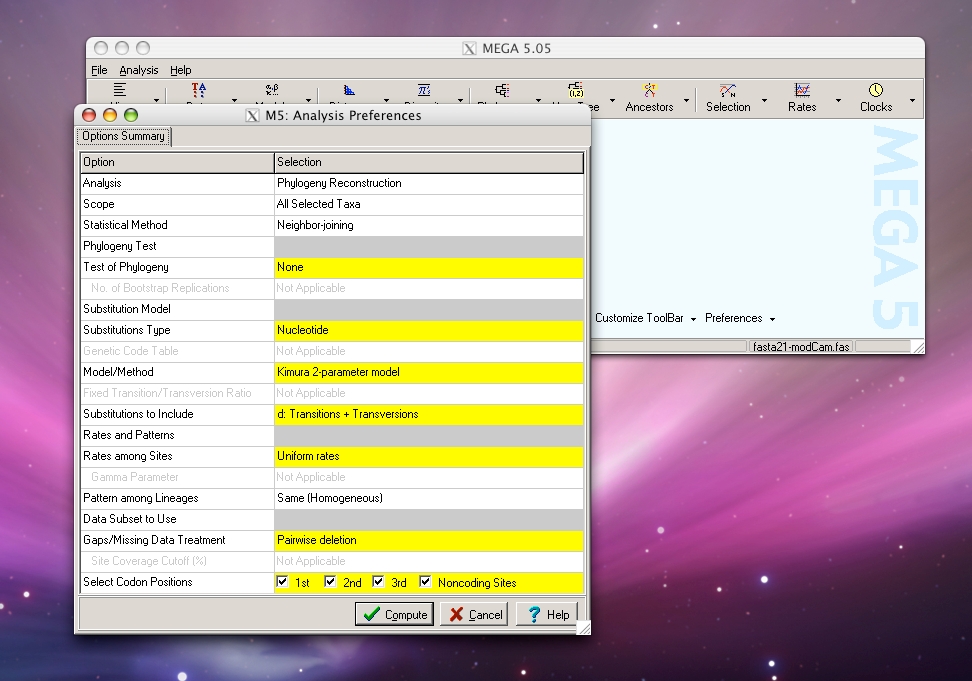
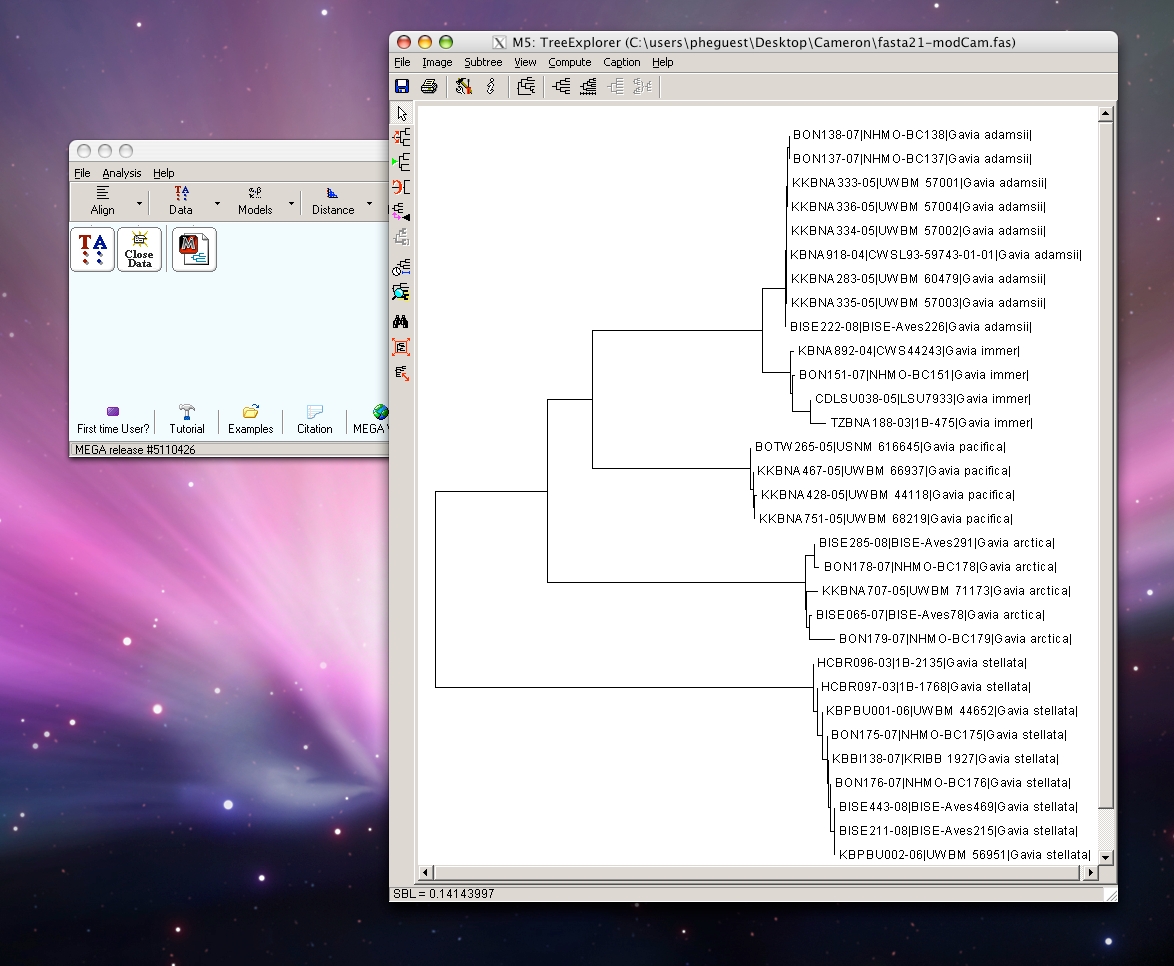
The order of sequences in an alignment does not affect indicator vector calculations. However, for the resulting Klee diagram, it is useful to arrange the sequences to approximate evolutionary relationships. Here we provide a web-based program, TreeParser, that arranges aligned sequences to follow the order of terminals in a phylogenetic tree. TreeParser input files are 1) an aligned fasta file and 2) a Newick tree file in text format, and the output is a re-ordered .fas file. The example below utilizes a neighbor-joining (NJ) tree generated in MEGA as the template for ordering sequences.
Sirovich L, Stoeckle MY, Zhang Y (2009) A scalable method for analysis and display of DNA sequences. PLoS ONE 4:e7051.
Sirovich L, Stoeckle MY, Zhang Y (2010) Structural analysis of biodiversity. PLoS ONE 5:e9266.
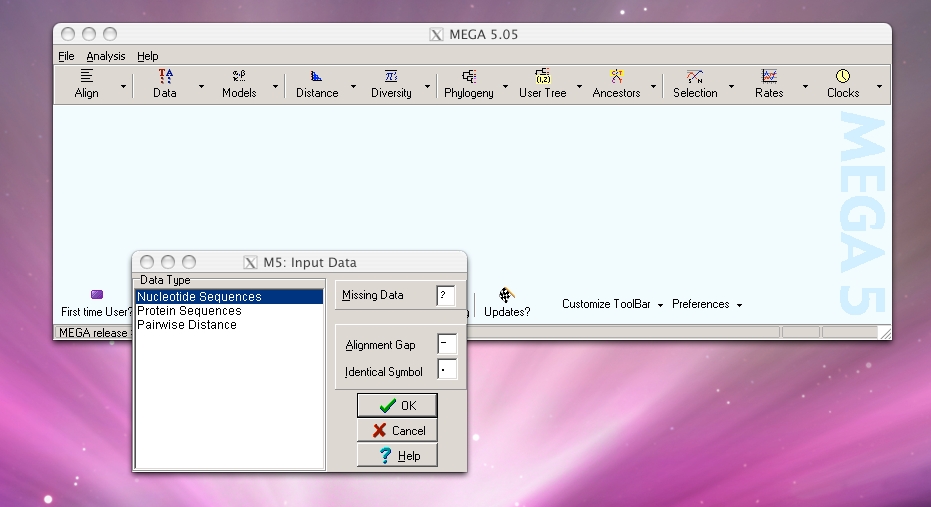
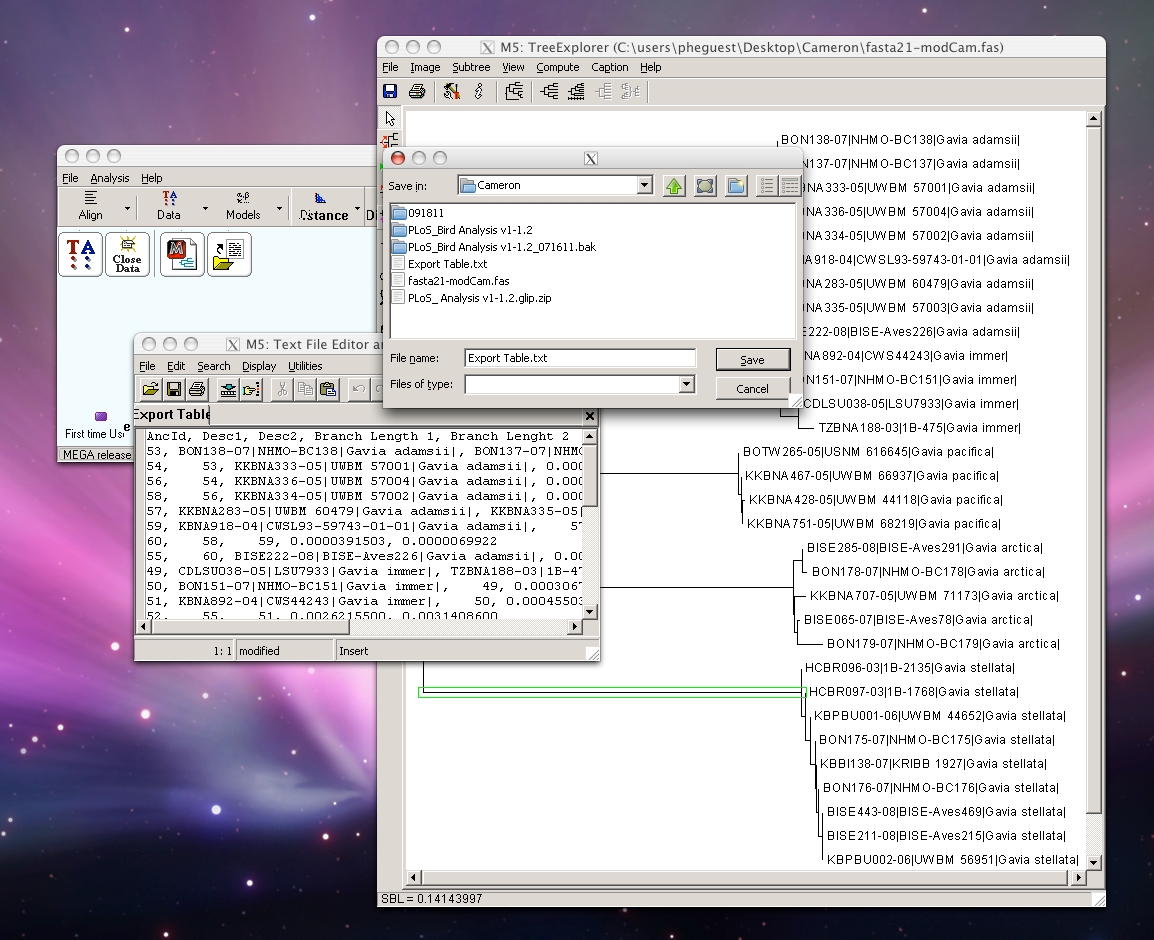
Step 1: Run FASTA file through MEGA to create a phylogenetic tree. Under File menu, select “Write Tree in Table Format”, then save output as text file.
Step 2: Upload your FASTA file and the MEGA tree text file to TreeParser software using windows below. (Large files may take a few minutes to process)
FASTA file
Tree file
Position of unique sequence identifier in .fas file header:
1 2 3 4 Use entire header of each FASTA sequence
sample .fas file header:
>position1|position2|position3|position4|
OR
Run sample data (ignore file uploads and parameter. View sample Fasta and sample Tree files)
Download results
Step 3: Upload TreeParser output FASTA file to the Indicator Vector program.
Downloads:
Download the source code for Tree Parser (PHP saved as .txt, change to .php extension) here
Download the source code for Indicator Vector Klee Diagram (Matlab) here
MEGA software can be downloaded here. Click on the images below for instructions on using MEGA.
About the Bar Code of Life site
This web site is an outgrowth of
the Taxonomy, DNA, and Barcode of Life meeting held at Banbury
Center, Cold Spring Harbor Laboratory, September 9-12, 2003.
It is managed by Mark Stoeckle at the Program
for the Human Environment (PHE) at The Rockefeller University.
Contact: mark.stoeckle@rockefeller.edu
About the Program
for the Human Environment
The involvement of the Program for the Human Environment in DNA
barcoding dates to Jesse Ausubel's attendance in February 2002
at a conference in Nova Scotia organized by the Canadian Center
for Marine Biodiversity. At the conference, Paul Hebert
presented for the first time his concept of large-scale DNA
barcoding for species identification. Impressed by the
potential for this technology to address difficult challenges
in the Census of Marine Life, Jesse agreed with Paul on
encouraging a conference to explore the contribution
taxonomy and DNA could make to the Census as well as other large-scale
terrestrial efforts. In his capacity as a Program Director of
the Sloan Foundation, Jesse turned to the Banbury Conference
Center of Cold Spring Harbor Laboratory, whose leader Jan
Witkowski prepared a strong proposal to explore both the
scientific reliability of barcoding and the processes that
might bring it to broad application. Concurrently, PHE
researcher Mark Stoeckle began to work with the Hebert lab on
analytic studies of barcoding in birds. Our involvement in
barcoding now takes 3 forms: assisting the organizational
development of the Consortium for the Barcode of Life and the
Barcode of Life Initiative; contributing to the scientific
development of the field, especially by studies in birds, and
contributing to public understanding of the science and
technology of barcoding and its applications through improved
visualization techniques and preparation of brochures and other
broadly accessible means, including this website. While the
Sloan Foundation continues to support CBOL through a grant to
the Smithsonian Institution, it does not provide financial
support for barcoding research itself or support to the PHE for
its research in this field.