Visualizing birds: Part 3. DNA barcode’s-eye view of taxonomic practice
Who decides what is a species and how do they do so? The primary source of information related to species is the peer-reviewed scientific literature, with standards of evidence presumably applied by appropriate experts before an article is accepted for publication. For most groups of animals, once a new species description or revision is published, then it is considered a valid species.
For birds, there is often an additional layer of review in the form of expert committees and handbook authors. Committees and their geographic domains include the American Ornithologists’ Union (AOU) (North and South America), British Ornithologists’ Union (Britain), International Ornithological Congress (IOC) (world), and International Taxonomic Information System (ITIS) (world), plus many nations maintain their own lists; handbooks include Howard and Moore Complete Checklist of the Birds of the World (most recent edition published in 2003), The Clements’ Checklist of Birds of the World (most recent edition 2007, with updates available online), and Handbook of Birds of the World (first volume covering ostriches to ducks published in 1992, 16th and final volume covering tanagers to blackbirds to be published this year). Phew, it’s tiring just listing the lists! Although by my assessment the various lists are about 90% concordant at species level, they do differ, only partly because some have been updated more recently, so we can observe that experts sometimes disagree on species limits in birds, and conclude that taxonomy, like medical diagnosis, involves human judgment. 
Here I focus on AOU Check-list of North American Birds, picking out just those species that have been revised since the 6th edition (1983). The current Check-list is the 7th edition (1998) plus updates which are published annually since 2003. Over this time by my count there have been 274 changes in species definitions; this includes 6 species lumped into 3, and 121 species split into 268 taxa (note: splitting changes both halves–one is new, and the “parent” taxa has been pared down). The 50:1 predominance of splits suggests a bias against lumping species, perhaps analogous to the bias in medical research against negative studies.
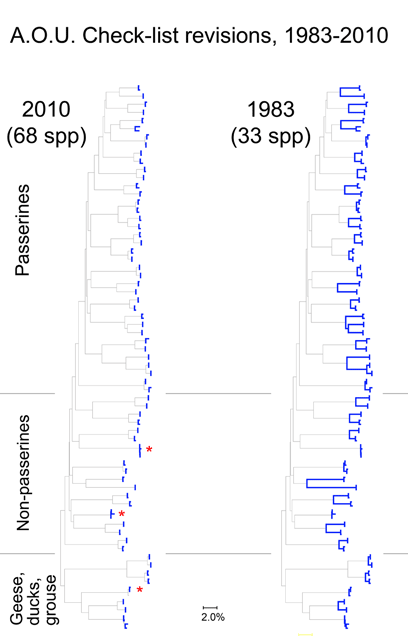
For the figure at left, I compiled all revised species for which COI barcodes were available for both sides of a split or lump, which worked out to 68 species by 2010 definitions (all the available sets were splits), picked two representatives for each, and generated an NJ tree. This represents about 1/4 of all revisions so presumably is representative. Species differences according to 2010 or 1983 definitions are highlighted in blue. Red asterisks mark 3 splits not distinguishable by COI barcode.
Viewed through the lens of DNA barcodes, 91% of revisions involved assigning different names to distinct clusters previously grouped under one name. None of revisions led to taxa with larger intraspecific distances. 
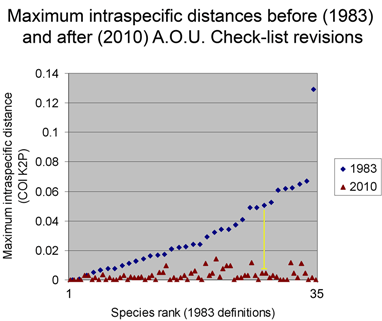
Below is another way of looking at same data–a before and after graph of maximum intraspecific distances (similar to layout in yesterday’s figure, maximum 2010 distances appear below that for the 1983 “parent” taxa; the yellow line highlights one such set; there are two 3-way split in the NJ tree, each of which is shown here as two separate splits.).
One of my reactions to these figures is that taxonomic revision looks pretty simple! On a more helpful note, I think we can observe that what taxonomists consider species based on traditional biological criteria (differences in morphology, song, range, and relative absence of interbreeding) are generally visible with a “COI flashlight” as distinct clusters. As noted in the first post, why this is so is an important unsolved question.
From the above I surmise that essentially all species with unusually large intraspecific distances will eventually be recognized as comprised of distinct species. (Of course there are exceptions, which are interesting.) This echoes an assessment by Zink in 2004 (Proc Biol Sci 2004 271: 561–564). He noted the widespread discordance of mitochondrial DNA divergences and species-level classifications, concluding “a massive reorganization of classifications is required so that the lowest ranks, be they species or subspecies, reflect evolutionary diversity.” Looking at revisionary progress over the past 30 years, I think we are moving very slowly toward that goal, raising the possibility of a more dedicated effort to speed species-level avian taxonomy.
 In closing this post, I look at whether there is anything unusual about divergent taxa that might lead them to be overlooked. After all, the world’s ornithologists have expended a lot of effort to uncover hidden diversity. I see most divergent species as falling into one of two categories: 1) inconspicuous birds, usually small, drab, secretive, or nocturnal species and 2) birds with large breeding ranges, particularly those that extend across different countries or islands.
The first group are difficult for visually-oriented, diurnal humans to distinguish and with the second group it is difficult to assemble sufficient specimens collected at widely dispersed sites. Where’s the evidence?
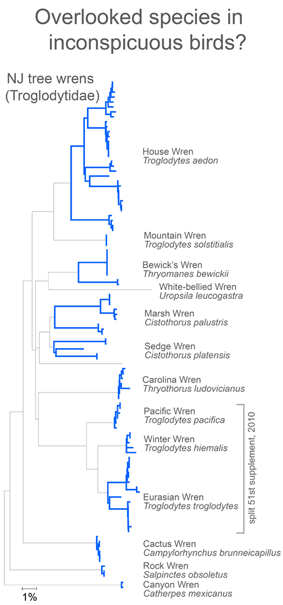
For small, drab, secretive birds, in figure at right I look at wrens, which based on results so far, have an exceptional degree of intra-specific diversity (highlighted in blue). In 2010 the Winter Wren Troglodytes troglodytes was split into 3 species by AOU, but there remains a lot of diversity in 5 of the 12 species with 2 or more records, including the newly named Eurasian Winter Wren T. troglodytes.
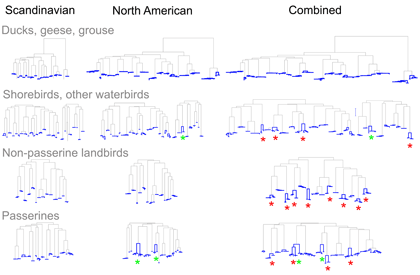
As evidence for hidden diversity in species with large ranges, I illustrate the findings from Johnsen et al 2010 “DNA barcoding of Scandinavian birds reveals divergences in trans-Atlantic species” . In this study 78 Scandinavian species had ranges that extended to North America; of these 24 (19%) showed large trans-Atlantic divergences in COI. In the figure, separate NJ trees for N American, Scandinavian, and combined data sets are shown with intraspecific differences highlighted in blue; red asterisks mark species with large trans-Atlantic divergences; green asterisks mark species with large divergences within N America. A small version of figure is shown, for larger version, click on picture.
In the next post, I look at the effect of sample size on intra- and inter-specific distances. 
This entry was posted on Wednesday, March 23rd, 2011 at 9:46 pm and is filed under General. You can follow any responses to this entry through the RSS 2.0 feed. Both comments and pings are currently closed.