Visualizing birds: Part 2. Distant clusters, unfinished taxonomy
In 1911, Rutherford proposed correctly that essentially all the mass of an atom is concentrated in a tiny “central charge” (what we now call the nucleus) and that the rest of an atom was essentially empty space, devoid of mass (https://en.wikipedia.org/wiki/Rutherford_model). This comes to mind in looking at results so far with birds, which overwhelmingly show that mtDNA differences are partitioned into tight clusters, and conversely most of the nearby genetic “space” is empty. In the language of evolutionary science, living organisms are narrow discontinuities without intermediate forms.
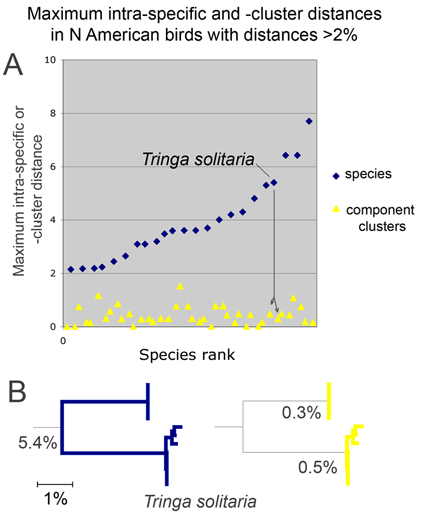
 In yesterday’s post I noted that a minority of avian species exhibit large intra-specific distances. One possibility is that these represent species with a wide and more or less continuous variation, like the distribution of height in humans, for example. A quick perusal of an NJ (neighbor-joining) tree shows this is not the case. Rather, as noted in all published surveys so far, species with large intraspecific distances are composed of distinct clusters. As an alternative to an NJ tree, here is another way of looking at this data. For the illustration at left I took all species in N American project (Kerr et al 2007) with maximum distances of 2% or more, sorted sequences into sets as indicated by the NJ tree, calculated the maximum distances within each component cluster, and graphed these so that maximum distances within component clusters appear below the respective point for the species. In this analysis, all species with large intraspecific distances were composed of 2 clusters with much lower variation. In all cases, large intraspecific values reflected comparisons across the branches of the tree. One way of looking at this is that mtDNA sequence clustering is same in species with high and low maximum distances. What differs is that species with large intraspecific distances include multiple clusters.
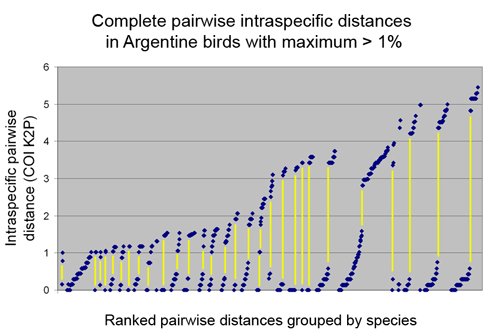
 At right is another way of looking at this. Here I used all species in Argentinian dataset (Kerr et al 2009) with maximum intraspecific distances of 1% or greater. For each species, the graph shows ALL pairwise distances ranked in increasing order, and a yellow line connects lower and upper pairwise values for each species. If species exhibit a range of differences, then there should be a more or less continuous range of pairwise values. On the other hand, if species are composed of clusters, then there will be one set of small pairwise distances from comparisons within clusters, and a set of larger distances from comparisons between clusters. With one exception (the second species from the left) large intraspecific distances reflected the presence of distinct clusters included under a single umbrella species designation.
So where are we? Can we conclude that there is a minority of species that are genetically polytypic? One way to answer this is to look at recent taxonomic revisions in birds, taking advantage of the extremely well-documented historical record in the form of updates to the American Ornithologists’ Union (AOU) Check-list. In the next post I will look at refinements to avian species taxonomy through the lens of COI barcodes.
This entry was posted on Tuesday, March 22nd, 2011 at 10:25 pm and is filed under General. You can follow any responses to this entry through the RSS 2.0 feed. Both comments and pings are currently closed.