Area of Research: Technology & Human Environment
Will the Rest of the World Live Like America?
Can Technology Spare the Earth?
Evolving efficiencies in our use of resources suggest that technology can restore the environment even as population grows
(NOTE: The color figures are at the end of this document for easier online reading)
Technologies have enabled us to expand our range and transform the earth. In 1909 Peary sledded to the North Pole, and in 1911 Amundsen reached the South. Improved navigational aids and ships that could withstand the pack ice made the poles accessible to men and dogs. Less than a century later we worry about the environmental purity of the polar regions and the ozone that shields them. My fundamental question is whether the technology that has conquered the earth can also spare it. To answer this question, I shall examine secular trends in what technology does with four paramount resources: energy, materials, land and water. I focus on the evolving efficiency of use of these resources. Economists call such resources “factors of production,” along with labor and capital.
Customarily, technology’s relation to environment is considered by evaluating lists of devices and machines: cars, oil tankers, nuclear power stations, windmills, wastewater-treatment plants, spray cans and chain saws. My approach is more basic. I ask whether technology enables us to obtain services more efficiently and, if so, at what rates. The answers indicate the feasibility of greatly diminishing our environmental burdens by increasing the productivity of our resources.
Analysts, eager to assimilate the latest information, live life on the tangent, extrapolating brief fluctuations to eternity. To counter this tendency, I search for stable signals amid the noise of the daily news. The historical analyses shared here, many contributed to an ongoing project at The Rockefeller University on technological trajectories and the human environment, seek the inherent lifetimes of processes of technological development, which can extend generations and centuries. Recognizing and formally analyzing incomplete developmental processes and the rhythmic patterns of processes permits confident prediction.
Identifying secular trends also enables me to frame answers to a second question: what distinguishes the last half-century or so with regard to environment and technology. The years around 1970 marked the maximum rate of growth of human population in modern times. Have we more generally passed a point of inflection in the curve of human development? Finally, what present actions will wave us toward sweet, greener days?
Two basic arguments weigh against technology. One is that technology’s success is self-defeating. Technology makes the human niche elastic. If we solve problems, our population grows and creates further, eventually insurmountable problems. The cardinal case is the conquest of death in developing countries. Public-health measures and modern medicine defeat mortality, while fertility declines at a much slower pace, and so population explodes. Before dosing, I shall consider technology’s relation to population. Population is always the catch.
The second argument contra-technology is the paucity of human wisdom. Technology creates handguns and hydrogen bombs, and these kill. We can use science and technology to provide goods and services for human sustenance and comfort and other purposes worthy for the planet. But technology powers good and evil. Some would feel more comfort with less power. I leave it to others to discuss the cultural controls to assure constructive use of science and technology.
A subordinate, manageable argument is that unanticipated consequences of the introduction of technologies diminish their value. Chlorinated fluorocarbons solved the problem of explosive and inefficient ammonia based refrigerators, but turned out 40 years after their introduction to threaten life’s stratospheric filter. The appropriate response is a feedback system: Assess technologies early in their prospective social penetration, watch them thereafter for surprises and tailor designs to fit changing needs and tastes.
I outline a global picture, with most detail from the United States. For more than a century the United States has on average adopted technologies earliest, diffused them fullest and documented the outcomes. The symptoms and cures show.
Energy
Energy systems extend from the mining of coal through the generation and transmission of electricity to the artificial light that enables the reader to see this page. For environmental technologists, two central questions define the energy system. First, is the efficiency increasing? Second, is the carbon used to deliver energy to the final user declining?
Energy efficiency has been gaining in many segments, probably for thousands of years. Think of all the designs and devices to improve fireplaces and chimneys. Or consider the improvement in motors and lamps (Figure 2). About 1700 the quest began to build efficient engines, at first with steam. Three hundred years have increased the efficiency of generators from 1 to about 50 percent of the apparent limit, the latter achieved by today’s best gas turbines. Fuel cells can advance efficiency to 70 percent. They will require about 50 years to do so, if the socio-technical clock continues to tick at its established rate. In 300 years, physical laws may finally arrest our engine progress.
Whereas centuries measure the struggle to improve generators, lamps brighten with each decade. A new design proposes to bombard sulfur with microwaves. One such bulb the size of a golf ball could purportedly produce the same amount of light as hundreds of high-intensity mercury-vapor lamps, with a quality of light comparable to sunlight. The current 100-year pulse of improvement evident in Figure 2 will surely not extinguish ideas for illumination The next century may reveal quite new ways to see in the dark For example, nightglasses, the mirror image of sunglasses, could make the objects of night visible with a few milliwatts.
Segments of the energy economy have advanced impressively toward local ceilings of 100 percent efficiency. However, modem economies still work far from the limit of system efficiency because system efficiency is multiplicative, not additive. In fact, if we define efficiency as the ratio of the theoretical minimum to the actual energy consumption for the same goods and services, modern economies probably run at less than 5 percent efficiency for the full chain from extracting primary energy to delivery of the service to the final user. So, far from a ceiling, the United States has averaged about 1 percent less energy to produce a good or service each year since about 1800. At that pace of advance, total efficiency will still approach only 15 percent by 2100. Because of some losses difficult to avoid in each link of the chain, the thermodynamic efficiency of the total system in practice could probably never exceed 50 percent. Still, in 1995 we are early in the game.
What about the decarbonization of the energy system? Carbon matters because it blackens lungs, causes air pollution and oil spills and regulates climate. Carbon is also a surrogate for sulfur, heavy metals and other environmental bads that attach to it in the dirty fossil fuels. Carbon enters the energy economy bonded with hydrogen as wood (and other biomass), coal, oil and natural gas. Per unit of energy, wood weighs most heavily in carbon, followed by coal, and then oil, with natural gas following as much the lightest.
One can measure decarbonization in several different ways. The upper graph in Figure 4 shows the changing carbon intensity of primary energy for the world, where tons of carbon are divided by the total energy produced. This perspective shows that the long-term rate of decarbonization of the energy system is about 0.3 percent per year. Plentiful natural gas, efficient turbines and thrifty end-use devices promise more energy delivered with less carbon during the next decades.
Uranium also decarbonizes. At the end of 1993 432 operating nuclear reactors prodded almost 20 percent of the world’s electricity. Even if a fraction of the 48 listed in 1994 as under construction never operate, the remainder assure a continuing nuclear contribution to decarbonization. The radioactive reactor products, which are toxic and also hard and slow to degrade, and potentially powerful explosives, must of course be safely isolated. Solar sources also decarbonize but continue to stumble over obstacles in energy storage and transport.
Consider decarbonization also as the diminishing carbon intensity of the economies of a range of countries. Measured as the ratio of kilograms of carbon to gross domestic product and taking into account fuelwood and other renewable sources of energy, the decarbonization of dozens of nations studied, including Turkey, Thailand and China as well as the United Kingdom, Germany and Japan, has advanced almost in parallel. Countries begin at different times from different situations, but once they begin to decarbonize, they advance at about the same rates, and irreversibly, so far. Between 1970 and 1993, even the gas-guzzling United States more than doubled the ratio of its income to carbon use, decarbonizing about 3 percent per year. The spectrum of achievement, from about 3 kilograms of carbon per dollar of output in China to less than 0.2 in Japan and France, shows the distance most of the world economy stands from leading practice. The carbon intensity of the Chinese and Indian economies resembles the Japanese, American and European at the outset of industrialization in the 19th century.
Fundamentally, decarbonization tracks a technological competition between combustible elements. In the hydrocarbons, the truly desirable element for energy generation is not the carbon but the hydrocarbon. The evolution of the atomic ration of hydrogen to carbon in the world fuel mix displays the gradual and unrelenting penetration of the energy market by the number one element of the periodic table (Figure 4, bottom).
All these analyses imply that during the next 100 years the human economy will clear most of the carbon from its system and move, via natural gas, to a hydrogen metabolism, Hydrogen, fortunately, is the immaterial material. It can be manufactured from something abundant, namely water, it can substitute for most solid, liquid and gaseous fuels in use, and the product of its combustion, water vapor, does not pollute. The next decades will see a vigorous growth in the hydrogen industry. Nightly nuclear heat seeking a market outlet can efficiently steam-reform natural gas into hydrogen and carbon dioxide, the latter permanently reinjected into the gas fields from whence it came. Later, heat, nuclear or solar, can neatly decompose water.
Hydrogen, of course, requires a partner, electricity, to provide action at a distance in a clean energy system. Since Edison began the commercial industry in the 1880s, the electrical system has grown in two neat pulses each lasting about 50 years, synchronized with long cycles of economic growth. A new pulse of growth should soon begin, in which electricity powers not only more information products but also more of the transport system, using linear motors. The magnetically levitated train soon to operate between Hamburg-Berlin inaugurates the way.
Combining analyses of efficiency and decarbonization startles many with the fact that national energy systems ranging from India to South Korea to France are heading in the right direction, toward micro-emissions. The way is long, but we are on the light path.
Land
Of all human activities, agriculture transforms the environment most widely. Corps and pasture occupy at least one-fifth the land surface, at least ten times as much as cities, towns and roads. Agriculture has consumed forests, drained wetlands, erased habitats and favored some plants over others in fierce green warfare. Farms, of course, also feed us.
Yields per hectare measure the productivity of land and the efficiency of land use. To 1940, yields per hectare of most crops advanced little, and more mouths required more land to feed them. During the past half century, ratios of crop to land for the world’s major grains-maize, rice, soybean and wheat have climbed, fast and globally. The rise in wheat in India, Egypt, Ireland and the U.S. shows the inception and the spread of the trend (Figure 6, top).
A cluster of innovations including tractors, seeds, chemicals and irrigation, joined through timely information flows and better organized markets, raised yields to feed billions more without clearing new fields. In fact, since mid-century global cropland has remained stable. Expansion in developing countries has offset contraction in Europe and North America.
As the century draws to a close, the earth is at a historic turning point in land use. The continuing diffusion of high yields and efficient land use permits the absolute reversal of the destruction of nature that has occurred for many centuries.
Societies chronically fear exhaustion of the potential to increase food supply. In reality, the agricultural production frontier is still spacious, even without invoking the engineering of plants with new molecular techniques. For many decades in Iowa, while yields have risen steadily, the average corn grower has managed only half the yield of the Iowa master grower, and the world grows only about 20 percent of the top Iowa farmer. The production ratio of the performers has not changed much since 1960. In Iowa the average performer lags more than 30 years behind the state of the art.
Even where diffusion proceeds at a moderate pace, the effects accumulate dramatically. In India, for example, by raising wheat yields farmers spared 42 million hectares, about the size of Sweden or California, if we compare the land actually harvested in 1991 with the land the farmers would have harvested at 1961-66 yield for the actual production. Globally, the land spared since 1960 by raising yields of grain, which make up more than half of all calories, equals the Amazon basin (Figure 6, bottom).
A single-minded concentration on land raises concern that side effects will harm the nature we seek to preserve. In fact, land requires little more clearing, tilling and cultivating for high yields than for low ones. Protecting lush foliage needs little more pesticide and usually less herbicide than sparse foliage. Luxuriant foliage also protects soil better from erosion. The law of diminishing returns applies to fertilizers, which farmers tend to use abundantly. In many areas yield gains now come by optimizing inputs such as nitrogen and phosphorus in step and lowering total application. In sum, careful management of the land we do use is likely to diminish the total fallout from food production. Most fallout is coextensive with land used.
What is a reasonable outlook for the land cropped for future population? Future calories per capita will likely lie between the 3,000 per day of a vegetarian diet and the 6,000 that include meat (counting dietary calories plus the calories fed to food and draft animals and not recovered in milk, meet and so on). Let us consider, as Paul Waggoner has done (Waggoner 1994) how much cropland a population of 10 billion, almost twice the present, could spare for wilderness or other purposes with that range of calories per capita. If farmers fail to raise global average yields from the present 2 tons grain equivalent per hectare, people will have to lower their daily portions to 3,000 calories to avoid further land clearing. But Irish wheat and American corn now average 8 tons per hectare. If farmers can lift the global average to 5,10 billion people on average can enjoy the diet 6,000 calories bring, and spare a quarter of the present 1.4 billion hectares of cropland. The quarter spared is about twice the size of Alaska. If future farmland on average yielded today’s U.S. corn, 10 billion eating an American diet could allow cropland the area of Australia to revert to wilderness.
Per hectare, annual world grain yields in fact rose 2.15 percent 1960-1994. If dynamics continue as usual, farmers will grow 8 tons per hectare around 2060, at the end of the decade in which the United Nations projects population to reach 10 billion From the Great Plains of America to the Great Plains of China, reversion of farms and ranches to woods and grasses will be a spreading, major environmental feature of the next decades, and beyond. And governments will avidly seek rationales to subsidize agriculture to keep it from contracting more rapidly than culture will allow.
Materials
We can reliably project more efficient energy, decarbonization and effectively landless agriculture. What about a companion dematerialization? I will define dematerialization primarily as the decline over time in weight of materials used to perform a given economic function.
Dematerialization would matter enormously for the environment. Excluding water and oxygen, in 1990 each American mobilized on average about 50 kilograms per day. Reducing the materials intensity of the economy could preserve landscapes and natural resources, lessen garbage and reduce human exposures to hazardous materials.
Over time new materials substitute for old. Successful new materials usually show improved properties per ton, thus leading to a lower intensity of use for a given task The idea is as old as the epochal succession from stone to bronze to iron. Our century has witnessed the relative decline of wood and the traditional metals and the rise of aluminum and especially plastics (Figure 7, top).
Modern examples of dematerialization abound. Since the early 19th century, the ratio of weight to power in industrial boilers has decreased almost 100 times. Within the steel industry, powder metallurgy, thin casting, ion-beam implantation and directional solidification as well as drop and cold forging have allowed savings up to 50 percent of material inputs in a few decades. In the 1970s a mundane invention, the radial tire, directly lowered weight and material by one-quarter below the bias-ply tires they replaced. An unexpected and bigger gain in efficiency came from the doubling of tire life by radials, so halving the use of material (and the piles of tire carcasses blighting landscapes and breeding mosquitoes). Lightweight optical fibers with 30 to 40 times the carrying capacity of conventional wiring and invulnerability to electromagnetic interference are ousting copper in many segments of the telecommunications infrastructure. The development of high-fructose corn syrup (HFCS) in the 1960s eliminated sugar from industrial uses in the United States. HFCS has five times sugar’s sweetening power on a unit-weight basis, with a proportional impact on agricultural land use.
Certainly many products–for example, cars, computers and containers–have become lighter and often smaller. Compact discs selling for less than $100 now contain 90 million home phone numbers of Americans, equivalent to the content of telephone books once costing $60,000 and weighing 5 tons. At midcentury, glass bottles dominated. In 1953 the first steel soft-drink can was marketed. Cans of aluminum, one-third the density of steel, entered the scene a decade later and by 1986 garnered more than 90 percent of the beer and soft-drink market. Between 1973 and 1992 the aluminum can itself lightened 25 percent. In 1976 polyethylene terephthalate resins began to win a large share of the market, especially for large containers previously made of glass.
Recycling, of course, diminishes the demand for primary materials and may thus be considered a form of dematerialization. No longer limited to resource-poor individuals and regions, during the past couple of decades recycling has regained standing as a generalized social practice in the U.S. and other societies with huge material appetites.
Difficulties arise in the more complex “new materials society” in which the premium lies on sophisticated materials and their applications. Alloys and composites with attractive structural properties can be hard to separate and recycle. Popular materials can be lighter but bulkier or more toxic. Reuse of plastics may be less economical than burning them (cleanly) for fuel or otherwise extracting their chemical energy. Most important, economic and population growth has multiplied the volume of products and objects. Thus, total wastes have tended to increase while declining per unit of economic activity (Figure 7, bottom).
By weight, construction materials make up about 40 percent of the materials Americans consume and thus form a significant metric. Although absolute use of physical-structure materials by weight has fluctuated, consumption per unit of economic activity has trended downward since 1970. Because energy materials such as petroleum constitute another 40 percent of our materials diet, increases in energy efficiency could also markedly dematerialize economies.
As yet, trends with respect to dematerialization are equivocal. Better and more complete data on materialization and dematerialization over long periods for the United States and the rest of the world need to be assembled and analyzed. Moreover, the heterogeneity of purpose of materials will never permit the performance of the materials sector to be summarized as simply as kilowatts and carbon can summarize energy or tons per hectare summarize land. A kilogram of iron does not compare with one of arsenic. But the promise dearly exists for what Robert Frosch, I and our colleagues call a superior “industrial ecology,” in which the materials intensity of the economy declines, wastes lessen and the wastes that are created become nutritious in new industrial food webs.
Water
We can get more value from each unit of energy, land and material. Can we squeeze more from a drop of water?
Total per capita water withdrawals quadrupled in the United States between 1900 and 1970, and overall personal consumption increased by one-third between just 1960 and the early 1970s (Figure 9). However, since 1975, per capita water use has fallen appreciably, at an annual rate of 1.3 percent. Absolute water withdrawals peaked about 1980.
Industry, alert to technology as well as costs, exemplifies the progress, although it consumes a small fraction of total water. Total industrial water withdrawals plateaued a decade earlier than total U.S. withdrawals and have dropped by one-third, more steeply than the total. More interesting, industrial withdrawals per unit of GNP (in 1982 dollars) have dropped steadily since 1940, when 14 gallons of water flowed into each dollar of output. Now the flow is less than 3 gallons per dollar. The steep decline taps many sectors, including chemicals, paper, petroleum refining, steel and food processing. After adjusting for production levels, not only intake but discharges per unit of production are perhaps one-fifth of what they were 50 years ago.
In manufacturing, technology as well as law and economics have favored frugal water use. More efficient use of heat and water usually go together, through better heat exchangers and the recirculation of cooling water. Legislation, such as the U.S. Clean Water Act of 1972, encouraged reduction of discharges and recycling and conservation as well as shifts in relative prices. Although water treatment may cost only about 5 percent of production, wastewater-treatment systems are expensive capital investments.
Despite the gains, the United States is far from most efficient practice. Water withdrawals for all users in the countries making up the Organization for Economic Cooperation and Development range tenfold, with the U.S. and Canada the highest. Allowing for differences in major uses (irrigation, electrical cooling, industry, public water supply), large opportunities for reductions remain. In the late 1980s over 90 percent of measured U.S. hazardous wastes were still wastewaters.
In the long run, with much higher thermodynamic efficiency for all processes, removing impurities to recycle water will require small amounts of energy. Dialytic membranes open the way to such efficient purification systems. Because hydrogen will be, with electricity, the main energy carrier, its combustion (if from seawater) may eventually provide another important source of fresh water, perhaps 200 liters per person per day at the level of final consumers, about one-fourth the current withdrawal in water-prudent societies such as Denmark. Importantly, as agriculture contracts spatially and irrigates more frugally; its water demand will shrink.
Population
l have demonstrated a revolution in factor productivity, whether energy, land, materials or water. The game to get more from less is old. In energy, global progress is documented for centuries. With land, the Chinese started long ago, but most of the world began only about 1940. 1940 also appears to have marked a crossing point for new materials. In water, U.S. industry joined the search about 1940, and the population more generally about 1970.
The catch for homo faber is that our technology not only spares resources but also expands our niche. Technology further adds to population by increasing longevity and decreasing mortality. Although fertility has also declined greatly; the role of new birth-control technologies in the decline has been small. Feedbacks may well also occur between population growth and density on the one hand and invention and innovation on the other.
Population provides a multiplier that determines total consumption. So far I have stressed ratios, not absolutes.
To see graphically how technology can change carrying capacity, consider the population history of Japan. From the establishment of the Tokugawa Shogunate about 1600 Japan insulated itself from outside technology until 1854 when American Commodore Matthew Perry reopened trade. In 1868 the Meiji restoration lessened the isolationist policy of the former imperial party, and Japan entered a period of great borrowing from the Occident. As evident in Figure 10, Japanese population growth since 1100 sorts perfectly into two pulses of growth. Tokugawa technology (and culture) and its medieval predecessors accommodated a gradual addition of 28 million over about five centuries to Japan’s earlier population of about 5 million. Meiji and Western technology keyed the opening of the niche to another 100 million or so in one century.
Reasoning about the link between technology and carrying capacity from the Japanese case, my colleague Perrin Meyer and I have speculated about the growth of the population of the U.S. We hypothesize a sequence of overlapping pulses of population growth centered on times of rapid economic expansion, the midpoints of tentatively identified 50-yearlong waves of economic growth. Technological innovations affecting resources, processes and products cluster in each economic wave and expand carrying capacity. The first pulse of population growth associates with wood, iron, steam, canals, and wool and cotton textiles; the second with coal, steel, railways, telegraphy and early electrification, and the third with oil, plastics, autos, widespread electrification, telephony, computers and pharmaceuticals. The fourth, emerging pulse revolves around natural gas, aviation and a host of information and molecular technologies. Daring to extrapolate our reasoning with a “superlogistic” curve using the center points of the growth pulses as the base points, we find the U.S. population saturating around 400 million in 2100, a total consistent with projections made by conventional demographic methods.
Clearly the limits to human numbers keep shifting. In any case, analysis of historic population data shows that the global rate of growth peaked at about 2.1 percent per year around 1970, as noted near the outset of this article. Fertility rates, the key factor, have been falling in most nations and are below the levels needed to replace current population in Europe and Japan. The difficulty is that we have no logic to predict future fertility, and simply fitting an equation, as we did for the U.S., is chancy. Globally, the pervasive economic and social effects of the information revolution could allow the increase in human numbers to 15 or 50 or 100 billion, or influence the fertile to choose not to reproduce. The question of future population appears quite open, as reflected in the spray of projections.
Conclusion
Population frames the challenge for green technologists. To maintain current levels of cleanliness with the 50 percent increase in population I think likely for the United States and the current level and kind of economic activity, emissions per unit of activity would need to drop by one-third. That is an easy target. An improvement of 1.5 percent per year reaches the target by 2020, 80 years early.
The challenge is much harder taking into account growing consumption. If economic activity doubles per capita roughly every 30 years, as it has since about 1800 in the industrialized countries, the result is an eightfold increase by 2100. Multiplied by population, the United States would have 12 times today’s emissions and demands on resources, other things being equal. This scenario of the “dirty dozen” requires micro- or zero emissions per unit of economic activity to maintain or enhance environmental quality In other words, Americans need to clean processes by more than one order of magnitude. More reassuringly, the annual cleaning need be about 2.5 percent.
In Europe and Japan population is stable or even shrinking, easing the magnitude of their environ mental challenges. The rest of the world, where most people live, faces the twin pressures of enlarging economies and populations. So in absolute terms the technical gains must be enormous.
But we have seen the outlines of how the gains can be made. In the long run, we need a smoke free system of generating hydrogen and electricity that is highly efficient from generator to consumer, food decoupled from acreage, materials smartly designed and selected for their uses and recycled, and carefully channeled water. In short, we need a lean, dry, light economy.
In truth, I exaggerate the challenge. With respect to consumption, multiplying income will not cause an American to eat twice as much as today in 2020 or eight times more in 2100, and even a mouth moving today from Lima to Los Angeles only triples its original caloric intake. With respect to production, history shows that the economy can grow from epoch to epoch only according to a new industrial paradigm, not by inflating the old. High environmental performance forms an integral part of the modern paradigm of total quality. The past half-century signals the preferred directions: the changeover from oil to gas, the contraction of crops in favor of land for nature, the development of a new ecology of materials use in industry, and diffusion of more efficient water use to farmers and residents as well as industries.
Economists always worry about trading off benefits in one area for costs in another. Hearteningly, we have seen that in general efficiency in energy favors efficiency in materials; efficiency in materials favors efficiency in land; efficiency in land favors efficiency in water; and efficiency in water favors efficiency in energy. The technologies that will thrive, such as electricity, will concert higher resource productivity. Prone to fail is a technology, such as biomass farming for energy, which brings into conflict the goal to spare land with the goal to spare carbon.
Some worry that the supply of a fifth major resource, ingenuity, will run short. But nowhere do averages appear near the frontier of current best practice. Simply diffusing what we know can bring gains for several decades. Moreover, science and technology are young. Aggressively organized research and development (R&D) is another innovation of the past 50 years. Many industries have systematized their search for better practice (“endogenized R&D” in the economics jargon) and have the productivity gains to show for it. Other industries, including much of the service sector which now forms the bulk of modern economies, and the enlarging public and non-profit sectors have improved slowly. Overall, society hardly glimpses the theoretical limits of performance.
Inevitably, sectors and societies will advance at unequal pace. We will continue to have laggards as well as pioneers. Problems will arise from the distribution of goods, the actions and interactions of bads, shocking and poorly tailored innovations, and social traps such as the well-known “tragedy of the commons,” which today sadly entangles the wild stocks of fish. Yet the long history of technical progress and its reach into more sectors during recent decades encourage. Perhaps the first Earth Day in 1970 was an inflection point.
Policy can interfere wastefully with dynamics-as-usual, where they are benign. For example, decarbonization mandates the phasing out of the coal industry worldwide over the next decades; the political system might prudently assist those who lose their livelihoods, but not with dollars for actual coal. Wise policy favors science, experimentation and fluidity, while addressing inequity and insecurity and insuring against catastrophe.
Families named Smith, Cooper, and Miller people our nation because until not long ago most of us beat metal, bent casks, and ground grain. Now few workers hold such jobs. So far, except in video, we are not named Programmer, Sub-Micron, and Genesplicer. We easily forget how much the modem world has changed and yet how early our day is. We forget the power of compounding our technical progress, even at one or two percent per year. Knowledge can grow faster than population and provide abundant green goods and services. The message from history is that technology, wisely used, can spare the earth. You can click on it.
Acknowledgments
The author thanks Arnold Grübler, Raphael Kasper, Robert Kates, Alan McGowan, Perrin Meyer, Nebojsa Nakicenovic, Donald Rogich, Paul Waggoner and Iddo Wernick.
FIGURES


Figure 1. Advances in technology enable people to obtain services more efficiently. Greater efficiency in our use of energy, materials, land and water could help diminish the burdens people place on the environment. One possible future is captured by the vision of the “buffalo commons”: jobs would concentrate in urban areas (as, for example, at busy Dallas-Forth Worth Airport, above, where 37,000 people work) as vast lands in the interior of North America return to a wild state. Restoration of tall grass prairie in the Midwest, as at the Konza Prairie Research Natural Area in Kansas (also above), has been guided by conservation organizations and will accelerated as highly productive agriculture frees additional land. (Above photograph courtesy of Dallas Fort Worth Airport.)
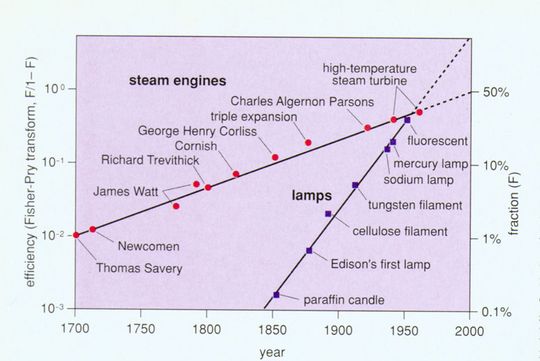
Figure 2. Energy efficiency is a tern of modern invention, but the efficiency of energy-conversion technologies has been increasing for hundreds and probably thousands of years. Improvements in motors and lamps are analyzed here as a logistic (sigmoid) growth process with a linear transform that normalizes the data to ease comparison. (From Ausubel and Marchetti, in press.)
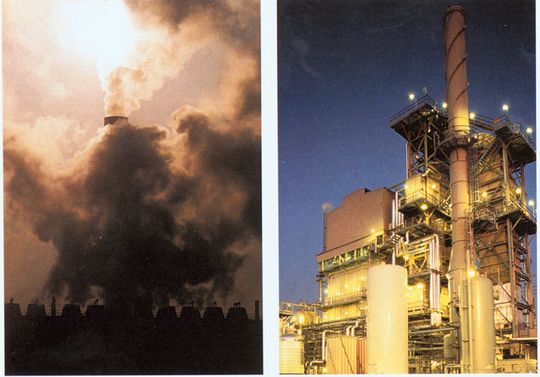
Figure 3. Decarbonization of the world’s energy mix moves the economy from dependence on carbon-heavy fuels, responsible for black lung, oil spills and large releases of climate-changing greenhouse gases. A power station in Bitterfeld, Germany (kft), burned lignite, or “brown coal,” contributing to Eastern Europe’s severe air-pollution problem. The author envisions a cleaner energy economy based on hydrogen, whose combustion produces water vapor. At right a California plant produces hydrogen by steam reforming of natural gas. (Right photograph courtesy of Air Products and Chemicals, Inc.)
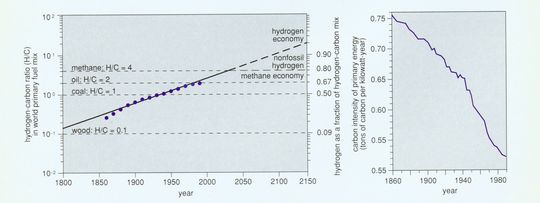
Figure 4. World primary energy sources have declined in carbon intensity since 1860. The evolution is seen in the ratio of hydrogen (H) to carbon © in the world fuel mix, graphed on a logarithmic scale, analyzed as a logistic growth process and plotted in the linear transform of the logistic curve (left). After Marchetti 1985). Wood has an effective hydrogen-to-carbon ratio of 0.1, coal 1, oil 2, and natural gas 4. Progession of the ratio above natural gas (methane, CH4) requires production of large amounts of hydrogen fuel without fossil energy. Carbon intensity can also be calculated as the ratio of the sum of the carbon content of all fuels to the sum of the energy content of all primary energy sources (right). For such a calculation carbon emission in tons per kilowatt-year average: wood, 0.84, coal, 0.73; oil 0.55; and gas, 0.44. (From Nakicenovic, in press).
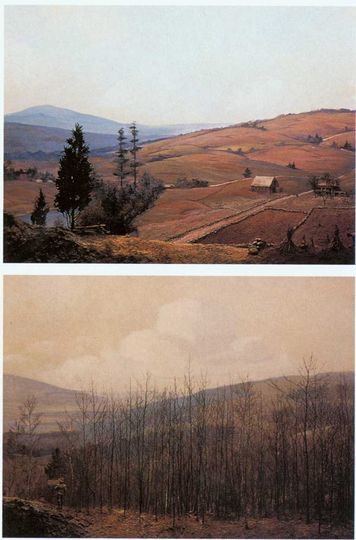
Figure 5. Much American land cleared by early settlers has reverted to nature as a result of changes closely related to technological progress and the increasing ability to grow more crops per acre. As better transport and machines made farming the rich soils of the Midwest highly profitable, New England farmers abandoned the rocky fields they had cleared. Dioramas on display at the Harvard Forest in Petersham, Mass., document the return of New England to forest. This pair shows the landscape around Petersham in 1830, at the height of cultivation, and a century later, when volunteer pines and the maturing hardwoods that followed them filled the landscape. (Photographs courtesy of the Fisher Museum at Harvard Forest.)
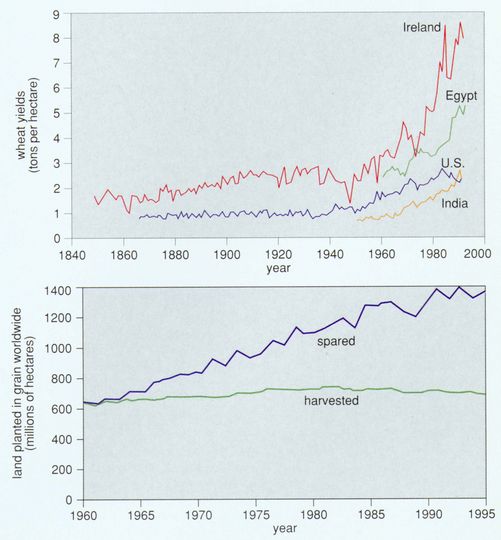
Figure 6. Rising yields of wheat on four continents (top) illustrate progress in agricultural productivity. Improved yields have allowed the global area actually harvested for grain to remain stable at around 600 million hectares (bottom). “Land spared” is the amount of land that would have been needed to produce actual grain crops with the 1960 average yield. (Data from Mitchell 1980, Yearbooks of the Food and Agriculture Organization and the U.S. Department of Agriculture’s “PS&D View,” a database.)
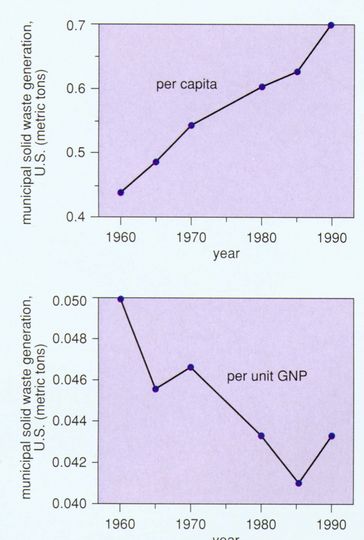
Figure 7. Countervailing trends can be detected in the use of materials in the US. In the top graph, production data are divided by the Gross National Product in constant (1982) dollars and normalized to 1940. The use of heavy materials such as steel has been supplanted in the economy by lighter materials, especially plastics. Since 1970 even aluminum and the agricultural minerals, phosphates and potash, have declined in relative use. Municipal solid-waste generation, however, has grown steadily on a per capita basis. In relation to GNP, solid-waste generation dropped 1960-19185 but climbed again recently. (From Wernick et al., in press. Data from U.S. Bureau of the Census 1975 and 1993; U.S. Environmental Protection Agency 1992.)
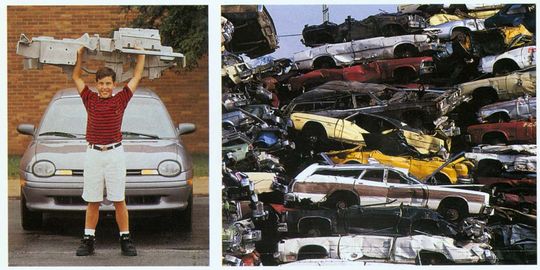
Figure 8. Auto manaufacturing today uses plastics and lightweight metals, exemplifying dematerialization, the trend toward higher materials and products per unit of economic activity. A Chrysler demonstration car, the Neon Lite, includes a lightweight instrument panel made of magnesium (left). Yet total wastes have risen in the U.S. with economic and population growth. At right, crushed automobiles pile high at a Philadelphia scrap-metal reclamation center. (Left photograph courtesy of Chrysler Corporation.)
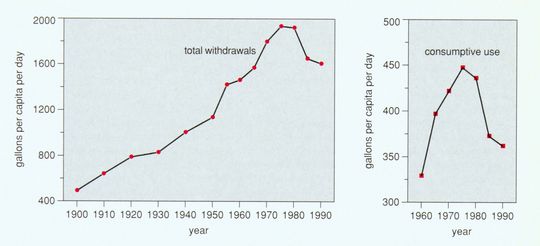
Figure 9. Total per capita water withdrawals quadrupled in the U.S. between 1900 and 1970, and overall personal consumption (right) increased by one-third between 1960 and the early 1970s. Since 1975, however, per capita water use has fallen annually 1.3 percent. Industrial withdrawals per unit of GNP have dropped steadily since 1940, encouraged by technology as well as law and economics. Data from other nations show that the U.S. is far from most efficient practice. (Data from U.S. Bureau of the Census 1975 and 1993.)
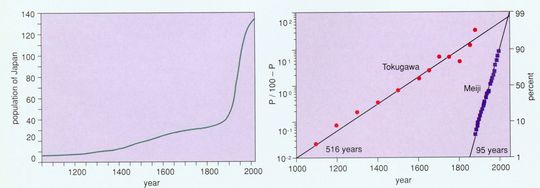
Figure 10. History of Japanese population growth shows how technology changes carrying capacity. Under the Tokugawa Shogunate from about 1600 to 1854, Japan insulated itself from outside technology. The right-hand graph decomposes the population data into a pair of logistic growth pulses in linear form. The pulse the Tokugawa Shoguns took to its culmination was centered in 1537, required 516 years to grow from 10 percent to 90 percent of its extent, and saturated at 28 million people (on top of a pre-existing level of 5 million). The Meiji pulse, centered in 1950, required 95 years, and is saturating now with an addition of 103 million. (Meyer 1994. Data from Tsuneta Yano Memorial Society 1993 and Taeuber 1958.)

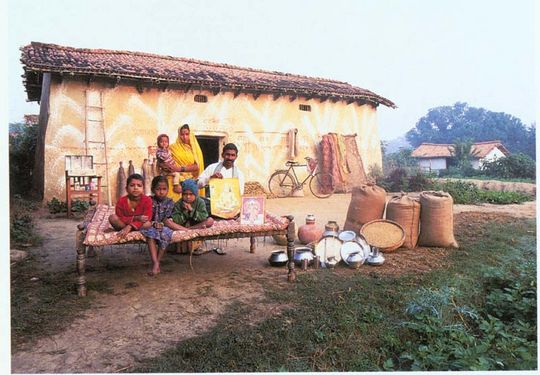
Figure 11. Growing consumption raises the challenge of saving resources through technology. Since about 1800 in industrialized countries, economic activity has doubled per capita roughly every 30 years. The contrast between consumption in developed and developing countries is illustrated by the “global family portrait” developed by the Material World project, which photographed typical families with their possessions around the world. Shown here are the Skeen family of Pearland, Texas, and the Yadev family of Ahraura, India. (From Material World, Sierra Club Books 1994.)
Bibliography
Ausubel, J. H. 1992. Industrial ecology: Reflections on a colloquium. Proceedings of the National Academy of Sciences 89(3):879-884.
Ausubel, J. H. 1991. Energy and environment: The light path.Energy Systems and Policy 15(3):181-188.
Ausubel, J. H., and C. Marchetti. 1996. Elektron: Electrical systems in retrospect and prospect.Daedalus 125(3):139-169.
Ayres, R. U. 1989. Energy Inefficiency in the US Economy: A New Case for Conservation. RR-89-12. Laxenburg, Austria: International Institute for Applied Systems Analysis.
Ayres, R. U. 1994. Information, Entropy, and Progress. New York: American Institute of Physics.
Banks, R. B. 1994. Growth and Diffusion Phenomena. Berlin: Springer-Verlag.
Bernardini, O., and R. Galli. 1993. Dematerialization: Long term trends in the intensity of use of materials and energy. Futures 25(4):431-148.
Boserup, E. 1981. Population and Technical Change: A Study of Long-Term Trends. Chicago: University of Chicago Press.
Curzio, A. Q., M. Fords and R. Zoboli, eds. 1994. Innovation, Resources, and Economic Growth. Berlin: Springer-Verlag.
Frosch, R. A. 1992. Industrial ecology: A philosophical introduction. Proceedings of the National Academy of Sciences 89(3):800-803.
Frosch, R. A. 1994. Industrial ecology: Minimizing the impact of industrial waste. Physics Today (November):63-68.
Graedel, T E., and B. R. Allenby. 1995. Industrial Ecology. Englewood Cliffs, New Jersey: Prentice-Hall.
Grübler, A. 1994. Technology. In Changes in Land Use and Land Cover, eds. W. B. Meyer and B. L. Turner. Cambridge, U.K.: Cambridge University Press, pp. 287-328.
Grübler, A., and N. Nakicenovic, eds. 1991. Diffusion of Technologies and Social Behavior. Berlin: Springer-Verlag.
Grübler, A., and H. Nowotny. 1990. Towards the fifth Kondratiev upswing: Elements of an emerging new growth phase and possible development trajectories. International Journal of Technology Management 5(4):431-171.
Herman, R., S. A. Ardekani and J. H. Ausubel. 1989. Dematerialization. In Technology and Environment, eds. J. H. Ausubel and H. E. Sladovich. Washington, D.C.: National Academy Press, pp. 50-69.
Hirschman, C. 1994. Why Fertility Changes. Annual Review of Sociology 20:203-233.
Homer-Dixon, T. 1994. The ingenuity gap: Can poor countries adapt to resource scarcity? Toronto: Peace and Conflict Studies Program, University of Toronto.
Kates, R. W. 1996. Population, technology and the human environment: A thread through time. Daedalus 125(3):43-72.
Kelley, A. C. 1988. Economic consequences of population change in the Third World. Journal of Economic Literature XXVI:1685-1728.
Lutz, W., ed. 1994. The Future of World Population Growth: What Can We Assume Today? London: Earthscan.
Marchetti, C. 1985. Nuclear plants and nuclear niches. Nuclear Science and Engineering 90:521-526.
Marchetti, C. 1989. How to solve the CO2 problem without tears. International Journal of Hydrogen Energy 14(8):493-506.
Marchetti, C., P. S. Meyer and J. H. Ausubel. 1996. Human population dynamics revisited with the logistic model: How much can be modeled and predicted?Technological Forecasting and Social Change 52:1-30.
Matthews, A. 1992. Where the Buffalo Roam. New York: Grove Weidenfeld.
Meyer, P. 1994. Bi-logistic growth.Technological Forecasting and Social Change 47:89-102.
Mitchell, B. R. 1980. European Historical Statistics 1750-1975, 2nd ed. New York: Facts on File.
Nakicenovic, N. 1989. Technological Progress, Structural Change and Efficient Energy Use: Trends Worldwide and in Austria, International Part. Laxenburg, Austria: International Institute for Applied Systems Analysis.
Nakicenovic, N. 1996. Decarbonization. Daedalus 125(3):95-112.
Organization for Economic Cooperation and Development. 1991. The State of the Environment. Paris: OECD.
Perez, C. 1983. Structural change and the assimilation of new technologies in the economic and social system. Futures 15(5):357-375.
Rogich, D.G., et al. 1993. Materials Use, Economic Growth, and the Environment, presented at the International Recycling Congress and REC ’93 Trade Fair. Washington, D.C.: U.S. Bureau of Mines.
Taeuber, I. B. 1958. The Population of Japan. Princeton: Princeton University Press.
Tsuneta Yano Memorial Society, ed. 1993. Nippon: A Chartered Survey of Japan, 1993/1994. Tokyo: Kokusei-Sha.
Turner, B. L., II, R. W. Kates, J. F. Richards, J. T. Matthews and W. B. Meyer. 1990. The Earth as Transformed by Human Action. New York: Cambridge University Press.
United Nations Population Division, Department of Economic and Social Information and Policy Analysis. 1994. World Population Prospects: The 1994 Revision. New York: United Nations.
U.S. Bureau of the Census. 1975. Historical Statistics of the United States, Colonial Times to 1970. Washington D.C.: U.S. Government Printing Office.
U.S. Bureau of the Census. 1993. Statistical Abstract of the United States: 1992, 112th ed. Washington, D.C.: U.S. Government Printing Office.
U.S. Bureau of Mines. 1990. The New Materials Society. Volumes I-III. Washington, D.C.: U.S. Government Printing Office.
U.S. Environmental Protection Agency. 1992. Characterization of Municipal Solid Waste in the United States: 1992 Update. Final Report, No. 530-R-92-019. Washington, D.C.: Environmental Protection Agency.
U.S. Geological Survey. 1993. Estimated Use of Water in the United States in 1990. Circular 1081. Washington, D,C.: U.S. Government Printing Office.
U.S. Geological Survey, National Water Summary 1987-Hydrologic Events and Water Supply and Use. Water Supply Paper 2350. Washington, D.C.: U.S. Government Printing Office, 1987, pp. 81-92.
Waggoner, P E. 1994. How Much Land Can Ten Billion People Spare for Nature? Ames, Iowa: Council for Agricultural Science and Technology.
Wernick, I. K., and J. H. Ausubel. 1995. National materials flows and the environment. Annual Review of Energy and the Environment 20:463-492.
Wernick, I. K., R. Herman, S. Govind and J. H. Ausubel. 1996. Materialization and dematerialization: Measures and trends.Daedalus 125(3):171-198.
Jesse H. Ausubel is director of the Program for the Human Environment and Senior Research Associate at The Rockefeller University and a program officer of the Alfred P. Sloan Foundation in New York City. From 1977 to 1988, he was associated with the National Academy complex in Washington as a fellow of the National Academy of Sciences, then as a staff officer with the National Research Council Board on Atmospheric Sciences and Climate, and finally as director of programs for the National Academy of Engineering, where he developed and oversaw studies on the performance of technology-intensive sectors of U.S. industry and on the diffusion and globalization of technology. In recent years, he has helped originate industrial ecology, the study of the networks of flows of materials and energy in industry. Educated at Harvard and Columbia, Ausubel served on the U.S. Environmental Protection Agency’s Science Advisory Board. Address: Program for the Human Environment, The Rockefeller University, 1230 York Avenue, Box 234, New York, NY 10021-6399. Internet: phe@mail.rockefeller.edu.
Political fallout: What fate awaits Chernobyl in the new world order?
Working Less and Living Longer: Long-Term Trends in Working Time and Time Budgets
I. Introduction and Definitions
Laborers have sought to shrink hours of work since time immemorial. Farm machines and external energy inputs to agriculture, culminating in the cheap and dependable tractor, provided the big break (Marchetti, 1979). With these, 80 percent or more of the population could live decoupled from the fields and move to town. As it turned out, the urban jobs to which people migrated initially demanded more time on an annual basis than the farm jobs.
Work time in the early period of industrialization increased dramatically, up to 14-16 hours per day (Nowotny, 1989). The factory schedule extended the peak periods of agriculture, such as the harvest, to an all-year norm in early industries, such as textiles. At the same time, a qualitative transformation, in particular, continuous monetary evaluation of work time, occurred in the transition to industrial time (Hareven, 1982).
With the increasing monetization of the economy, strengthening of government statistical offices, more systematic tax collection, and rise of labor movements, estimation of hours of paid work becomes possible for many countries in the middle to late nineteenth century. For well-documented industries such as manufacturing, railroads, and coal mining, the estimates appear accurate. Jones (1963) discusses in detail the methods used to make these estimates. We have not been able to locate reliable, consistent, continuous time series data on work time in agriculture and industry prior to the 1850s.[1]
Work time in this paper refers to the number of hours a person engages in contracted and compensated work, whether aggregated for a week, year, or lifetime. The work time data to be presented and discussed cover only this regular salaried or compensated work and include both part-time and full-time jobs. They omit paid vacations, holidays, and sick leave, which are included in the concept of total time paid for, a complementary series published by the U.S. Bureau of Labor Statistics and similar offices. Neither do the work time data cover housework or unpaid voluntary work, which we will refer to as unpaid labor time. Total socially obligatory activities embrace formal paid work as well as unpaid, informal work, child care and housework, and voluntary activities. We will refer to the combination of work time and unpaid labor time as total labor time. In contrast, free time may be allocated to various other activities, including leisure. The combination of unpaid labor time and free time is referred to here as non-work.
The most complete and consistent long time series on work time we have found are for the United Kingdom (Armstrong, 1984; Matthews et al., 1982; Williams, 1983), so we rely heavily on these. Moreover, the UK’s long history of industrialization and leading position over much of this period make it an especially interesting subject of study.
The plan of the paper is as follows. First, we analyze the quantitative trends in work time in the United Kingdom and other industrialized nations, then we compare the changing shares of life hours allocated to work and non-work, next we examine total labor and free time, and finally we discuss causes and consequences of the trends. We make gender as well as international comparisons. The fundamental fact, as we shall see, is that lifetime hours at work diminish, both absolutely and relatively.
II. Reductions in Work Time: The UK
Total life hours of work are the product of years in a career, weeks worked per year, and hours worked per week. We will discuss these three variables in turn for men, women, and then the total labor force.
When the data begin in 1856, a career for a UK male averaged about 47 years (Figure 1). Before education became mandatory, work began young, often around 10, and healthy men labored until they died. Armstrong (1984) estimated that careers for male workers lasted as long as 55 years for the surviving cohort. However, few lived to experience the natural end of such a long working career, so on average the duration was much shorter.[2] At age 10 males expected only about 48 more years of life, and at age 20 about 40 more years. With a total life span of less than 60 years, few felt the need for pensions. The average male career lengthened to 52 years in the 1930s, as a result of increased life expectancy, and has shortened since. The current duration of the average male work career is practically unchanged from the middle of the 19th century.
Table 1. Changes in Lifetime Hours at Work UK 1856-1981 (in hours).
| Measure | Men | Women | ||||
| 1856-1931 | 1931-1981 | 1856-1981 | 1856-1931 | 1931-1981 | 1856-1981 | |
| “Working Less”1 | -36,760 | -12,497 | -49,257 | -18,845 | -16,698 | -35,543 |
| “More holidays”2 | -1,744 | -8,534 | -10,278 | -720 | -3,280 | -4,000 |
| Shorter/Longer Work career3 | +11,674 | -13,779 | -2,105 | -2,675 | +19,268 | +16,593 |
| TOTAL | -26,830 | -34,810 | -61,640 | -22,240 | -710 | -22,950 |
1Changes in hours worked per week (lower values for women due to their shorter work career).
2Changes in weeks worked per year (lower values for women due to their shorter work career).
3Changes in years worked.
Lifetime Work Hours (1,000)
| 1856 | 1931 | 1981 | |
| Men | 149.7 | 122.9 | 88.0 |
| Women | 62.8 | 40.5 | 39.8 |
Vacations, holidays, and other reductions to weeks worked per year gradually increased from less than 2 to about 6 weeks between 1856-1981. Decreases in the number of weeks worked per year amount to about 17% of the total reduction in work time for UK males over this period (Table 1). More dramatically, the average weekly work time dropped by one-third from 63 to fewer than 42 hours between 1856-1981. Changes were both gradual and discontinuous, illustrating the importance of institutional and legal forces in the regulation of working hours.
Women in the United Kingdom, like men, work fewer hours per week and also enjoy more vacation, but notably, are lengthening their careers (Figure 2). Prior to World War II, the length of female careers averaged under 20 years. In 1950 the average female career began stretching and has now reached 30 years. The average female work week of some 29 hours in 1981 is 30 percent lower than for male workers due to the significant share of part-time jobs of women.
The average length of a career for the entire male and female UK work force has changed little (Figure 3). During more than a century 40 years remain the reference point. Reductions in career length of male workers have balanced corresponding increases in female participation rates and career lengths. The stable duration of a career sharply contrasts the strong decline in hours worked during the average career.[3]
Simple arithmetic on the data of Figures 1 and 2 yields estimates of life hours at work. Stable, long trends emerge (Figure 4). Lifetime hours at salaried work have been reduced for males by 42%, from 150 to 88 thousand hours, and for females by 37%, from 63 to 40 thousand hours. For women, most of the reduction came prior to 1931. Because 1931 was the nadir of an economic depression which brought high unemployment and restructuring of the labor force, we somewhat arbitrarily choose that year as the hinge to break the analysis into greater detail (Table 1). Since then, women’s lifetime work hours have shrunk only around 700 hours. The reductions from shorter work days and weeks as well as longer vacation periods have been almost offset by the rise in average female career length.
For the whole work force, the average per capita reduction in lifetime hours at work between 1856-1981 amounted to about 55 thousand hours, from 124 to 69 thousand hours. We have no information on changes in the variance or on subpopulations within the work force other than by gender. Our data and analysis are also limited to averages for the working population that may be quite different from what individuals would experience over their lifetime. We have not been able to identify similar long term data sets that would allow to follow many successive generations or age cohorts over time.
Extrapolating a linear trend would suggest that gradually both men and women will work less: in the year 2050 women possibly 30 and men about 70 thousand hours during a lifetime.[4] The hours worked by women and men seem to converge slowly, reducing the gender gap between male and female work roles in society.
In fact, when the data on work careers for women and men are examined together, women appear to be gradually substituting for men in the labor force (Figure 3). While in the middle of the 19th century some 30 percent of the work force was female, their share has increased to about 40 percent at present. This increase, together with the lengthening of female careers since 1950, multiplies the share of labor by women in the UK workplace when calculated over the entire work career period. The female share of career-years doubled from about 15% in 1856 to 30% in 1981.
If we hold constant at the 1980 value the length of the male and female careers at 46 and 30 years, work weeks at 46 per year for both genders, and female participation in the work force at 40%, and speculate that the trends of Figure 4 continue into the future, projected lifetime hours in 2050 would translate to a 33 hour workweek for men and a 22 hour workweek for women, or 27 hours for both men and women. Clearly, all the variables can change. As in the past their evolution will be much more discontinuous than suggested by a smooth trend line. We present this scenario because the duration of the workweek is probably most easily appreciated.
Consider briefly reasons for the steady reductions of life hours of paid work. Social scientists have long sought explanations for changes in work time. In A Theory of Wages, Douglas (1934) saw reduction in hours of work as an outcome of decisions by workers when rates of pay have increased. Workers choose to divide the benefits of productivity gains between additional income and leisure. Douglas also viewed reduction in years spent in the labor force as a consequence of higher family incomes and government expenditures on pensions. Owen (1978, 1979) reviewed and extended the economic argument, exploring how entrepreneurs in a competitive market will try to minimize their labor costs by seeking the hours schedule that will attract the best labor at the cheapest cost. He argued that changed preferences of employees will induce employers to shorten hours of work, all to minimize labor cost. Several economic studies pertain at the level of the household (e.g., Ghez and Becker, 1975; (Becker, 1976). Sociologists such as Dumazedier (1989) have emphasized the role of permanent scientific revolutions enabling workers to produce more in less time. The relative power of different social classes and groups then distributes the time thus generated, along with the wealth produced, according to historians such as Thompson (1967).
One might summarize by saying that several plausible theories contend to explain declines in working time, but difficulties also persist with their applications. From a phenomenological point of view, economists are hard-pressed to explain why the propensity for reducing work would persist over more than 100 years and a wide range of incomes. The market economics also do not explain adequately the similar trends we document later in nations where labor markets have been tightly controlled by government. Moreover, some empirical findings show that higher wages increase rather than decrease hours of work (National Commission for Manpower Policy, 1978). Among managers and professionals, evidence is mixed that higher wages reduce work hours (Harriman, 1982). Schor (1991) finds that annual hours of fully employed Americans increased modestly between 1969-1987. Other challenges arise in explaining the differing behavior of men and women. Can a pure economic argument explain the discontinuity that occurred in female work careers in the United Kingdom in the 1950s? There is also a question of heterogeneity. Aggregate data tend to mask large differences within the working population and also between generations as illustrated in the different life biographies of different birth cohorts (cf. Blossfeld et al., 1989, and Mayer, 1990). We agree with Sharp (1981) and Juster and Stafford (1991) that the economics of time are little studied and poorly understood. Common to the contending theories are the inexorable forces of technological change, as remarked by Leontieff (1978), a point to which we shall return.
III. Reductions in Work Time: International Comparisons
Should we generalize from the case of the United Kingdom to other countries? Although long time series data on lifetime work hours are unavailable, data on annual average hours worked[5] are available for numerous countries. Trends in annual hours worked should be revealing in view of the observed stability of the length of the work career. Szalai et al. (1972) and Blyton (1985) further reassure us by showing many similarities in time budgets in dozens of countries.
Until about 1930, reductions in annual per capita work time were similar in the industrialized countries, as shown in Table 2 and Figure 5. Thereafter, North America and Europe made larger downward adjustments in work time than Japan, with a re-convergence as well. Since the mid-1980s the decline in working hours appears to have slowed down, even reversed in some countries (Marchand, 1992). This has certainly been an additional factor accentuating the unemployment problems in a number of countries.Table 2. International Comparison of Hours Worked (effectively)5 per Person Per Year
(Source of Data: Maddison, 1991).
| YEAR | FRANCE | FRG | UK | USA | JAPAN | RATIO OF JAPAN/USA |
| 1870 | 2,945 | 2,941 | 2,984 | 2,964 | 2,945 | 0.99 |
| 1890 | 2,770 | 2,765 | 2,807 | 2,789 | 2,770 | 0.99 |
| 1913 | 2,588 | 2,584 | 2,624 | 2,605 | 2,588 | 0.99 |
| 1929 | 2,297 | 2,284 | 2,286 | 2,342 | 2,364 | 1.01 |
| 1938 | 1,848 | 2,316 | 2,267 | 2,062 | 2,361 | 1.15 |
| 1950 | 1,926 | 2,316 | 1,958 | 1,867 | 2,166 | 1.16 |
| 1960 | 1,919 | 2,081 | 1,913 | 1,795 | 2,318 | 1.29 |
| 1973 | 1,771 | 1,804 | 1,688 | 1,717 | 2,093 | 1.22 |
| 1987 | 1,543 | 1,620 | 1,557 | 1,608 | 2,020 | 1.26 |
It is interesting to note that between about 1930 and 1960, Japan largely resisted reductions in work.[6] Thus, the hours Japanese now work are shifted several decades compared to other industrialized countries. The Japanese work today some 400 hours per year longer than, for instance, Americans and approximately as long as in other industrial countries before mid-century.[7]
International comparisons of competitiveness often neglect the effect longer work time may have on Japanese economic performance. Surely the Japanese spending much more time at work profoundly affects production and consumption, savings, and firm organization. In terms of the dichotomy between production and consumption, the Japanese have chosen to stay in the workplace to support consumption abroad of automobiles, consumer electronics, and other goods. As seen below, a more complicated picture emerges when consideration is given not only to formal, contracted work, but also to other, primarily domestic types of labor activities. The fact that the Japanese work more does not necessarily imply that they enjoy less free time.
IV. Work Time versus Non-Work Time
Formal work is one aspect of social life. Obviously, if work time shrinks, the times of life that are not part of the formal work contract expand. During high unemployment in Western Europe in the early 1980s, experts in social research commented:
The formalized work contract has historically become the central issue in industrialized countries. It does not only regulate the standard of life, but is also the most important factor for social integration. The economic crisis and rapid technological change have created a shortage of jobs, and labor-market policies try to find new ways for redistribution (shortening of working time, more flexible working hours, job sharing). Nevertheless, formal work seems to lose its traditional unique and central place. One indicator for this are the growing discussions on the importance of other, ´informal’ sectors of work and service. When looking at work in such a general sense we are faced with the big problem of having to find a new equilibrium between the historically established sector of guaranteed employment and other (still) informal sectors. (Eurosocial, 1983).
Jahoda (1988) suggests to study those relatively enduring aspects of people and social institutions, which undergo only gradual, hardly perceptual changes, arguing that “employment as an institution whose time structure shapes the entire way of life of an industrial society has not changed; neither has the need of people for institutionally supported time experiences.”
Here we analyze quantitatively the eroding relative position of work time. Our hypothesis is simply that work time and alternative uses of time compete for the individual’s total time. To test the hypothesis, a standard of total life hours is necessary. Historical data on longevity (Flora et al., 1987) provide the standard for retrospective analysis. Demographic models are available to project future total life hours. Historical data (Figure 6) fit well to a logistic function, which projects life expectancy increasing by about 5% over the next few decades, to almost 80 years on average for men and women.
Comparing life hours of work to total disposable, active non-work hours yields the fractions of the lifetime time budget at work and other activities. Disposable hours are calculated by subtracting 10 years for childhood and first elementary education and also required physiological time. For the latter we have assumed (perhaps oversimplifying) 10 hours per day for sleep, eating, and personal hygiene for both genders. Between 1856 and 1981 disposable lifetime hours increased from 242 to 356 thousand hours in the United Kingdom, while, as we calculated above, the average working hours decreased from 124 to 69 thousand hours. Thus, non-work hours increased from about 118 to 287 thousand hours over a lifetime (Figure 7). While in 1856 50% of the disposable lifetime of workers was spent working, the portion has fallen to less than 20% today (Figure 8). Both reduced lifetime working hours and increased life expectancy caused the shift.
For men, this transition was crucial in both relative and absolute values. In 1856 about 150 thousand hours of a male’s lifetime were spent at the workplace and only some 91 thousand hours outside it (not considering physiological time). The former figure decreased to some 88 thousand hours, while the latter increased threefold to about 256 thousand non-work hours in 1981. In other words, from 1856 to 1981 the fraction of the disposable lifetime of a UK male spent working fell from three-fifths to one-fourth, with the crossover from a majority of work to non-work occurring around 1900.
Alternately, we can assess the ratio of non-work time to work time. In 1856 the ratio was around 0.6 for men, 2.9 for women, and 0.95 for the average working population. By 1981 the ratio of other to work time increased to 2.9 for men, 8.4 for women, and 4.2 for the average working population. All these measures dramatize how much consumption, or the non-productive sphere (to use a term formerly employed in socialist economies), dominates social activity in industrialized countries. The change is expressed throughout the economy, for example in the energy sector, where demand for personal transport and residential purposes exceeds industrial demand (Schipper et al., 1989).
V. Non-Work, Total Labor, and Free Time
What is the nature of the many hours of non-work? In youth activities center around education and recreation. Then, during the typical 40-year work career, one-third of the disposable time is spent at the work place and two-thirds are spent raising children, doing household work, and in leisure and holiday activities. After retirement, time is used for recreation, leisure activities, and, with aging, much expenditure goes for health maintenance.
We can further disaggregate the evolving lifetime time budget into hours spent in childhood and elementary education, higher education, work, non-work activities (i.e., other socially obligatory activities and free time) during the active working career years, and finally time after retirement. We always exclude required physiological time in the calculations. Again the changes in lifetime time budgets result from the combined evolution of two variables: changes in lifetime hours devoted to various activities (the numerator) and increasing life expectancy (the denominator). The latter explains the decreasing fraction childhood and elementary education account for in a male lifetime, from 17% to 13% (Figure 9). In the absence of data we have assumed childhood and elementary schooling to remain constant at 10 years. The decrease in fraction of time spent at work from over half of the total lifetime hours to less than one-fourth is another quantitative illustration of the transition from work to non-work discussed above. The increase in non-work activities allocates unevenly between different life stages. The smallest gains in non-work time are observed during the active working career. Non-work activities before (i.e., education beyond elementary schooling) and after (i.e., retirement) the work career have increased from zero to 20% of the disposable lifetime time budget of UK men.
The increase in the duration of higher education reflects the growing importance of pre-work preparation (see, e.g., Matthews et al., 1982:106). Following the Elementary Education Act of 1870, compulsory education of 8 years became mandatory in the UK. In 1972 compulsory education years were for the last time increased to a total of 11 years. Of course, the average value of 20% of a disposable male lifetime spent at education masks heterogeneity in the length of pre-work education from minimum compulsory schooling to doctoral degrees. After the turn of the next century as much as one-fourth of the lifetime of the average male worker may pass before starting on the job.
The component of the male non-work time budget which has risen the fastest is the time after the active working career: retirement. Whereas in the 1930s the average male life expectancy did not exceed the years spent at education plus the length of an average work career, the situation has changed drastically since. Retirement now accounts for about 13% of the average disposable male lifetime time budget in the UK. With increasing longevity of the population and further reductions in work time, the fraction of time in “life after work” (Young and Schuller, 1991) could increase to about one-fourth of the total work force life span during the next two to three decades.
If the trends should continue, after the year 2000 as much as half of the lifetime of the worker will be accounted for by pre- and after-work activities. Even in the remaining half of an individual’s lifetime, formal work will account for a decreasing fraction of time, 30% or less, and should leave more time for leisure and other activities such as caring for children and the home. Distribution of additional work-off times will be critical. Shortening of working hours may be useless unless synchronized with the rhythms of society.
To this point we have focused on contracted, compensated working time, treating other activities mainly as residuals. Now we define labor from a more inclusive perspective, encompassing all socially obligatory activities. These include, for example, raising and caring for children, household work, work (full-time and part time) and economically grey activities, whether these add numerical value to national income accounts or result in other forms of monetary or non-monetary compensation.[8] The data analyzed were assembled from Hungarian research on time budgets (Falussy and Boda, 1989).[9] Their span of 25 years is a shorter time than the data for the United Kingdom. They yield, nonetheless, insights into the division of time between total labor and free activities in several countries and between genders. Extension of the study of work time to socially obligatory activities also adds perspective on the gender gap, seen in the long analysis of formal contracted work in the United Kingdom. We have complemented and updated the data from the Hungarian source with information for Japan (Statistics Bureau, 1987), the United Kingdom (Gershuny, 1989), the United States and the former USSR (Gershuny, 1989, 1992; and Robinson et al., 1988).[10] Our main interest in the data is their evolution over time and less in comparing and discussing absolute differences between countries.
In the following we consider the ratio of free to total labor time, measured by the ratio of time devoted to the two activity categories and again excluding physiological time. A ratio of 0.5 means that one-half as much disposable time is devoted to free time (including leisure) as to total labor; a ratio of 1.0 means that free and total labor time are equal.
As societies become more affluent, free time steadily increases compared to the time devoted to all labor, as evident from Figures 10a and 10b,which show the trend in several countries of the ratio for the male and female population separately, plotted against per capita Gross Domestic Product (GDP). The male population in the city of Pskov (Russian USSR) is an exception, with a stagnant free time compared to total labor time between 1965 and 1986. Another anomalous movement in the ratio is in Poland, where decreasing per capita GDP nevertheless accompanies the increasing free time seen in more prosperous countries. One interpretation of this anomaly is that the economic depression in Poland is a brief phenomenon, while change in the time budget rides through the ups and downs of economic performance. Perhaps the movement towards more free time that accompanies economic development cannot be reversed without large social disruptions even in periods of economic crisis, especially when these periods are marked by labor surplus.
The gender gap in free to total labor time in Figure 10a compared to Figure 10b appears smaller in more affluent societies, despite differences that remain between countries and cultures. In all but two societies assessed, women spend more total time in labor than men and thus enjoy less free time. The exceptions are the United States and the United Kingdom. In these countries, when considering all socially obligatory activities, women appear to enjoy more free time than men, perhaps because men devote more time to household work and raising children than in the other countries examined. The gender gap in the ratio of free to total labor time is particularly large in Eastern Europe. In Bulgaria, the gap even widened, as only men enjoyed more free time with economic development.
Also noteworthy is Japan, where the ratio behaves like other industrialized countries, despite a longer average paid time at the work place. Thus, although Japanese on average spend much more time in regular, compensated work, they nevertheless enjoy an amount of free time similar to people in other countries with a comparable degree of economic development. A basic budgetary principle in time allocation may be observed here, that people working more in formal economic activities appear to adjust time spent for housework and child care rather than free time proper.
Overall, the upward diagonal movement in Figures 10a and 10b resembles our earlier observation of the evolution of lifetime budgets for work and non-work. As societies become more affluent, the population spends less time in regular, salaried work at the workplace, and more time in informal work, at home, and for leisure.
VI. Observations and Questions
Earlier we pointed out that workers in the United Kingdom and similar countries formally work about 40 years and live close to 80. Workers do not work about half their lifetime, and the fraction of non-work keeps increasing. Moreover, within working years, the hours of work are diminishing. With increasing affluence, the ratio of free to all socially obligatory time could approach 1, eventually to surpass it. On average, even the total working population (including part time workers) will then spend at least as much time for free activities as for all other labor taken together.
We conclude by exploring a few of the causes and consequences of the reductions in work time and related phenomena. With respect to causation, we focus on technology. With respect to consequences, we consider the rise of the service economy. Then we pose some final issues and questions.
We mentioned earlier the inexorable role of technology in raising productivity and thus at least creating the possibility of liberating work time. The relations between technology and time are not simple. The complexity of the relations are demonstrated by considering technology and women’s labor. A logical hypothesis is that inventions easing household labor, limiting family size, and improving child health enabled women to increase their participation in the work force.
Recall some inventions affecting women. When the tin can was introduced in the 19th century, seers predicted that the reduction in time needed for meal preparation would lead to more time spent outside the home. Electrical appliances were forecast to have a similar effect: the iron (1882), sewing machine (1889), stove (1896), clothes washing machine (1907), and domestic refrigerator (1918) (dates from Desmond, 1987). When America’s Mr. Birdseye successfully marketed frozen foods in 1929, the tin can statements from 50 years earlier were repeated.
In fact, in the United Kingdom and the United States (see Harris, 1981) women did not lengthen their working careers until about 1950, when many household inventions achieved widespread diffusion. Innovations increase variety and quality of diet, improve cleanliness, and allow an individual to care for a larger amount of space. However, such innovations, at least before they became pervasive and complementary of one another, little altered the domestic labor time (Strasser, 1982; Vanek, 1974). Comparison of time use in the United States in 1965 with earlier studies showed only minor changes occurring since the 1930s (Robinson and Converse, 1967). Minge-Kalman (1980), reviewing studies of several industrial societies, found that women’s daily work outside the home decreased while work inside the home increased for an overall net increase. In contrast, Gershuny and Robinson (1989) reported that between the 1960s and the 1980s women reduced the amount of time spent daily in housework.
Regardless of effects of domestic technologies, innovations such as the oral contraceptive (1951) and measles vaccine (1953) which have made it possible to have fewer and healthier children, along with attitudinal changes and associated social innovations such as day care centers, superficially match well with the onset of the dramatic increase in years women spend in paid work. But, female fertility has declined gradually in the industrialized nations for over a century, without any downward discontinuity following World War II. In fact, this period was marked by a brief baby boom. We conclude that technology serves the revealed social goal of reducing life hours of work primarily via productivity increases at the workplace. In other fields of endeavor technology increases productivity, so to speak, but often without altering time allocation.
In any case, working less and living longer implies new balances and structures of production and consumption and new areas of economic growth. Consumption now dominates production as a social activity. A typical life of 80 years may be spent about 40 years consuming and 40 both producing and consuming. When consumption dominates production, we are in the service economy. The service industries are transport, communications, entertainment, retail, banking, education, and health, and not manufacturing, mining, and agriculture.
When consumption is the main activity of a day or a life, most work in restaurants, hotels, schools, media, fitness centers, banks, and health care organizations. Service dominates employment and over the long run may especially favor medicine and recreation as well as information handling. In a society which lives longer and works less, people can worry more about youth and beauty and health.
Gershuny (1989) argued that leisure in the so-called leisure society makes the work and that the non-work activities enable the consumption of ever increasing outputs of products and services of affluent societies. It is uncertain to what extent the more individuals produce, the more time they need for consumption. We can spend money fast, purchasing costly items in a twinkling. An expensive one-week tour takes no more time than a cheap one-week camping. Nevertheless, if technology makes a society with more productive potential but insufficient time to consume more, then balancing the system requires more time for consumption as well as the money to pay for it.
Numerous policy issues emerge. A fundamental issue is whether society yet reflects in its employment, pension, and educational policies the dominance non-work and free time have obtained over work. Policy, for example, with respect to reform of welfare, still appears geared to the primacy of the formal work contract. Our knowledge of the time patterns of the non-working population, including the elderly, needs to be deepened.[11] The observed persistence in average work career length of around 40 years also raises policy issues, for example, about workplace change and performance. The jobs evolve, the work force turns over, working hours are reduced, but years of work and the length of social memory of the workplace remain roughly constant. This regularity may be valuable for employers and government to recognize in developing policies for education and re-training, especially in conditions of rapid technological change and corresponding changes in skill requirements. With further work time reduction within these 40 years, new organizational models of distributing work activities should be possible. For instance, like just-in-time inventory, a just-in-time labor force may be assembled (Kutscher, 1988). The 27-hour average work week may match well with lots of temporary workers.
Research questions also abound. Why does the system at the macro level exhibit stable behavior over more than a century despite discontinuities in underlying individual variables such as weekly working hours or female career lengths?[12] Why do we partition the additions to non-work between education, retirement, and other options as we do? Why have most countries adopted the same divisions between work and non-work at different stages of their industrialization? Will the historically observed rates of change continue? If not, what will slow or speed them?
The closing question must be how far reductions in work time will go. Our response is to look back. Recall that in hunter-gatherer tribes men worked only three hours each day.[13] Perhaps 10,000 years after the invention of farming humanity will come full-circle. If the earth’s environment can be preserved and our social structures improved, then in another 200 years or so we may return to the leisurely life of the Garden of Eden.
Acknowledgments
The authors thank Helga Nowotny for interesting us in this topic, Sir Bruce Williams for sharing data and pointing out critical issues, and Eli Ginzberg, Cesare Marchetti, Nebojsa Nakicenovic, Paul Waggoner, and Michael Young for helpful comments.
BIBLIOGRAPHY
Andorka, R.(1987) ‘Time Budgets and Their Uses’, Annual Review of Sociology 13:149-164.
Armstrong P.(1984) Technical Change and Reductions in Life Hours of Work. London: The Technical Change Centre.
Becker G.D.(1976) The Economic Approach to Human Behavior. Chicago: University of Chicago Press.
Blossfeld H.P, Hamerle, A. and Mayer K.U.(1989) Event History Analysis, Statistical Theory and Application to the Social Sciences. Hillsdale: Erlbaum, NJ.
Blyton P.(1985) Changes in Working Time: An International Review. London/Sydney: Croom Helm.
Desmond K.(1987) Harwin Chronology of Inventions, Innovations, Discoveries. London: Constable.
Douglas P.H.(1934) A Theory of Wages. New York: Macmillan.
Dumazedier J.(1989) ‘France: Leisure Sociology in the 1980s’, in: A. Olszewska and K. Roberts (eds) Leisure and Life-style. Sage Studies in International Sociology 38, London: Sage Publications Ltd.
Eurosocial (1983) ‘Can There Be a New Welfare State: Social Policy Options Towards Shaping an Uncertain Future’, Descriptive Note R 120/March 1983/1, Vienna: European Center for Social Welfare Training and Research.
Falussy B. and Boda G.(1989) ‘Changes in Total Worktime per Unit of Free Time as a Function of Economic Development’, Statistic Journal of the United Nations ECE 6:51-68.
Flora P., Kraus F. and Pfennig W. (1987) State, Economy, and Society in Western Europe 1815-1975 vol. II, Frankfurt: Campus Verlag.
Fourastié J. (1965) Les 40000 heures. Paris: Robert Laffont.
Gershuny J.I. (1989) ‘International Comparisons of Time Budget Surveys: Methods and Opportunities’, Paper prepared for International Workshop on the Changing Use of Time, Brussels, 17-18 April. Dublin, Ireland: European Foundation for the Improvement of Living and Working Conditions.
Gershuny J.I. (1992) ‘Are We Running out of Time?’, in: FuturesJanuary/February:3-22.
Gershuny J.I. and Robinson J. (1989) ‘Multinational Comparisons of Change in the Household Division of Labor’, Paper prepared for International Workshop on the Changing Use of Time, Brussels, 17-18 April. Dublin, Ireland European Foundation for the Improvement of Living and Working Conditions.
Ghez G.R. and Becker G.S. (1975) The Allocation of Time and Goods over the Life Cycle. New York: National Bureau of Economic Research.
Gross D.R. (1984) ‘Time Allocation: A Tool for the Study of Cultural Behavior’, in: Annual Review of Anthropology 13:519-558.
Hareven T.K. (1982) Family Time and Industrial Time: The Relationship Between the Family and Work in a New England Industrial Community New York: Cambridge University Press.
Harriman A. (1982) The Work/Leisure Trade-off: Reduced Work Time for Managers and Professionals New York: Prager.
Harris M. (1981) Why Nothing Works: The Anthropology of Daily Life New York: Simon & Schuster.
Harvey A.S. (1989) ‘The Use of Time of the Non-employed in Historical, Cross-national Perspective’, Paper prepared for International Workshop on the Changing Use of Time, Brussels, 17-18 April. Dublin: Ireland European Foundation for the Improvement of Living and Working Conditions.
Harvey A.S., Szalai A., Elliott D.H., Stone P.J. and Clark S.M. (1984) Time Budget Research, An ISSC Workbook in Comparative Analysis. Frankfurt: Campus Verlag.
Hurd M.D. (1990) ‘Research on the Elderly: Economic Status, Retirement, and Consumption and Saving’, Journal of Economic Literature XXVII, June:565-637.
Imhoff A.E. (1981) Die gewonnen Jahre: Von der Zunahme unserer Lebensspanne seit drei hundert Jahren oder von der Notwendigkeit einer neuen Einstellung zu Leben und Sterben. München: C.H. Beck.
Jahoda M. (1988) ‘Time: A Social Psychological Perspective’, in: M. Young and T. Schuller (eds) The Rhythms of Society. London/New York: Routledge.
Jones E.B. (1963) ‘New Estimates of Hours of Work per Week and Hourly Earnings, 1900-1957’, in: Review of Economics and Statistics, XLV(4):374-385.
Juster F.T. and Stafford F.P. (1991) ‘The Allocation of Time: Empirical Findings, Behavioral Models, and Problems of Measurement’, in: Journal of Economic Literature, XXIX(6):471-522.
Krelle W. (ed), (1989) The Future of the World Economy: Economic Growth and Structure Change. Berlin: Springer.
Kutscher R. (1988) ‘Growth of Service Employment in the United States’, in: B.R. Guile and J.B. Quinn (eds)Technology in Services: Policies for Growth, Trade, and Employment. Washington, DC: National Academy.
Leontieff W. (1978) ‘Worksharing, Unemployment, and Economic Growth’ in: National Commission for Manpower Policy, Work Time and Employment: A Conference Report, Special Report No. 28, #052-003-00686-3, pp. 129-135, Washington DC: U.S. Government Printing Office.
Maddison A. (1991) Dynamic Forces in Capitalist Development: A Long-run Comparative View. Oxford: Oxford University Press.
Marchand O. (1992) ‘Une comparaison internationale de temps de travail’, in: Futuribles 165-166(5-6):29-39.
Marchetti C. (1979) On Energy and Agriculture: From Hunting-Gathering to Landless Farming. RR-79-10, Laxenburg, Austria: International Institute for Applied Systems Analysis.
Matthews R.C.O., Feinstein C.H. and Odling-Smee C.J. (1982) British Economic Growth 1856-1973. Oxford: Clarendon Press.
Mayer K.U. (Ed) (1990) Event History Analysis in Life Course Research. Madison: Univ. of Wisconsin Press.
Minge-Kalman W. (1980) ‘Does Labor Time Decrease With Industrialization: A Survey of Time Allocation Studies’ in: Current Anthropology 21:279-287.
National Commission for Manpower Policy, (1978) Work Time and Employment: A Conference Report. Special Report No. 28, #052-003-00686-3, Washington, DC: U.S. Government Printing Office.
New York Times, (1988) ‘It’s Official! Vacations Really Aren’t Un-Japanese’, Section 1, page 4, column 1, 6 August.
New York Times, (1988) ‘Relaxing Takes Some Work as Weekends Come to Japan’, Section 1, page 1, column 5, 31 December.
Nowotny H. (1989) Eigenzeit: Entstehung und Strukturierung eines Zeitgefühls. Frankfurt: Suhrkamp.
Owen J.D. (1978) ‘Hours of Work in the Long Run: Trends, Explanations, Scenarios, and Implications’, in: National Commission for Manpower Policy, Work Time and Employment: A Conference Report. Special Report No. 28, #052-003-00686-3, 331-64, Washington, DC: U.S. Government Printing Office.
Owen J.D. (1979) Working Hours: An Economic Analysis. Lexington: DC Heath.
Robinson J.P., Andreyenkov V.G. and Patrushev V.D. (1988) The Rhythm of Everyday Life: How Soviet and American Citizens Use Time. Boulder: Westview Press.
Robinson J.P., and Converse P.E. (1967) 66 Basic Tables of Time Budget Research Data for the U.S.. University of Michigan, Ann Arbor: Survey Research Center.
Sahlins M.D. (1974) Stone Age Economics. Chicago: Aldine-Atherton.
Schipper L., Bartlett S., Hawk D. and Vine E. (1989) ‘Linking Life-styles and Energy Use: A Matter of Time?’ Annual Review of Energy XIV:273-320.
Sharp C. (1981) The Economics of Time. Oxford: Martin Robertson.
Schor J. (1991) The Overworked American. New York: Basic.
Statistics Bureau, Management and Coordination Agency (1987) Japan Statistical Yearbook. Tokyo.
Strasser S. (1982) Never Done: A History of American Housework. New York: Panthion.
Szalai A., Converse P.E., Feldheim P., Scheuch E.K. and Stone P.J. (1972) The Use of Time: Daily Activities of Urban and Suburban Populations in Twelve Countries. The Hague/Paris: Mouton.
Thompson E.P. (1967) ‘Time, Work-discipline, and Industrial Capitalism’, in: Past and Present 38:56-97.
Vanek J. (1974) ‘Time Spent in Housework’, in: Scientific American November:116-120.
Wilensky H. (1961) ‘The Uneven Distribution of Leisure: The Impact of Economic Growth on Free Time’, in: Social Problems 9:32-36.
Williams B. (1983) ‘Technical Change and Life Hours of Work’, in: 14th April 1983 Sesquicentennial Conference of the Manchester Statistical Society Proceedings, pp. 90-106 United Kingdom.
Young M. (1988) The Metronomic Society: Natural Rhythms and Human Timetables. London: Thames and Hudson.
Young M. and Schuller T. (1991) Life After Work. Glasgow: Harper Collins.
FIGURES
Click on the button to view the figure.
Click here for all the figures on one page. (Then you can print all of the figures at once.) This page is large, about 600K in size.
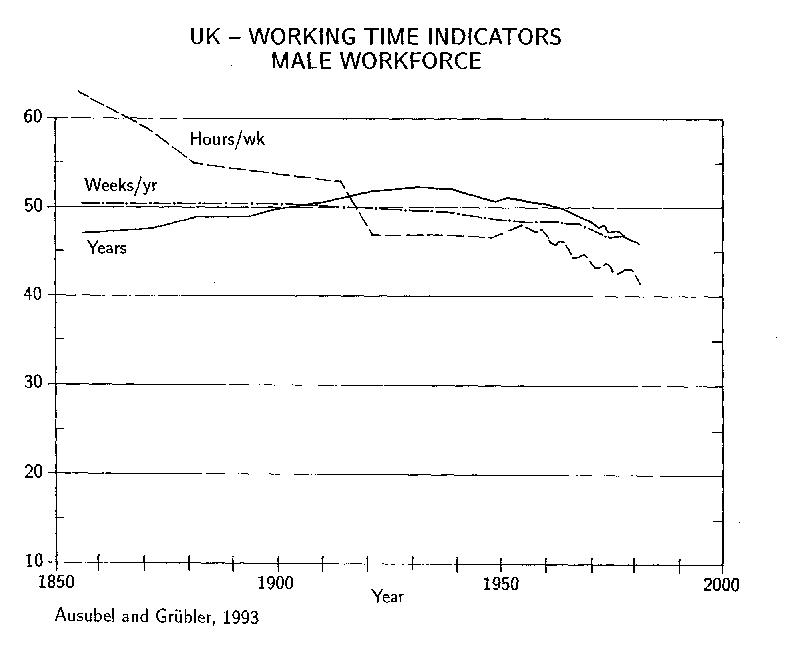
Figure 1. Working Time Indicators (hours/week, weeks/year, years at work) for Male Working Population in the UK, 1856-1981. Data Source: Armstrong (1984), Matthews et al. (1982), Williams (1983).
Figure 2. Working Time Indicators (hours/week, weeks/year, years at work) for Female Working Population in the UK, 1856-1981. Data Source: Armstrong (1984), Matthews et al. (1982), Williams (1983).
Figure 3.Years at Work of Female, Male and Average Working Population in the UK 1856-1981. Data Source: Armstrong (1984), male data corrected for average life expectancy.
Figure 4. Lifetime Hours at Work of Female, Male and Average Working Population in the UK 1856-1981.
Figure 5. Average Annual Hours Worked in Selected Countries 1870-1987. Data Source: Table 2.
Figure 6. Life Expectancy at Age 10, UK 1870-1980, in 1000 Hours and Years. Data Source: Flora et al. (1987).
Figure 7. Disposable Lifetime Hours (Excluding Physiological Time and 10 Years for Childhood and Elementary Education) for Work and Non-work for Average Working Population, UK 1856-1981, in 1000 hours.
Figure 8. Fraction of Disposable Lifetime Spent at Work and Non-work of Female, Male and Average Working Population, UK 1856-1981.
Figure 9. Allocation of Lifetime to Different Activities for Male Working Population in the UK 1856-1981, in Fraction of Disposable Lifetime (excluding physiological time).
Figure 10a. Free Time to Total Labor Time Ratios Versus per Capita GDP for Male Population of Selected Countries, 1961-1986.
Figure 10b. Free Time to Total Labor Time Ratios Versus per Capita GDP for Female Population of Selected Countries, 1961-1986.
TABLES
Table 1. Changes in Lifetime Hours at Work UK 1856-1981 (in hours).
Table 2. International Comparison of Hours Worked (effectively)5 per Person per Year (Source of Data: Maddison, 1991).
ENDNOTES
[1.] Wilensky (1961) provides estimates of work time in eras ranging from the Roman to the 20th century, but no continuous and comparable data series. Imhoff (1981) presents a scattering of interesting facts about changes in time budgets over the past 300 years. See also Schor, 1991, p. 45.
[2.] Only by 1930 was the male life expectancy at age 10 long enough to allow the average male in the United Kingdom to live until the end of a typical working career of some 52 years prevailing at that time. Age 10 may sound today like an early starting point for the analysis in this paper. However, child labor was normal in the 19th century. In the United Kingdom Ashley’s Act excluded girls and boys under age 10 from the mines only in 1842. Fielden’s Act of 1847 established a “normal” working day of 10.5 hours for young people (and women) in factories.
[3.] If schooling lasts 10-15 years and a work career 40 years, then the lifetime of the human capital stock (its formation, integration, and use in the production sphere of the economy) is about 50-55 years. This clock sets the speed of social learning. The ultimate limits to the speed of diffusion of innovations are human minds. Individuals and groups early on often become locked into particular procedures and technical know-how and unable to accept new ideas or practices. Replacing entirely a workplace organization or any other human system that is no longer satisfactory can require some 50 years, if the system is fixed in the minds of the current managerial and labor force and is taught to the young.
[4.] Fourastié (1965) proposed that early in the 21st century the working career would already be reduced to 40,000 hours. According to our analysis, Fourastié’s forecast was several decades early.
[5.] Data source: Maddison (1991). Data refer to annual hours worked effectively (i.e. contractual working time plus overtime minus holidays and sick leave). Other definitions are also used frequently in international working time comparisons, e.g. contractual working time (excluding overtime and sick leave) or actual working hours (derived from detailed time budget surveys, including e.g. also “informal” overtime). Definitions and data sources are discussed in detail in Maddison, 1991:255-258. Methodological issues (and resulting uncertainties) in international comparisons are also discussed in Marchand, 1992:33-38.
[6.] Although relatively early retirement is customary for employees of some large Japanese corporations, we have not been able to find evidence that length of careers on average in Japan differs significantly from that in other countries examined, so the use of annual hours should be representative.
[7.] For accounts of Japanese attitudes toward work time, see the New York Times, 6 August and 31 December 1988.
[8.] Minge-Kalman (1980) uses the terms “productive” and “reproductive” (or domestic) labor to span total labor time.
[9.] For reviews of literature on time budget surveys and analyses, see Andorka (1987), Harvey et al. (1984), and Juster and Stafford (1991).
[10.] The data on the then Soviet city of Pskov may not be precisely comparable to national average data in other countries and are affected also by the problems of estimating comparable USSR Gross Domestic Product (GDP) figures as indicators of economic development (see Krelle, 1988, on this point, from where we derive the GDP estimates for the USSR).
[11.] On the use of time of the non-employed see Harvey (1989); for economic research on the elderly see Hurd (1990); for a sociological perspective see Young and Schuller (1991).
[12.] Young (1988) has sought deep mechanisms in the temporal behavior of human society.
[13.] Studies among many foraging groups give comparable results; see Sahlins (1974) and Gross (1984:526).
Chernobyl After Perestroika: Reflections on a Recent Visit
From Technology in Society, Vol. 14, pp. 187-198, 1992. Copyright ©1992 Pergamon Press Ltd. Printed in the USA. All rights reserved. An abbreviated version of this essay appeared in The Sciences, Vol. 31, No. 6 (1991).
I visited Chernobyl in December, 1990. A little time and much history have passed in the former USSR since then. A blasted nuclear reactor and its fallout remain. In this essay, I convey how economic deterioration and political metamorphosis bear on one of the world’s most important environmental sites.
Some of the drama and gloom of my visit had to do with winter. No one vacations in northern Ukraine in December. The days are gray, cold, and short. It is easy to remember why the grandparents of many Americans left those lands behind and harder to understand why people have fought so hard over them. Sometimes people fight most where the stakes are low. Certainly rural northern Ukraine is poor, and in some ways undeveloped. The underdevelopment accounts for some of its ecological interest.
I will narrate my visit, sharing impressions and drawing lessons along the way. Though my purpose was science, not journalism, I remarked images and forces. For a photographer or sociologist the trip would be rich, but I almost hesitate to describe it. I felt rather as I would taking notes in a devastated American neighborhood such as the South Bronx or a strip-mined region of West Virginia. I felt rude as a scientific guest to record too much.
Why was I invited? I study climate change and the energy systems that may cause or prevent it. I began work on climate change in 1977, when the fraternity of interested scientists fit comfortably in one conference hall and almost as many thought that the world was entering a new ice age as the greenhouse century. Climate is a global question, and those in the network of researchers included several capable Soviet scientists.
One place to study global climate was the International Institute for Applied Systems Analysis (IIASA), a US-USSR “think tank” near Vienna, Austria. I spent two years there, and my first supervisor was a Russian, a hydrodynamicist from Siberia. In those years there was some suspense for an American in having a Soviet boss. Andrei Sakharov was in exile in Gorki, and I was working at IIASA while the Red Army moved into Afghanistan. Brezhnev was in power. A kind of bond was established during the Cold War between Soviet and American scientists who worked together fruitfully that may now be harder to achieve. If individuals collaborated under the old adverse conditions, the bond tended to be lasting. The invitation to visit Kiev and the nearby Chernobyl site can be traced through these international links antedating glasnost and perestroika, as well as the April 1986 accident.
In the spring of 1990, reports showed patches of radiation effects persisting around Chernobyl. One might think regular lines of effects would circle the reactor, indicating decreasing concentrations or effects from the accident. In fact, the pattern looks more like Swiss cheese, with all kinds of spots and circles here and there.
Members of the group of scientists in Kiev whom I came to know discovered the pattern. A scientist directing the study visited me in April 1990 at The Rockefeller University. He said he would invite me to Kiev and Chernobyl. Sure enough, in June a letter arrived, saying, “Come discuss matters of mutual interest whenever the time is good for you.” Both the prompt arrival and informal tone of the letter indicated the different world we have come to enjoy, and which was threatened by the August 1991 coup. A scientist directly invited a scientist: no delegation, no workshop, no approval from Moscow. I wrote that I would like to come in early December, and my Ukrainian host telexed saying, “That is fine.” My letter and the telex with a visa application to the USSR consulate won a visa without any problem. That was that.
The easiest flight from America to Kiev is still via Moscow. In fact, scenes in Moscow helped me understand some current and potential problems at Chernobyl. Visiting Moscow anew, I was struck most by the absence of authority. The dog didn’t bark. I encountered virtually no passport control or customs inspection. Formerly, if you were lucky enough to be designated important, someone from the USSR Academy of Sciences might meet you and whisk you through a special side channel. Normal channels meant long delays. In 1990, I passed in without an escort in minutes for formalities, hardly different from arriving in Germany and probably easier than Heathrow Airport in England or Kennedy in New York.
The disappearance of authority is accompanied by the disappearance of goods, which many travelers and, especially, the Russians themselves note. Moscow had no butter, no beer, no cooking oil, and hardly a children’s toy. Store shelves were genuinely empty. People seemed to spend their time foraging.
Russians have a sense of humor. One joke: A long line of people were waiting in a grocery store, a “gastronome.” The only items on sale are jars of pickled peppers and boxes of biscuits. A surly man behind the counter faces the frustrated customers. The line is moving slowly; one person asks for two boxes of biscuits and three jars of peppers, another person for one of each, and someone for three jars and five boxes. A very old man in line finally gets to the front and faces the counterman, who is dressed in a white coat to provide protection against spills and stains, which are most unlikely to come from the goods in stock. The old man announces, “I’d like a kilo of beef, two chickens, two dozen eggs, two kilos of tomatoes, a box of raspberries…” When the counterman says “Old man, you’re crazy,” the person behind in line says “No, he just has a good memory!”
If before the main impression in the USSR was tyranny, now it is poverty. There is begging, and there are shanty towns in Moscow, one of which was bulldozed in early 1991 to some outcry. Popular religious shrines are set up in public squares. Prostitution is less subtle than in the past. The black market exchange rate appeared to make the average monthly Russian salary about 10 or 20 dollars, income as in poor, developing countries. In the past people said that the USSR is a developing country with rockets; with immediate currency convertibility that would be the case.
In Kiev, capital of the Ukrainian Republic, the situation was somewhat better. One reason is that Ukraine effectively has its own currency. Coupons are required to purchase most mobile goods other than bread or milk, or most anything that costs more than one ruble. I tried to buy a record. I was not succeeding. Finally somebody in the line spoke in English and explained that I had to have a Ukrainian coupon along with the rubles. The coupon system instituted in October 1990 to keep goods within the Ukrainian Republic appears to be succeeding somewhat. However, it emphasizes what an artificial economy is functioning.
The Ukrainian Parliament, relatively new or revitalized, was in session day and night while I was there, debating and sometimes passing laws on all kinds of matters, from environmental protection to private property. The sessions, broadcast hour after hour rather like a cable network, seemed to be watched with interest and pride. Ukrainians repeatedly stressed to me that they were Europeans, gesturing about Moscow as if to suggest the partly Asiatic origin of Russia. Two people talked to me about the historic ties of the Ukraine with Greece, Constantinople, and Vienna. The mood is certainly to look west rather than northeast.
The desire to distance themselves from Russia and bring more change seemed the general tone in public, and also within family circles, especially among women, who have the hardest lot. The scientists have a somewhat complicated view. They worry about the fortune of science. Science, in the former Soviet Union, as in the United States, has been funded mostly on an “All-Union” or national basis. With diminished national funding of research, most institutes face large layoffs, and the country perhaps an intellectual migration. Scientific organizations are thus trying to diversify their sources of support, seeking support outside the USSR. The alternative is local money. But economic activity is shrinking and changing in the Republic, at least for the interim, so it will be difficult for Ukraine or other republics to provide from local tax revenues.
A grant or contract from former state or privatized enterprises for either basic or applied research will be hard to get. The Soviet equivalents of IBM or General Electric are likely to restructure dramatically or go out of business in the next few years. In eastern Germany only a few of the old enterprises appear to be surviving. Thus, academic research can look to the nascent Russian or Ukrainian private sector for little. For comparison, suppose California proposed to secede from the United States. How would Lawrence Livermore National Laboratory maintain itself? Almost 100% of its support is federal tax money.
Thus, many Soviet scientists seem little impressed by nationalistic arguments. They know that for 75 years the USSR has set up a national system of research with large units. For example, in Ukraine there are large centers for computer science and cybernetics in Kiev and for materials research in Kharkov. These will shrink if they are supported only by the Ukrainian Republic. Political fragmentation runs counter in practical ways to the scale and integration that are themes of modern research. Nationalist tendencies can also run counter to the universalist ethic of science.
These comments about the complex political situation preface my evaluation of environmental issues. Three days of meetings and briefings in Kiev preceded my day at Chernobyl in the “restricted zone.” Much of the science shared with me was good. I mention some impressive modeling of regional ecosystems, especially integrated ecological modeling of soils, forests, atmosphere, and hydrology. The hydrology was particularly advanced.
The Chernobyl accident made data available to Soviet environmental scientists for their studies. Until recently, Soviet scientists, even in their own numerical models, often used data from Western Europe or North America. For example, this was true for acid rain. They frequently did not have data, sometimes they did not have access to Soviet data that did exist, or, if the data did exist and were being used, the scientists could not share them openly. The urgency of Chernobyl caused many data to be collected and released. So, the models I saw were running on actual data, something different from the past and more motivating for everyone.
Computing power continues limited in Soviet research, which in key respects is a benefit. Scientists were concentrating on scientific issues rather than programming gimmicks. True, the Soviets have a strong hacker culture. A PC is treated in Kiev the way a car enthusiast in Southern California treats a vintage Volkswagen beetle. It is souped up to do everything it possibly can. Fortunately, for much of the needed ecological modeling, a souped-up PC with intellectual fundamentals is sufficient. Fancy color graphics may help communication but do not change the calculations.
Where to begin to describe Chernobyl itself? Amid the beet fields and the mud and marshes of Ukraine, you come to a huge concrete sarcophagus, encasing the damaged reactor. Certainly, the impression is stronger in December. The image is not the warm waving golden wheat of Ukrainian summer. The area around Chernobyl has the ecological appeal of flat wetlands, the low, quiet mystery of marshes. But it is not a wealthy agricultural region, or a spectacular, panoramic landscape. Although grains grow, the impression to an American is more like rural Maine than the expanse of Kansas or Iowa. Poor, now abandoned, villages look much as a hundred years ago, except electricity runs to them, and the main road is paved.
And then you have the larger towns with the typical East Bloc construction. Concrete buildings stand six, eight, or ten stories, built shabbily and without ornament. And, of course, in the evacuated zone buildings are cracking and crumbling, reverting to nature in a weedy, uneven way. At times, Chernobyl evokes the 1959 film of Neville Shute’s novel On the Beach — it has the look and feel of desertion after nuclear war without the blast damage.
Some 125,000 people lived in the main restricted zone around the four reactors of the Chernobyl power station. Some subsidiary zones in Byelorussia and in the Russian Republic are also restricted. The main restricted zone extends roughly to a 30-kilometer radius around the damaged plant. The zone, it is estimated, will require special management for 100 to 150 years.
At the restricted zone, a two-hour drive north of Kiev, you are stopped by a road block and transfer into cars used only in the contaminated area. My colleague from Kiev and I were given a car for the day, a large black limousine that reportedly had belonged to Prime Minister Ryzhkov. Several months before, Ryzhkov had been down to tour the site and was reportedly not warned that once he drove around the site, the car would be contaminated and its use restricted to the site. So, the so-called “Pripet Research Industrial Association” (PRIA), which now manages the site, has one more property besides the sarcophagus.
Another joke: Gorbachev was in his dacha outside Moscow for the weekend and suddenly received word of more trouble between republics. So, he calls a cabinet meeting for all ministers at the Kremlin in half an hour. Gorbachev goes out and calls to his driver, gets into his limousine, and says, “Take me to central Moscow.” The driver starts, but is only going 90 kilometers an hour. Gorbachev says, “Go faster, go faster.” And the driver says, “I can’t. You have put in new laws that we must drive properly and even the big wigs must obey to set a good example.” Gorbachev says, “Well, I’m chairing a meeting, and I have to be at the Kremlin in 20 minutes, and I’ll drive.” Gorbachev takes the wheel. Sure enough, two motorcycle policemen take up the chase. One policeman says to the other, “Look here, we’ve got one! Look at this big limousine.” One of the policeman speeds up and pulls the limousine to the side. The car window rolls down, there is an exchange, and the motorcycle policeman returns to his colleague, who has been waiting behind the limo with his hand on his gun. The limousine speeds off. The policeman who had remained at a distance says, “Did you give him the ticket?” The second says, “No, I didn’t.” And the first, disappointed asks, “Why not?” His colleague responds, “Well, it was a real big wig.” The disappointed officer asks, “How did you know? Who was it?” “Well, I am not sure, but Gorbachev was his driver!”
The PRIA was established to manage decontamination and research on the site. As one might expect, intense turf battles after the accident involved several organizations. Perhaps a hundred altogether have participated in the clean-up. The most important ones: the Ministry of Atomic Energy and the Ministry of Machine Building, which are responsible for building and operating reactors in the Soviet Union; the military, which had much of the capability to respond quickly, including helicopters, trucks, earth movers, and personnel; the Hydrometeorological Service, which had data about where the radiation was going; and the Soviet Academy of Sciences, which had expertise about materials, health, and other matters. Also immediately after the accident some special commissions were set up to investigate and advise on various issues.
Apparently, chaos ensued. Out of this chaos came a new, so-called Combinat to operate the three enormous 1,000-megawatt reactors that continue to generate electricity at Chernobyl. And, more interestingly for science, came the PRIA, which had 6,000 employees and some 350 million rubles in 1991, a large organization for environmental clean-up, even on the Soviet scale. This institutional creation is analogous to some US experiments for dealing with hazardous waste. In particular, it is reminiscent of Clean Sites, Inc., a nongovernmental, nonprofit organization that sets up independent entities to manage properties and do research on hazardous waste sites in ways credible to government, industry, environmental groups, and local people.
The first lesson from Chernobyl is that existing organizations in the circumstance of a major catastrophe will not likely have the competence or the credibility to do what is needed. In such a situation government and industry both lack credibility. A third party is needed to clean up, foster settlements, and resolve technical disagreements. The Soviets took three years or so to work out the structure of the PRIA. I was impressed with the seriousness and dedication of the people of PRIA and, more important, it seems satisfactory to concerned parties.
PRIA has its headquarters in the town of Chernobyl, about 10 kilometers from the reactor itself, in a small three-story building built after the accident. Employees live outside the zone, although about 1,000 people have returned to live inside the zone, mostly pensioners who expect the risks of Chernobyl to matter less than old age. People who work for the Combinat and PRIA live either in existing towns outside the zone or in new towns built around the zone for the new work force.
After briefings at the headquarters from experts in decontamination, we went together to visit several places in the central zone. We changed into blue cotton trousers, shirts, and jackets, as well as green coats and hats that would be collected upon departure. No masks or special gear are required for protection of health for routine work on site. The uniforms, in addition to minimizing contamination carried out of the zone, do impart a feeling of safety and solidarity. My measured radiation exposure for the day was considerably less than during a chest X-ray.
We visited several places in the restricted, or “contaminated” or “dead” zone; several phrases are used to describe it. Everything seemed open to visit, and my hosts were open and flexible. I had said I was interested in environmental aspects and hazard management. One could easily spend equally interesting days and weeks on health and medicine, or mechanical engineering and materials.
We drew close to the reactor itself, impressive for its scale, massive in absolute terms and in relation to the low woods, flat lands, and water around. We visited the so-called “Red Forest,” the most damaged ecological zone. We visited several temporary waste disposals. Some 600 shallow trenches were dug for storage of soils, trees, cars, almost anything that needed to be “localized” in the site. We went to the abandoned city of Pripet, whose movie theater, restaurants, shops, and amusement park, complete with bumper cars and ferris wheel, decay, empty and still. Human presence shows only by an occasional truck passing through, small and hurriedly built booths to monitor radiation, and classical music playing over loudspeakers on the main streets. We also stopped at one high-level waste depository, a wall of concrete slabs and razor wire on the surface surrounding dozens of containers resembling those used for marine shipping. My guides were two of the leaders of the decontamination effort, one of whom had been there since a few days after the accident in April of 1986. He was on the roof of the reactor early when vapors were still rising from the fire.
The second lesson I would draw from my visit is that imagining practical preparation for accidents as serious as this is hard. How can one seriously prepare to remove, contain, and bury the topsoil from areas extending over hundreds of square kilometers? The PRIA estimates that they have moved a million cubic meters of soil. It is hard to envision a serious exercise in the United States to plan what you are going to do (whoever “you” turns out to be), how you are going to scrape up a million cubic meters of soil, or how you are going to dig 600 trenches. Openly preparing and publishing maps showing where 600 trenches would be on Long Island or in New Hampshire or the Sacramento Valley is unimaginable. If done, it would almost certainly foreclose siting or operating a nuclear plant.
Replacing the water supply is also a vast job. The water supply for much of the area needed to be temporarily replaced. Hundreds of artesian wells were drilled. Still, water problems continue. Pulses of radionuclides, especially cesium-137 and strontium-90, washed down through the entire Dnieper basin, where tens of millions of people draw their drinking water.
Another vast job is recruiting and keeping the many skilled workers needed, whether the 600,000 who are estimated to have participated in the clean-up altogether, or the 6,000 now at the PRIA. I came away thinking that the question of evacuation and response plans as debated in the United States is not meaningful. If an accident this serious happens, what you have thought about does not encompass the scope of what needs to be done. How can you prepare to think about decontaminating every structure in a 2,000 square kilometer zone? My conclusion is not to abandon emergency preparedness, but to concentrate on engineering systems in which the maximum conceivable accidents are not of the dimensions of Chernobyl.
The third lesson that I took away has to do with longevity. Organizations need to last, both for safe operation of nuclear reactors and to deal with wastes, accidents, and their consequences. How does one design enterprises to operate reliably and robustly for generations and longer? PRIA still has a massive decontamination job for several more years to handle obvious, acute problems and then, if it survives, it must turn to chronic, lesser problems and, no doubt, surprises. A looming question is whether to replace or strengthen the sarcophagus around the damaged reactor in perhaps another 20 years. The sarcophagus was built in haste, and now its walls—180 feet high and from 18 to 55 feet thick—have begun in places to turn brittle and crack, a consequence of irradiation and the temperature difference between the hot inner and cooler outer face.
How must organizations be designed to perform such tasks amidst the breakdown of government? Americans have had the same government since 1790 and take stable governance for granted. A handful of countries can say the same–Switzerland, Sweden (allowing for Norway’s separation), the United Kingdom (allowing for the Irish troubles), and perhaps a few others. Even the US had a war between the States.
Experts have speculated at length about improbable threats to nuclear reactors, such as earthquakes and terrorism. I think these are less serious than “normal” political and economic threats. If one thinks back 100 years, the area of the Soviet Union has had two major invasions, two World Wars; it has had a Civil War in the Ukraine in the 1920s; it has had two or maybe three great depressions. Such fluctuation and change is the case for most countries, including in the West–for example, Germany and France. France, which is heavily nuclear, has had several republics, invasions, and uprisings since 1870. How can one build and maintain organizations that will endure competently through long periods of economic and political fluctuations that occur in almost all parts of the world? Suppose Moscow does collapse and there is a lapse or decline in the money coming to Chernobyl. If the 350 million rubles are not there for 1992 or 1993, what is to be done?
Amidst these problems, the Ukrainian Parliament has debated a decree shutting down the three operating blocs at Chernobyl and possibly all nuclear facilities in Ukraine by 1995. Because five other nuclear centers operate in Ukraine, a large fraction of the electricity in the Republic would be lost. Because most of the rest of the electricity in Ukraine comes from coal-fired plants, increasing their output would have high environmental cost. Moreover, the coal mostly comes from the mines in southern Ukraine, where mine workers have been striking to get basic goods such as blankets, shoes, and soap. So, the energy picture is complicated in Ukraine.
The initial response to the Chernobyl accident was the heroism, communitarian behavior, and sacrifice characteristic of many disasters. Now that some years have gone by the pendulum is swinging, and one hears recriminations and accusations. These are tied to the national political and economic situation, as well as shortcomings of the PRIA and other responsible groups. In Ukraine and elsewhere in the former USSR, there is a strong local desire to find people to blame for everything that is wrong, and it is best to blame people from Moscow.
There is an effort to move management of the Chernobyl site from Moscow, where it is still headquartered, down to Kiev. The Ukrainian nationalists have a slogan “no inch of soil to Moscow.” This is written as graffiti. But for Chernobyl what local responsibility is appropriate? Is decontamination and protection of the site not an “all-union” or even global responsibility?
The major ecological problem for the next few years is expected to continue to be that of radionuclides in the soils. As mentioned earlier, the area is wet, the soils are sandy and porous, and the basin holds numerous large reservoirs and rivers. It was considered a good site for a power center partly because of the availability of cooling water. The soils near the plant still hold much strontium, cesium, and plutonium. In the spring when the ground thaws, snow melts, and the water floods into the Pripet River and down into the Dnieper, it carries pulses of contaminants. This is expected to be serious for a few more years. Building underwater dams on the bottom of the reservoirs and the rivers to stop sediments is debated. Whether any proposals of this type will make the situation better is unclear.
Chronic as well as acute problems are being monitored. Every ache and pain in the Ukraine is now attributed to Chernobyl. For example, several hundred kilometers away, in the city of Chernowitz, some 200 children are reported to have begun to lose their hair a couple of years back, and the loss was blamed on Chernobyl. It might have been associated with the accident or with other, probably local factors. The PRIA, Ukrainian Academy of Sciences, and others are trying to sustain research to examine health and environmental consequences of the accident.
This leads to the fourth lesson, a positive one. At least among scientists, the view is that Chernobyl should be turned into an international laboratory, a world heritage site. Governments have accepted the designation of world heritage sites such as the Pyramids of Egypt and biospheric reserves such as the Everglades. Chernobyl is as significant an environmental site as now exists on the planet. In that sense it does belong to everyone. It is an Ur-site of the new green religion.
PRIA has taken first steps to set up an international research center, establishing agreements with the International Atomic Energy Agency in Vienna. Officials of PRIA repeated that they no longer need approval from Moscow or Vienna to invite people and permit certain kinds of research. PRIA wants direct ties with individual scientists and with other organizations around the world. PRIA lacks money to pay external collaborators, so visiting researchers would mainly have to support their own way. Such research has been difficult or impossible on USSR sites for foreign scientists until recently. It is a new, serious opportunity.
International arrangements have become customary for astronomical observatories and atom smashers. International arrangements for governance, funding, and access to the Chernobyl site are worthy of discussion and could set precedents for research on technological hazards.
The fifth and last lesson is about environmental technology. I asked several engineers what turned out to be the environmentally important technologies for Chernobyl. Environmental technologies are more than the obvious ones such as catalytic converters for auto exhaust or “superbugs” to eat oil spills. They include others that are often overlooked. Chernobyl had answers about what technologies mattered. Among them were: sorters, compactors, and compressors for large amounts of material; furnaces that could heat or burn large amounts of material; and finally, dredgers that can operate on complex relief. None of these technologies is quickly, commercially available in large numbers, especially to be plunked down in the middle of the muddy fields and marshes of Ukraine, brought by the Soviet system for delivering goods and services.
On the theme of delivery of goods, a final, telling joke: It has always taken a very long time to order and receive anything in the Soviet Union. Moiseev was inscribed on the list to buy an automobile and had been waiting for many, many years. Then one day the call comes: “Mr. Moiseev, please come down to the office of the automobile company in Kiev, we have some news for you.” Moiseev hastens. At the office, the factory representative says, ‘We are very pleased, Mr. Moiseev, your car will be delivered on April 14, 1995.” Moiseev smiles and says, “Good, okay,” but then frowns and asks, “Can you tell me will it be in the morning or the afternoon?” The man from the factory replies, “Yes, in the morning, but why do you want to know?” Moiseev says, “Oh thank God, the plumber is coming in the afternoon.”
A society that is not set up to respond flexibly in supplying cars and fixing pipes is trying to decontaminate Chernobyl. It is now a land without markets or hierarchies.
In the end, I review the five lessons drawn from the visit. First is the importance of the design of organizations to clean up hazardous sites and perform research related to these sites. The question is initially the invention of temporary or bridging organizations needed in an emergency, organizations that will be effective and credible, and perhaps not so temporary after all.
The second lesson is the limited use of preparedness and evacuation plans. In the late 1950s and early 1960s in the United States, a great debate concerned the viability and value of civil defense. The main conclusion was that not much could be done. My impression from looking at the 600 trenches and seeing first-hand the scope of what actually needed to be done at Chernobyl is that such planning is largely vain. Deterrence, prevention, and inherent safety deserve the emphasis they receive and more.
The third lesson is the importance for environmental management of the longevity of risks and consequences. How can environmental institutions be built and maintained to survive the rises, changes, and falls in political and economic systems?
Fourth is the need to consider the international status of sites of environmental hazards as well as environmental beauty. Scientists and environmentalists are accustomed to advocate the Himalayas or Amazon as part of a common heritage. Chernobyl is equally important. Governments and researchers need to examine the governance, access, funding, and management of such environmentally significant sites.
Fifth, there are the surprises about what prove to be environmentally significant technologies. There is much room for better understanding of important environmental services that should enhance our appreciation of, and influence research on, a range of technologies.
I will conclude by describing the moment that gave me a sudden, intuitive grasp of the challenge of Chernobyl amidst and after perestroika. Trying to relate to the foreign visitor, a villager in the Ukrainian countryside inquired in simple and striking fashion, “Do you have mud in America?”
Bibliography
Haynes, Viktor and Boicun, Marko (1988): The Chernobyl Disaster. Hogarth, London.
Marples, David R. (1986): Chernobyl and Nuclear Power in the USSR. MacMillan, London.
Medvedev, Grigori (1991): The Truth about Chernobyl Tauris/Basic Books, New York.
Reasons to Worry About the Human Environment
This article originally appeared in COSMOS, the journal of the Cosmos Club in Washington, D.C. It has been republished in the journal Technology and Society 21:217-231.
Thoughts are presented on climate and biodiversity, behavioral poisons, libido, depopulation, falling work, rejection of science, and the twilight of the West.
My subject is the insecurity many now experience in the West, by which I refer especially to Europe and its offshoots in the Americas and elsewhere. Deep and valid causes exist for insecurity:
I suspect unintentionally ingested poisons have made us violent and stupid. I fear intentionally ingested medications may be deadening libido and thus the creativity and edge of our societies. I observe the incipient implosion of the populations of most of the rich countries, sure to wreck our social security and further sap our vitality. I observe the falling time, during a life, that we spend employed for pay and wonder what will compensate for the eroding centrality of the work contract. I worry that we will reject science, the source of our paradoxical freedom and the most powerful means to achieve a better standard of living. And I anticipate, like Oswald Spengler in 1918, the decline of the West, the source of modern science and still its only secure home.1
I might mention other night thoughts, of financial and monetary crisis (which the economists and bankers arrogantly believe they have extirpated) or great wars or Africa’s hunger or Earth’s collision with an asteroid, but the night is only so long, and my six fears seem quite enough. More importantly, these fears cohere, culturally and historically.
First I will dwell briefly on two fears that I believe we need not harbor but that have occupied much of my work, namely climate change and loss of biodiversity. Conveying the reasons for my sanguine outlook justifies the apparent digression.
CLIMATE AND BIODIVERSITY
I do not fear climate change, because the human economy is losing its taste for carbon, the main prospective cause. The continuing, steady decarbonization of the energy system means that the concentrations of carbon dioxide will not rise much above 500 ppm, about 40 percent above today’s levels.2 Today’s levels are about 30 percent higher than 100 years ago. The century’s climate change is barely distinguishable in the statistics, notwithstanding detailed analysis by legions of climatologists. More importantly, the consequent impacts on our food production and other matters of concern are of no consequence or lost in the ruckus of history. To offer a flippant but telling example, Europeans, Americans, and Japanese ski much more now than we did in 1896, though it was colder then. I do not believe that a somewhat larger warming over the next 75 years will matter significantly for our diets, health, or incomes. Most of the economy has moved indoors, and much that has not will do so. Climate simply matters less and less.3
Though I do not fear the carbon emissions, I certainly do not defend them. The whole energy system leaks and squanders. Means abound to control it more tightly and efficiently. Engineers and entrepreneurs should get on with the business of concentrating the system safely and cleanly on gas and electricity, and introducing hydrogen and less wasteful devices for generation, distribution, and final use of energy. Researchers can ease the way with ex post and ex ante explanations.
Loss of biodiversity is also, I believe, an issue more of the past than the future. Humans have slashed and burned wildly for many centuries. Happily, observation of changing patterns of land use suggests that the worst is over in many countries, and probably globally. Cities will continue to expand where population grows or rising incomes enable each resident to sprawl further, that is, enjoy increased mobility. Fortunately, the total area cities may encompass is simply not that large. In rich, fast America citizens only take about 600 to 1,000 square meters each.
Globally, the land used for crops is about ten times greater than that for cities. In the United States and many other countries, land cropped is shrinking, because higher yields mean plants need less area on which to grow. The trend will continue and spread to countries where yields have remained low. Similarly, the area of forests used for wood products will diminish, as the Green Revolution that transformed the grains penetrates the trees in conjunction with other means of achieving high–yield forestry. Paul Waggoner, Iddo Wernick, and I have calculated that in the United States over the next 75 years or so, while the population increases by about 100 million, the growing cities, contracting farms, and reduced need for acreage for wood products will release an area of land for other uses equal to 100 times the size of Yellowstone National Park, or an area equal to Bolivia or Nigeria.4
This study of land–sparing in the United States should be repeated for many, even all countries. Surely some will find a different, and saddening, bottom line. Nonetheless, globally the future of land belongs to Nature. Extinctions can become a thing of the past.
Incidentally, what works to save land and the animals feeding on it works in the water, too. Clever aquaculture can end the holocaust of the wild fishes. Aquaculture already approaches one–fifth of all ocean landings of fish and shell-fish by weight.
The regrowth of forests brings its own set of problems. Formerly, Americans regularly burned woodland to encourage palatable grasses and legumes for livestock, to ease movement and, importantly, to keep down the snakes, chiggers, and ticks. Now the ticks are back with the woods and the deer, and with them Lyme disease and meningitis. We may regain some of the fear of forests and the animals that live in them evoked darkly in the German folk tales collected by the Brothers Grimm, published first in 1812–1815. The Grimm Brothers inspired or at least rationalized the work of the nineteenth–century deforesters. We cleared forests and drained swamps not only for land for crops and grazing but for health, safety, and mental security.
But the bugs of the woods are not among my main worries for humanity. Rather let me now explain the dangers I posted at the outset: behavioral poisons, loss of libido, depopulation, falling work, rejection of science, and, finally, the decline of the West.
BEHAVIORAL POISON
I worry that the Industrial Revolution, which has spared us from stoop labor and the hazards of the fields and brought us comfort, convenience, and mobility barely imaginable two centuries ago, has poisoned many among us. The annual worldwide production of most of the toxic heavy metals, including arsenic, cadmium, chromium, copper, lead, and mercury, has increased by 2–3 orders of magnitude over the past 1–2 centuries.5 Notwithstanding impressive gains in containing emissions, significant amounts continue to dissipate, creating chances for unintentional ingestion.6
Hippocrates recognized acute lead toxicity in ancient Greek miners. The sweetening and preserving of sour wines with lead–containing additives began with the Romans and caused severe colic, paralysis, and death until the practice was eliminated in the eighteenth century.7 The comparably acute effects of mercury and other metals have been well–documented. But the possibility, insufficiently researched, also exists that the low–level exposures to the heavy metals released by industry and the consumption of its products over the past two centuries have had serious behavioral effects.
Lead and other metallic elements profoundly alter the nervous system, and thus intelligence, memory, visual retention, and dexterity. Having no known biological role, lead only contaminates the human body. In 1983, a year for which global estimates happen to have been compiled, about 300,000 tons of lead may have been dispersed in the atmosphere and a million tons in the soil.8 At low levels, lead has been shown to cause a variety of learning disorders. Bone lead levels in fact have been convincingly linked to delinquent behaviors.9 Human skeletal lead burdens today show a 500–fold increase over the skeletons of ancient Peruvians who did not smelt.10
Cadmium, like lead, serves no biological function and is virtually absent from humans at birth. Contemporary American cadmium bone levels are about 50 times those found in the bones of Pecos Indians of the North American Southwest circa 1400 A.D.11 Groups of violent and nonviolent incarcerated male criminals differed significantly in cadmium as well as lead levels, measured in hair.12 Similarly, high cadmium and magnesium levels characterized disruptive recruits to the US Navy.13 Manganese madness” is characterized by hallucinations, unusual behavior, emotional instability, and numerous neurological problems. Aluminum and thallium are neurotoxic to varying degrees; their symptoms include depression, difficulty in sleeping, irritability, impulsivity, and violence.
I believe we have yet to understand how the metallic traces humans bear may have affected history. Natural variation in exposure from diverse soils and other sources may explain some past and persisting cultural” differences. The problem was surely very hard in the locales of miners, potters, glaziers, and smelters.14 Coming to the present, the rises of the metallic metabolism of the economy may help explain the observed patterns of chronic violence and, who knows, maybe even wars. Certainly other causes of dimness and violence exist, but a significant, and limitable, fraction may be attributable to this and other factors in the physical environment. We should find out. We could study the behavior of gas station attendants, auto mechanics, and other vulnerable populations.15 We might learn that improvements in air quality decrease aggressive behavior. New York City and many other parts of America have experienced dramatic drops in crime in the past few years. Police have quickly seized credit. Maybe they should share it with clean air legislation and the technologies that enable compliance.
In a more general way, the chance that small leaks from our industrial system have large behavioral consequences intensifies my interest in industrial ecology.l6 Industrial ecology studies the networks of all industrial processes as they interact with each other and live off each other. Observing the totality of material relations among different industries, their products, and the environment, we find big chances for reducing wastes and drips. We will hold the grail of the materials and energy systems when no drips remain to be caught, when emissions and dissipation approach zero.
LIBIDO
The curious converse of my worry about the rise of aggression from unintentional ingestion of metals is the decline of libido from the intentional consumption of medication. Libido refers to desire or, more formally, the emotional or psychic energy derived from primitive biological urges. Recently, alarms have drawn attention to the possible role of endocrine disrupters in reproductive failure and developmental twists in humans and other animals.17 The alleged culprits include plastic wrap and pesticides. My concern is psychiatric drugging.
The “modern” era of psychiatric drug treatment began in the 1950s with the introduction of tranquilizers to control excitement, agitation, and aggressivity, mostly in hospital settings.18 The current wisdom of the doctors suggests that 5 percent to 10 percent of populations in countries such as the United States and France suffer depression. Though the affected fraction of the population is very subjective, I accept the horribly painful and costly reality of mental illness as well as its physiological basis. Depression, for example, appears to be connected to the serotonin level in the brain, with which, incidentally, cadmium may interfere.19
Side effects of the tranquilizers and the subsequent first generation of antidepressants, the tricyclics, limited their diffusion. As for most innovations, bigger markets awaited better products. These came along in the 1980s in the form of Prozac (fluoxetine) and other drugs which selectively alter serotonin catabolism in the brain. America, always the innovator, leads in acceptance. Prescriptions for antidepressants from office–based psychiatric visits soared in the United States from about 2.5 million in 1980 to 4.7 million in 1989. 20 Increases were particularly evident for male patients, young adult patients, and patients with neurotic disorders. The overall prevalence of antidepressant use in certain communities quadrupled in a recent 10–year span.21 By May 1995, 10.5 million Americans were reportedly taking Prozac, and perhaps 15–20 million worldwide.22 Many more are taking chemically similar Zoloft and Paxil, and several new antidepressants are pending approval with the US Food and Drug Administration. In France, in 1995 about 3 percent of the population used the eight main antidepressants.23 The global market for antidepressants is expected to reach more than $6 billion by 1998, having doubled in four years.24
For younger people, access to the pharmacopoeia has also broadened. The line between children with “normal” variations of temper, lively or spontaneous children who are sensitive to stimuli, and those who have a “disorder” has shifted. In part the reason may be that with more women working outside the home, younger children are required to adhere to a more organized and less flexible social structure, in school or around the home. Seeing fewer children, parents may also more quickly think a particular child extraordinary, for better or worse. Maybe the causes include lead, cadmium, and other elemental exposures. In any case, a massive increase has occurred in the United States of diagnoses of Attention Deficit–Hyperactivity Disorder (ADHD). The drug of choice in this case is Ritalin (methylphenidate), which often improves the focus and performance of those diagnosed with ADHD. In 1995, 2.6 million Americans were taking Ritalin, a five–fold increase from 1990. 25 The vast majority of users are boys between 5 and 12, in fact more than 10 percent of boys in this age group.
My point is not to condemn the drugs. The drugs work. They are intended to change the individual’s mood, and they do. But, social mood is also exceedingly important. As with the toxic heavy metals, I think we have yet to consider the collective effects of all these, and other fresh chemicals, that we are voluntarily ingesting. Yet, we nod knowingly about the effects of alcoholism in many societies. We readily accept that crack cocaine caused an epidemic of violence in New York and other American cities in the mid–1980s and that its retreat contributed to falling crime.
Prozac is well–known to cause sexual dysfunction, along with general calming. Who needs endocrine disrupters? Maybe the attack on depression and hyperactivity is affecting aggression, violence, crime, and many other antisocial behaviors. But creativity in all its forms—economic, scientific, artistic—also often first appears as antisocial behavior. Maybe America and other nations are prescribing themselves a gradual but gigantic and deadly loss of libido. An ironic end to the Freudian century.
DEPOPULATION 26
Long before Prozac and Ritalin, western nations began to raise fewer children. The French, during the Revolution of 1789, were the first moderns to reduce fertility. The reason was not the death of sex. Rather the Revolutionary government abolished primogeniture, the practice of bequeathing all property to the first son. The splitting of inheritance and wealth would mean downward social mobility. The lever left to the family was to reduce offspring, and parents used it. Two hundred years later, on average, a woman in Europe or Japan now bears only about 1.4 children along her fertile span. As is well known, to preserve a population, the rate should be around 2.1. The gap means that numerous national populations, and that of Europe as a whole, are imploding. To give an example, if Japanese women sustain their present fertility (1.4 in 1995), the population of Japan will fall from 125 million today to 55 million in 2100. This apparent success for family planning worries me.
First one needs to understand the reasons for family size. The logic tends to be economic, as in the French case. The main question is, are children a burden or an asset? Both, naturally, although the burden tends to fall on the female, while the asset accrues to the family as a whole.27 Historically, even in periods of high fertility, the wealthy have had few children. In a well–off family, in most circumstances, children are not assets. Growing and educating them at the appropriate standard costs a lot. They bring no income when they are young. Aging but still wealthy parents do not need them for support; care for the old people is left to third parties financed by the income or assets of the old people. If static property such as land forms the wealth, many children would inevitably split it. These reasons explain the pre–modern family size of the rich. Nowadays wealth at large links more to financial assets than to static property. Still, child costs remain the same.
In the absence of economic incentive for families, a second basic reproductive instinct remains, that of continuity. Adults beyond reproductive age who realize that there is nothing after them rage and despair. Their genes will disappear. They have traveled their mission without delivering their message.
Assuming the basic instinct for continuity is finally stronger than bare economic considerations, then every couple longs for a child. With child mortality at around 1 percent, one child should be enough. But here another argument, or instinct, comes in. The child should be male. If we put biological mechanisms in control, this request makes sense, as otherwise the Y–gene would be lost. Perhaps the cultural practices favoring sons are an externalization of the basic instinct in folkloric disguise.
In any case, suppose couples reproduce starting with the idea of a boy. About 50 percent of them get one. The other half get a girl and a dilemma: what to do next? We may assume that the parents decide on a second try, the last, if unsuccessful. With this strategy in mind, and taking into account that about 15 percent of women never give birth for various reasons, the outcome is a fertility rate of about 1.3 per female, almost exactly the present fertility rate in European countries, including Germany, Spain, and Italy.28 If the reasoning is correct, the fertility rate is unlikely to change, because of a lack of driving forces in the short term. In fact, assuming immigration does not compensate, a population with a total fertility rate of 1.3 per female is unstable and converges to very small numbers in a few generations.
Though the implosion of our population might reopen niches for the rest of Nature, it promises severe stress for the surviving humans. Means for social security can be internal or external to the family but require children in both cases. Where means external to the family do not provide old age benefits, children are the only insurance for old age. With external mechanisms, as in the welfare state, the children in the system become a “common.” Children are economically decoupled from the family, but they are still coupled to society because, collectively, they must earn the pensions paid to old–timers. These commons can suffer a tragedy if everyone takes away and nobody restores the resource. In fact, with a plausible rate of long–run productivity growth (2 percent per year), most European countries and Japan currently do not have enough children for ensuring the pension system at levels their citizens expect. Moreover, chronic overcapacity may weaken the incentives to achieve productivity growth in these societies.
Perhaps the wreck of the pension system will set forces in action to restore higher fertility rates well ahead of the shrinking to zero of the total population. The publicity about endocrine disrupters may signal the need to try to reproduce. In fact, Sweden for a while somewhat countered the trend toward the lowering (to 1.3) of the total fertility in Europe. Swedes, after a decrease from a value of 2.5 in 1964 to 1.6 in 1978, started a rise in 1983, peaked at 2.13 in 1990 but have since again fallen below 2.00. 29 After slumping to about 1.7 in 1976, the US total fertility rate has remained about 2.1 in the 1990s. The former Soviet Union may also provide a useful case study. Fluctuations and changes in financial systems wiped out Soviet savings and pensions, putting older persons, many of whom have had only one child, at great risk. We should watch to see whether the present Russian youngsters repeat their parents’ gamble. Understanding episodes of rising fertility and pro–natalist policies matters greatly for the West, Japan, and eventually a list of other nations. The alternative, immigration, has historically proven an irritating cure for depopulation.
As with the metals and the psychiatric drugs, we must also be alert for collective, and noneconomic, effects in the society of the small family. Increasing longevity and improving prostheses for older persons can preserve numbers and vitality for a while. But the vis vitalis, life’s vital force, is not evenly distributed by age, and indeed it may not be equal among children. Frank Sulloway has argued that birth order weighs exceedingly heavy in determining creative lives.30 First children conform to authority, while younger ones are born to rebel. Charles Darwin was the fifth of six children, and the youngest son of a youngest son going back four generations, while his mother’s father was the youngest of 13 children; Benjamin Franklin was the fifteenth of 17 siblings and the youngest son of a youngest son for five generations. If we wish to keep a low birth rate, perhaps we should at least concentrate the fertility in a few families to maintain some psychological diversity.
Such concerns are probably secondary to the strife over social insurance sure to accompany depopulation. Recall that the preceding transition, from the security of the large family, helped create the space for the Communist dream and its realizations. Indeed, the German Chancellor Bismarck adopted the first social security system in the 1880s to forestall the gains of the Socialists. As late as 1940 pensions covered only about 4 million American workers. Neither employers nor the state will welcome the intensification of the debate over social responsibility soon to come.
FALLING WORK
Scarce youth might cause a tight labor market and encourage older workers to remain longer in jobs, alleviating both youth unemployment and the social security problem. On the contrary, the present era is the worst for employment since the 1930s in the industrialized nations, with the significant exception of the United States.31 Probably 20 percent of those who want jobs lack them. Even in the United States, with low reported unemployment, workers retire ever earlier, now barely above 60. The labor force participation rate for American men aged 55–64 dropped from 90 percent in 1948 to 83 percent in 1970 to 65 percent in 1994.
One reason is surely cyclical. The world is at the low point in the roughly 55–year pulsations of the economy, the so–called Kondratieff waves.32 While traditional employers have shed many workers, the industries that will newly employ many more, basically connected with information handling, one might say the Internet for short, have started vigorously in only a few countries, particularly the United States. The Internet vastly reduces transaction costs, in money and time, and thus can coalesce innumerable new markets, for news about heavy metal rock and roll groups or for obscure types of scrap metal. The Web will make its Wirtschaftswunder, but not pervasively for another decade or two.
Nevertheless, the secular trend is toward less work.33 Since the mid–nineteenth century, on average people in the industrialized nations have been working significantly less while living longer. While the average career length has remained around 40 years, the total life–hours worked shrank for an average UK worker from about 125,000 hours in the 1850s to fewer than 70,000 hours in the 1980s. UK male workers dropped from 150,000 to 88,000 lifetime hours at paid work, while UK working women dropped from 63,000 to 40,000. Well–documented long–run reductions in annual per capita work time in many countries suggest the universality of the trend.34
The combination of reduced lifetime working hours and increased life expectancy has caused a huge shift in life experience. While in 1856 half of the disposable life–hours of workers were spent working, the portion has fallen to less than one–fifth today. If the trends continue, soon after the year 2000 half of the years of the average worker will occur before or after work. Even in the working half of an individual’s life, formal work will account for a decreasing fraction of time, one–third or less, and should leave more time, for leisure and other activities such as caring for a child (or two) and the home. If the long–term trends continue at their historic rates, the work week might average 27 hours by the year 2050.
The formalized work contract has historically been the central economic and social fact in industrialized countries. It has not only regulated the standard of living, but also served as the most important factor for social integration. The secular trend away from the formal work to other socially obligatory activities and to free time implies numerous social challenges. Societies must examine whether their employment, pension, education, and other policies reflect the dominance non–work and free time have obtained over work.
New organizational models of distributing employment should be possible and indeed are already evident. “Temporary” employment agencies have displaced the famous manufacturing corporations as the largest employers in the United States. Labor economist Ronald Kutscher has described the strategy of assembling a just–in–time labor force,” analogous to the parts now kept flexibly available in “just–in–time inventory.”35 The projected 27–hour average work week may match even better temporary and contingent workers. In any case, labor market policies can enhance the distribution of work through the shortening of working time, more flexible working hours, and job sharing.
The fall of work changes pensions on a scale comparable to the demographic implosion. In the 1850s, a career for a UK male averaged about 47 years. Before education became mandatory, work began young, often around 10, and healthy men 1abored until they died. Indeed, at age 10 males expected only about 48 more years of life, so many did not experience the natural end of a working career or feel the need for pension. Now US males on average seek about 10 years and females about 20 years of pension.
Superior management of the financial assets of pension systems may raise the rate of return on the funds invested, but the gain seems unlikely to overcome calculable deficits without also postponing the age of retirement and eligibility for pension. Scaling pensions to contributions and life left solves the problem, but politicians will not dare to implement it. Unfortunately, the present reality is that per capita work is disappearing, so people are retiring, and thus ceasing to contribute, ever younger.
In the age of work through which the industrialized nations appear to have passed, the corporation was the central and characteristic institution of society. The corporation in its several forms was one of the great organizational innovations of the nineteenth century, an enabling technology for the Industrial Revolution, shaping not only income and health but social status, security, architecture, and numerous other features of the human environment.36 Obviously, if work time shrinks, the times of life that are not part of the formal work contract expand. With formal work losing its traditional place, so probably does the corporation.
Dynamic technology, markets, and management compound the question of the social role of the corporation. In many sectors several generations of corporations come and go in an 80–year human lifetime or even in a 40–year work career.37 In the American model of easy corporate entry and exit, a large fraction of private sector workers are employed by corporations whose life expectancy is short, 10 years or less. Moreover, the globalization of industry appears to favor frequent relocation of sites of employment in the quest for competitive advantage. Perhaps universities and other long–lived organizations, including parts of government, can play a larger role in a world in which work offers short–lived identity and stability. The need is for institutions which impart continuity.
I have only hinted at the essential cause of falling work. At the outset of this essay I emphasized the inexorable role of technology in raising the productivity of energy and land. Technologies spare not only physical resources, they spare labor. In 1975, 12.5 hours of American labor were required to produce a metric ton of cold–rolled steel sheet; in 1995, 4.4 hours were required. In fact, I suspect the desire to work less while living longer drives the human social system. I am scared because the prospect of success may be near, that is, a prospect in which globally and on average the production of goods is largely a solved problem, but the distribution of wealth, security, and status is not.
REJECTION OF SCIENCE
A large population might work less and tread more lightly in our environment either by restraining its consumption or by getting much more clever at both production and consumption. I am pessimistic about the chances for managing our wants downward. Few rich choose to become poor and few rich feel rich enough, so we must revolutionize the economy. The way is to better everything we do by 2 percent per year faster than population change, to compound productivity gains broadly, year after year.
Knowledge is what now grows productivity, and science and engineering are the most powerful forms of knowledge. They demonstrate their effectiveness every moment. Wisely used, science and technology can liberate the environment, can spare the Earth.38 Carbon–free hydrogen energy, food and fiber decoupled from acreage, and closed–loop industrial ecosystems can assuage fears about changing climate, vanishing species, and poisoning metals.
The aggressive search for knowledge and its application is perhaps the most significant contribution of Western civilization. The game began centuries ago but has reached completely new levels in the past 50 years, above all in the United States. Many industries have systematized their search for better practice and have the gains to show. I have mentioned the case of steel. The hard search is costly and requires skillful organization. And, I would emphasize, courage and confidence and the tolerance that can accompany them. Science, the structured and sanctioned overthrowing of authority, is the purest form of continuous improvement.
I believe the greatest threat to future well–being is the rejection of science. Having come this far, the 5.8 billion cannot take the road back. The Islamic world held the cutting edge of science until past 1100 A.D. Then it rejected the windmill and, later and repeatedly, the printing press. Loss of economic and political leadership followed.39 The objects of science, the technology, can be taken without the values. The corsairs of the Barbary Coast which raided British vessels for 50 years or so were in fact piloted by renegade Britons and Icelanders; when the foreigners died, their knowledge of sailing was rejected and forgotten. Voltaire noted that after 60 years of Swiss watch exports, no one in the Middle East could make or repair a watch.
So cultures can and do reject science. Or be excluded from it. Women have been. Historian David Noble convincingly traces the exclusion to the clerical ascetic culture of the Latin church, which gave birth to modern science but only as a male vocation.40 The otherwise revolutionary Galileo, concentrating on his own calling and knowing the costs of raising and marrying daughters, contrived to place his two girls, aged 11 and 12, in a convent in the year 1613. Livia suffered a permanent breakdown. The second, Virginia, whom her father praised as “a woman of exquisite mind,” dreamed of fathoming the heavens. She never left the strict enclosure of San Matteo in Arcetri, which did not permit her scientific pursuits.
In 1950, in the United States, one woman and 416 men received doctoral degrees in engineering, while five women and 353 men did so in physics. Today in the United States about one in six of doctoral students in engineering are women; the ratio is one in four in physical sciences and mathematics. In most sectors, the feminization of work and power is now well underway. While women provided about 15 percent of career years in the 1850s in the United Kingdom, they currently provide well over 30 percent. Science now seems likely to suffer if women reject it or it rejects women.
We should, of course, recall that the same church culture that excluded women had adopted the idea during the twelfth and thirteenth centuries, Baconian natural theology, that changed the role of men (at least) from passive recipients of spiritual messages through natural phenomena to active seekers for an understanding of the divine nature as reflected in the pattern of creation. The Book of Nature joined the Book of Scripture as a way to the mind of God. This opened the door to objective examination of nature and to experimental science. Medieval historian Lynn White, Jr. conjectured that the timing of the emergence of science may have owed to the process of defending the Christian position against the heresy of the Cathars, who upheld the existence of two gods, one good and one evil.41 The creation of the evil god was the visible universe.
The point is that past changes in science have related to changes in basic religious attitudes, in aesthetic perceptions, and in social relationships, as well as to economics and politics. Along with money, science must have a positive emotional context to thrive.42 As White observed, the modern outburst of scientific activity is not necessarily permanent.
THE TWILIGHT OF THE WEST
Why would science fail? Because of my final worry, the decline of the West, Europe in particular. As stated earlier, modern science is the greatest gift of Europe, rooted in particular forms of Christianity. Now I observe Europe full of self–doubt and self–hatred. Partly the mood properly reflects the lethal misadventures of this and other centuries. Still, the morbidity reaches its perigee in European as well as in American groups in the discussion of “sustainable development,” the environmental rubric for a confined future. It is hard to believe that at the start of the twentieth century Europe was spreading its messages confidently to every corner of the planet. I wonder whether the self–mortifying West (or North) will be rich or expansive enough to maintain science.
The United States and some of the other European offshoots, Canada and Australia, for example, still seem to be growing, at least demographically. The United States acquired the scientific lead from Europe in the 1930s and has carried it to new and glorious levels, especially in California, where inhibitions are famously few. Perhaps the former European colonies will maintain science for a century or two after Europe abandons it. Goa, in India, built baroque Portuguese cathedrals long after the metropole stopped. Latin America, which belatedly picked up the European form of the novel and made it flourish, magically, in the late twentieth century, might do the same for science.
Sadly, one can imagine a shrinking Europe, whose residences fill with immigrants from the Mahgreb, who spread their culture, hostile to science. The 5,624 mills listed in England in the Domesday book of 1086 exceeded the mills in the Ottoman Empire at its height.43 The Far East remains a question. A recent Nature article entitled “Can Confucius Excuse Poor Creativity?” listed factors that seriously undermine Korean creativity. 44 Then Nature queried, “And those who have returned from the creative hot–houses in the West? As soon as they return, it is said with a rueful laugh, they become Koreans again.” Spengler perceptively characterized western culture as Faustian,” symbolized by pure and limitless space, limitless striving and aspiration, its architectural symbols the soaring vaults and spires of a Gothic cathedral.45
Spengler particularly contrasted the West’s Faustian culture with what he called the Magian, whose proponents dwell in a magical world of mysterious presences. Western culture had superseded the Magian around 1000 A.D., according to Spengler. For how long?
CONCLUSION
We have causes for insecurity. We may be stupefied, subdued, aged, underemployed, and ashamed. Under these conditions we will not reproduce ourselves or our culture, and then I believe the best chance for a better human environment for everyone is lost.
Civilizations have simply melted away because of poor reproductive rates of the dominant class. We should not forget that the European supremacy started with a reproductive stir during the last part of the first millennium and continued with ups and downs until the end of the nineteenth century. The question may be whether underneath the personal decision to procreate lies a subliminal social mood influencing the process, as endorphins do. The subliminal mood of Europe and its retinue could now be for a blackout after 1,000 years on stage.
Yet, my hope is that the West is merely in the trough of a Kondratieff wave, basking in the depression. After all, science is surely early in what it can achieve. A look at progress in mapping the genome proves it. We must create the wealth and continue lifting the inhibitions to enable science to flourish. Science in turn can provide the means for a pure, rich economy. We can sell science and its products lucratively and helpfully to the rest of the world. It frees us, though often to solve problems that did not exist without science. But to overcome our morbidity and restore our belief in infinity will require more than science, perhaps a new or revived religion.
Acknowledgments
I am grateful to Arnulf Gruebler, Cesare Marchetti, Perrin Meyer, Paul Waggoner, Iddo Wernick, and Doron Weber for working with me on the problems discussed here; none of them is responsible for the views expressed.
REFERENCES
1 – O Spengler, The Decline of the West, Oxford, New York, one volume edition, republished 1991. Spengler published the 1st volume of his Der Untergang des Abendlandes in 1918 and the 2nd in 1922.
2 – JH Ausubel, A Gruebler, and N Nakicenovic, Carbon Dioxide Emissions in a Methane Economy, Climatic Change 12(3):245–264, 1988.
3 – JH Ausubel, Does Climate Still Matter? Nature 350:649–652, 1991; JH Ausubel, The Liberation of the Environment, Daedalus 153(3):I–17, 1996.
5 – JM Pacyna, Atmospheric Trace Elements From Natural and Anthorpogenic Sources, in Toxic Metals in the Atmosphere, JO Nriagu and C Davidson, eds., Wiley, New York, 1986.
6 – RU Ayres and LW Ayres, Industrial Ecology: Towards Closing the Materials Cycle, Edward Elgar, Cheltenham UK, 1996.
7 – J Eisinger, Lead and Wine: Eberhard Gockel and the Colica Pictonum, Medical History 26:279–302, 1982. Lead was also used in women’s cosmetics (Science 265:1655, 1994).
8 – JO Nriagu and JM Pacyna, Quantitative Assessment of Worldwide Contamination of Air, Water and Soils by Trace Metals, Nature 333:134–139, 1988.
9 – HL Needleman, JA Riess, MJ Tobin, GE Biesecker, and JB Greenhouse, Bone Lead Levels and Delinquent Behavior, Journal of the American Medical Association 275:363–369, 1996.
10 – JE Ericson, H Shirahata, and CC Patterson, Skeletal Concentrations in Ancient Peruvians, New England Journal of Medicine 300(17):946–951, 1979.
11 – JE Ericson, DR Smith, and AR Flegal, Skeletal Concentrations of Lead, Cadmium, Zinc, and Silver in Ancient North American Pecos Indians,
Environmental Health Perspectives 93:217–223, 1991.
12 – L Hastings, Neurotoxicology of Cadmium, in Handbook of Neurotoxicology, LW Chang and RS Dyer, eds., Marcel Dekker, New York, 1995, pp. 171–212; RO Pihl and F Ervin, Lead and Cadmium Levels in Violent Criminals, Psychological Reports 66:839–844, 1990.
13 – RE Struempler, GE Larson, and B Rimland, Hair Mineral Analysis and Disruptive Behavior in Clinically Normal Young Men, Journal of Learning Disabilities 18(10):609–612, 1985.
14 – Recall also that early paints, glasses, and stucco were often loaded with lead.
15 – Bootleggers, for example. Moonshine whiskey was often loaded with lead (and other metals), because car radiators served as condensers.
16 – RA Frosch, Toward the End of Waste: Reflections on a New Ecology of Industry, Daedalus 125(3):199–212.
17 – T Colborn, D Dumanoski, and JP Myers, Our Stolen Future: Are We Threatening our Fertility, Intelligence, and Survival?— A Scientific Detective Story, Dutton, New York, 1996.
18 – DH Jacobs, Psychiatric Drugging—40 Years of Pseudo–Science, Self–Interest, and Indifference to Harm, Journal of Mind and Behavior 16(4): 421–470, 1995.
19 – RB Rastogi, Z Merali, and RL Singhal, Cadmium Alters Behaviour and the Biosynthetic Capacity for Catecholamines and Serotonin in Neonatal Rat Brain, Journal of Neuro–chemistry 28:789–794, 1977.
20 – M Olfson, GL Klerman, Trends in the Prescription of Antidepressants by Office–Based Psychiatrists, American Journal of Psychiatry 150(4):571–577, 1993.
21 – A Hume et al., Is Antidepressant Use Changing? Prevalence and Clinical Correlates in Two New England Communities, Pharmacotherapy 15:78–84, 1995.
22 – D Pine, The Prozac Dilemma, Woman’s Day 58(6):70–74.
23 – F Rouillon, C Blachier, JP Dreyfus, M Bouhassira, and MP Allicar, Etude Pharmaco–Epidemiologique de la Consommation des Antidepresseurs en Population Générale, Encephale 22(l):39–48, 1996.
24 – H Critser, Oh, How Happy We Will Be, Harper’s 292(1753): 39–48, 1996.
25 – LH Diller, The Run on Ritalin: Attention Deficit Disorder and Stimulant Treatment in the 1990s, Hastings Center Report 26(2):12–18.
26 – This section draws heavily on C Marchetti, PS Meyer, and JH Ausubel, Human Population Dynamics Revisited with the Logistic Model: How Much Can Be Modeled and Predicted?, Technological Forecasting and Social Change 52:1–30, 1996.
27 – A Mother’s work consists mainly of grooming, feeding, safeguarding, and so forth; one recent study showed that the average American woman at home spends less than ten minutes a day playing with or reading to her child (S Scarr, Mother Care, Other Care, Basic Books, New York, 1984, pp. 26–27).
28 – If 15 percent of females have no children, 43 percent of females have a boy, and 42 percent have two kids, the total fertility rate is equal to 1.27.
29 – J–P Sardon, Fecundité Générale, L’Institut National d’Etudes Demographiques, Paris, 1994.
30 – F J Sulloway, Born to Rebel, Pantheon, New York, 1996.
31 – International Labor Organization (ILO), Yearbook of Labour Statistics, 55th Issue, ILO, Geneva; International Labor Organization, World Employment 1996/1997: National Policies in a Global Context, ILO, Geneva, 1996.
32 – C Marchetti, Fifty–Year Pulsation in Human Affairs: Analysis of Some Physical Indicators, Futures 17(3):376–388, 1986.
33 – This section draws on JH Ausubel and A Gruebler, Working Less and Living Longer: Long–Term Trends in Working Time and Time Budgets, Technological Forecasting and Social Change 50(3):195–213.
34 – Since the mid–1980s the decline in annual working hours for those who work full–time appears to have slowed down, even reversed in some countries (O Marchand, Une Comparaison Internationale de Temps de Travail, Futuribles 165–166(5–6):29–39, 1992). This factor may have accentuated the unemployment problems in several countries.
35 – R Kutscher, Growth of Service Employment in the United States in Technology in Services: Policies for Growth, Trade, and Employment, BR Guile and JB Quinn, eds., National Academy, Washington, DC, 1988, pp. 47–75.
36 – C Kaysen (ed.), The American Corporation Today, Oxford, New York, 1996.
37 – WL Crum, The Age Structure of the Corporate System, University of California, Berkeley, 1953.
38 – JH Ausubel, The Liberation of the Environment, Daedalus 125(3):I–17; JH Ausubel, Can Technology Spare the Earth?, American Scientist 84(2):166–178.
39 – B Lewis, The West and the Middle East, Foreign Affairs 76(l):114–130, 1997; B Lewis, Islam in History: Ideas, People, and Events in the Middle East, 2nd edition, Open Court, Chicago & La Salle IL, 1993.
40 – DF Noble, A World Without Women: The Christian Clerical Culture of Western Science, Knopf, New York, 1992.
41 – L White, Jr., Dynamo and Virgin Reconsidered: Essays in the Dynamism of Western Culture, MIT, Cambridge, 1968. See especially “The Context of Science,” pp. 95–106.
42 – For a congeries of present “anti–science” in the United States, see PR Gross, N Levitt, and MW Lewis, eds., The Flight from Science and Reason, Annals of the New York Academy of Sciences Vol. 775, New York, 1996. Also indicative of the present mood, writer Paul Horgan argues that researchers have reached the limits of knowledge in many disciplines in The End of Science (Addison Wesley, New York, 1996). TF Homer–Dixon even argues for the decumulation of the stock of knowledge in The Ingenuity Gap: Can Poor Countries Adapt to Resource Scarcity?, Population and Development Review 21(3): 587–612, 1995.
43 – L White, Jr., Medieval Technology and Social Change, Oxford, New York, 1966, pp. 80–89; CP Issawi, The Middle East Economy: Decline and Recovery: Selected Essays, Markus Wiener Publishers, Princeton, NJ, 1995. The Nobel–prize winning physicist Abdus Salam was a member of Pakistan’s Ahmadiya community, a persecuted religious minority declared “beyond the pale of Islam” by an international panel of Muslim jurists in 1974; Ahmadis believe that the second coming of Christ happened in India nearly a century ago (see Nature 384:296, 1996).
44 – Nature 384:197, 1996
45 – Contrast Spengler’s characterization with the innumerable publications of the past decades on “limits” and “scarcity.” These are well–summarized in JE Cohen, How Many People Can the Earth Support?, Norton, New York.
Dematerialization: variety, caution, and persistence
Resources and Environment in the 21st Century: Seeing Past the Phantoms
1. Introduction
The marathon of economic development kicks up clouds of questions about resource and environmental stresses. In the end, they come down to two. Will there be enough resources to serve humanity? Will the environmental fallout from the use of resources harm other life and us?
The expected answer to each question is “yes.”
As I will report, my search of the book of history and my projections for the 21st century based on the historical patterns I find suggest that many of the usual specters of shortage and fallout are phantoms. Instead, I see a society learning to use resources efficiently and cleanly. Keys described along the way include market substitution, precision agriculture, dematerialization, decarbonization, and industrial ecology. Unfortunately, I will not leave you, the reader, without worries. But, I hope to shift attention from the spell-binding phantoms to real stresses that we should sweat to relieve. Let us not exhaust ourselves chasing phantoms, when the race before us is anyway long and hard.
First, I offer a few words to describe the two multipliers of resource and environmental factors: Population and GDP per capita. As I proceed, the divisors will also emerge.
Population: Humans now number about 5.8 billion. Annual growth peaked near 2% in 1970 and has dropped below 1.4%. More than 90% of growth is in the so-called Developing Countries. In fact, the populations of one set of countries are exploding while others are imploding. Combinations of fertility rates near or more than the 2.1 children per woman that replaces present population plus increases in length of life make explosions in countries such as India, Iran, and Nigeria. Fertility far below replacement and populations already near the present limit of longevity start slow implosions in countries such as Japan and Italy. For example, if Japanese women continue bearing about 1.4 children, the population of Japan will fall from about 125 million today to 55 in the year 2100. US population seems likely to grow about 50% over this period, from about 270 million to about 400. Most demographers expect world population to reach 10 billion by 2100, a compound growth rate from today of about 0.5%/yr. However, because no one knows how many children parents will choose in the future, this number may be a way station upward, a plateau, or a peak before a fall.
GDP per capita: Over long periods, including the booms and busts no economy has learned to escape, GDP per capita grows slowly. For example, the annual rise of GDP per person in the US has averaged 1.7% since 1900 and 1.4% since 1985. Between 1965-1996 the GDP per Mexican rose 1.7% yearly, per Indian 2.4%, and per Japanese 3.7%. The present slump in Asia reminds us that economies rarely sustain high growth for more than two to three decades.
Combining annual growth of population and GDP per population gives GDP growth, the total multiplier of resource and environmental matters. Since the start of the industrial revolution, GDP in the US and UK has risen about 2.3%/yr. During the long run ahead, global growth of between 2% and 3%/yr again appears likely. Unmodified by a divisor, compounding by 2.3% doubles a resource demand or an environmental impact in about 30 years, quadruples it in 60, and multiplies it eightfold in about a century. By this arithmetic, world GDP itself would rise from about $25 to $200 trillion, giving 10 billion people $20,000 each in 2100.
2. Will there be enough?
Energy: Globally over the past two centuries, a succession of primary sources has held the largest share of the energy market: first wood and hay (dominating until the 1870s), then coal (peaking in the 1920s), and oil (peaking in the 1970s). If the succession continues, natural gas will move ahead, peaking around 2030.
So far, humanity has burned about 180 billion tons coal equivalent (btce), a reference point for the other fuels. We have burned about 75% as much oil (130 btce), and 40% as much natural gas (75 btce). In a scenario of continuing market substitution, perhaps 100 btce more of coal will be used, 300 btce of oil, and 1000 btce or more of gas. This scenario implies a worldwide phase-out of coal during the next 50 years at 2.5%/yr, leaving huge reserves underground.
Proved oil reserves (which exceed 200 btce) and resources can meet the oil demand. Though the bulk of its use lies ahead, oil will fade from prominence. Beginning in a decade or so, fuel cells drawing on natural gas and, later, neat hydrogen will power the world’s vehicles. The mean secular decline in oil production may be 1.5%/yr.
Although the upper bound of estimates of technically recoverable natural gas resources is now about 700 btce, evidence is growing of widespread and more abundant methane than traditional geological theory holds. This evidence lifts estimates of gas steeply even in the US and keeps prices low. I match this optimism with a caution and a business opportunity. Expanding demand for gas, at perhaps 4%/yr, will require construction and operation of pipelines and other means for shipment with much larger and more extensive capacity than now.
Globally, more than one-third of primary fuels now becomes electricity, twice the share 50 years ago. Still, two billion people lack electricity. The unique ability to run information machines plus opportunities in transport now powered by oil will combine with the billions yet to be wired to grow electric demand. Demand may conceivably grow from the present 1.5 terawatt (TW or 109 kilowatt) years to 30 TW yrs or more in 2100. Ten billion people using today’s US electricity per capita would consume about 15 TW yrs.
Dividing the multipliers of population and GDP, efficiency in generation, transmission, distribution, and end-use will temper demand. Efficient gas turbines appear the generator of choice for a broad mid-range of additions to capacity. At prices up to about $4.50 per million BTU, twice the recent average price, gas should gradually drive coal from power stations. Approaching a $200 trillion economy, annual gas use could peak at 30 x 1012 m3, an order of magnitude above oil’s peak use. Absolute gas use should peak about the year 2060.
Notwithstanding hopes, the so-called solar and renewable energies (wind, photovoltaics, biomass, et al.) still show promise only for small niches. Solar enthusiasts tend to stress that solar energy is free. All natural resources are in fact free. What costs is mobilizing the resources and making the products flow to the consumer in the proper form and amount. Here the solar and renewable proposals continue to bog down. Even with technical breakthroughs, these sources, and their hard counterpart, fusion, would take a long, long time to reach a consequential level.
Making gigawatts at each site, nuclear plants already add consequential amounts of energy to the world’s energy supply and continue to offer advantages for large additions to capacity. Either once-through or recycled uranium can fill likely nuclear demand. A scenario of high demand invokes worries about uranium supplies and thus the recycling, which so-called breeder reactors can perform. While we are sheltered by the main reliance of the energy system on natural gas for the next 60-70 years, the growth of nuclear energy has time to resume. Generating large amounts of both electricity and hydrogen in the latter part of the 21st century, nuclear should become the primary source of energy.
Continuing substitutions of one source for another should amply supply 21st century energy markets. The rapid growth of gas supply, the gradual penetration of nuclear energy, and the inexorable drive toward efficiency relieve the stress.
Land and Food: For centuries, farmers expanded cropland faster than population grew, and thus cropland per person rose. Fifty years ago, farmers stopped plowing up more nature per capita (Figure 1). Meanwhile, growth in calories in the world’s food supply has continued to outpace population, especially in poor countries. Per hectare, farmers lifted world grain yields 2.1 percent annually between 1960-1996.
Frontiers for even more agricultural improvement remain open. On the same area, the average world farmer grows only about 20% of the corn or beans of the top Iowa farmer, and the average Iowa farmer lags more than 30 years behind the yields of his most productive neighbor. Top producers now grow more than 20 tons of corn per hectare compared with a world average for all crops of about 2.
Globally, the future lies with precision agriculture. Technology and information help the grower use precise amounts of inputs-fertilizer, pesticides, seed, water-exactly where they are needed. Precision agriculture includes grid soil sampling, field mapping, variable rate application, and yield monitoring-tied to global positioning.
If during the next 60 to 70 years, the world farmer reaches the average yield of today’s US corn grower, ten billion people will need only half of today’s cropland while they eat today’s US calories. The land spared exceeds the Amazonia. This sparing will happen if farmers maintain the yearly 2.1% worldwide growth of grains achieved 1960-1996. In other words, if innovation and diffusion continue as usual, feeding people will not stress resources. Even if the rate of improvement falls to half, an area the size of India, globally, will revert from agriculture to woodland or other uses. A vegetarian diet of 3,000 calories/day halves the difficulty or doubles the land spared.
Success at growing food on land spares animals in the seas, where fishers stress many wild stocks. So can farming parts of the ocean. Just as fertilizer grows more corn, adding nutrients to the barren tropical ocean might, for instance, multiply selected fish a thousand times.
Despite more calories on average, a billion people remain hungry. Their number could grow or shrink, depending above all on distribution of income. Meanwhile, the continuing evolution of efficient use can assure ample resources on average.
Forests: Forests are cut to clear land for farms and settlements and also for fuel, lumber, and pulp. In the rich countries, nevertheless, forests have re-grown in recent decades. Since 1950 the volume of wood on American timberland has grown 30%, while European forests have similarly increased in volume and extent. In the US, the intensity of use of wood defined as the wood product consumed per dollar of GDP has declined about 2.5% annually since 1900. In 1993 an average American consumed half the timber for all uses as a counterpart in 1900.
In the US, likely continuing fall in intensity of use of forest products should more than counter the effects of growing population and affluence, leading to an average annual decline of perhaps 0.5% in the amount of timber harvested for products. A conservative 1.0% annual improvement in forest growth would compound the benefits of steady or falling demand and could shrink the area affected by logging 1.5% annually. Compounded, the 1.5% would shrink the extent of logging by half in 50 years. If one half of this amount occurs by leaving areas now cut uncut, the area spared is 50 million hectares, the size of Spain. A similar pattern is likely in Europe as well as Argentina and numerous other countries.
In poor regions of tropical countries such as Brazil, Indonesia, and Zaire, the dominant force stressing forests remains the struggle to subsist. During the last couple of decades, the removal of tropical forests has been estimated at 1 percent per year. Until overcome by better livelihoods, cheap land, cheaper fuels, superior alternative wood products in the marketplace, taboos, or other factors, the one-time conversion of forests to money, cropland or fuel will continue. Nevertheless, global expansion of forests and rising incomes encourage.
Water: Globally abundant, fresh water is unevenly distributed. Although ten times present use falls on Earth, only about 1/5 of this is easily reached or used. Almost 2/3 of water goes for farming, 1/4 for industry, and less than 1/10th for cities. Hydroelectric generation currently uses (but does not consume) 2.6 times the average runoff in the conterminous US by running water through several turbines in a river. In the US both total and industrial withdrawals appear to have peaked in the 1970s (Figure 2).
Opportunities to increase efficiency abound. Crops take up only about one-third of what is applied. Shrinking the area of farmland would likely save much water, even if the fraction irrigated rises. Industries and cities can recycle wastewater, if energy is cheap and pollutant removal does not cost dear. History shows that when water becomes scarce, use becomes efficient.
The time to design and build water infrastructures stretches for decades. International and continental management remain novel. Climatic variability and change make the diversity of wide nets of water infrastructures and markets attractive, but they may be hard to arrange. Because a major cost is pumping, the key of cheap energy can relieve stresses.
Materials: During the past two decades metals, industrial minerals, and construction minerals as well as energy, forest, and agricultural products have not grown more costly despite the rise of the multipliers of population and GDP. An average American, for example, consumes about 50 kg per day of these materials. Fuel forms about 40% of the material inputs and most emissions (Figure 3). Although the mix differs, wealthy countries such as Japan, the Netherlands, and the US consume about equal kilos.
Because suppliers, such as miners, have vastly improved their efficiency, iron, copper, and other ore previously considered low grade still yield products and profits. Meanwhile, efficiency for the consumer in product design and changes in consumption patterns have favored dematerialization, less material per dollar of GDP to do a task. Lowering the material intensity of the economy could preserve landscape and natural resources, lessen garbage, and reduce hazardous exposures. Economical energy, efficiency, and clever upgrading of plentiful materials divide the demand that population and GDP multiply and make sustained or widespread shortages of materials unlikely.
3. Will the fallout harm?
Habitat: People transform land by building, logging, and farming. Globally, if an additional 4 billion people pave and otherwise develop land at the present rate of Californians (about 600 m2 each), cities will consume about 240 million hectares, midway in size between Mexico and Argentina. This area appears likely to be offset by land spared from logging in the US and other countries that now reduce their cutting of forests. The likely added land spared from crops globally over the time it takes to reach 10 billion people suggests a net worldwide return to Nature of lands equal to India (3 Nigerias or 6 Spains). The distribution of these lands will greatly affect the chances recreated for habitat for flora and fauna.
Climate: The 30% increase in greenhouse gas concentrations, particularly carbon dioxide (CO2), since the start of the industrial revolution may already have changed climate some, and more seems likely. How much depends on the rate of decarbonization of the energy system. Decarbonization means we obtain more energy and income per carbon atom. The evolving shares of the leading primary energy sources (wood & hay, coal, oil, gas) mix hydrogen and carbon in increasing ratio, and have in fact caused a gradual, global decarbonization of the energy system (Figure 4). Sources with no carbon at all, such as hydro, nuclear, and solar decarbonize further.
Now, additions to atmospheric carbon dioxide come mostly from transport (oil) and power generation (coal), but they will come largely from gas when it dominates energy supply. Fuel cells, essentially continuous batteries fed by hydrogen extracted from natural gas or manufactured by nuclear plants, and other electromotive propulsion, promise to multiply automotive efficiencies soon. Fuel cells can produce zero pollutants and correspondingly reduce carbon emissions from transport.
To stabilize atmospheric CO2 at twice pre-industrial levels (550 ppm) probably requires limiting emissions from 1990 onward to about 900 billion tons of carbon. My decarbonization scenario emits about 500 billion tons and could stabilize atmospheric concentrations about 450 ppm, one-quarter above present levels. Still lower levels could be achieved by sequestering carbon, for example, in aquifers whose primary rocks are silicates that form stable carbonates plus silica from CO2.
The consequences of climate change depend on the adaptivity of plants, animals, and social systems. Analysts have produced fragile and robust scenarios and everything in between. In general, the adaptable and richer are safer.
Acidity: The precipitation on forests and lakes of acid-producing residues, mainly in the form of industrially released sulfur dioxide (SO2) and nitrogen oxides (NOx), emerged in the 1970s as a major issue in North America and Europe, and to a lesser extent in East Asia. In the US, SO2 emissions come primarily from electric power plants and have dropped more than a third since 1970. NOx emissions, from automobiles as well as power plants, peaked about 1980 and have fluctuated since. Gas turbine power plants now replacing plants built before the 1972 Clean Air Act can drop NOx by 95%. Curiously, NO3 concentrations have not changed in several decades in the rain at the carefully monitored Hubbard Brook (New Hampshire, US). Decreased emissions of SO2 are evident in routine measurements of rainwater sulfates, but rainwater remains more acidic in the affected regions in the US than before widespread industrialization. Red spruce trees, among the vegetation apparently most susceptible to acid rain, show diminished growth, although the case for an acid cause remains weak.
Acid from afar is also deposited in Japan from Chinese and Korean emissions, but long-term records of the extent do not exist. Although emission, transport, and deposition of acid-causing emissions must occur elsewhere, especially where fossil fuels are heavily used, sparse data and knowledge of regional weather cloud assessment. The numerous other natural and anthropogenic changes pressing upon ecosystems make hard the attribution of effects to acid rain. In regions such as southern Poland, the Czech Republic, and eastern Germany, stresses may have been severe, but coal use and raw industrial activity have dropped drastically. For the next few decades, coal-using regions such as China will be prone, but over the long run shifts to clean-burning natural gas and cars powered by fuel cells will largely eliminate concern about acid deposition.
Increased ultraviolet: Depletion of stratospheric ozone, traceable to chemicals used primarily for refrigeration, but also fire retardation, aerosol propulsion, and cleaning could increase ultraviolet light. The increase in turn could harm people and affect the productivity of ocean plankton and land plants. Production and use of the main culprits, the chlorofluorocarbons (CFCs), concentrated in the industrialized countries. Production grew steadily in the early 1970s and leveled later in the decade, when the US and a few other industrial countries banned particular uses of CFCs.
International protocols on substances that deplete the ozone layer, signed in 1987 and amended in 1990 and 1992, phased out fifteen CFCs by 1996. By 1993 industries completed phase out of halons, another ozone-depleting substance. Developing countries have a 10-year delay in implementation. The detection in the mid-1980s of a “hole” in the ozone layer in the spring over Antarctica catalyzed signature of agreements. Evidence that less ozone caused more ultraviolet radiation at the surface of Earth remains elusive. The decisions curtailing production of the suspect chemicals appear to be causing anthropogenic ozone destruction to peak around now, with recovery in prospect over a few decades.
Urban and indoor air: London invented smog, but Los Angeles (LA) brought it fame and remains the benchmark of urban air in industrialized nations. In 1997, thanks to cleaner cars and fuels, and tougher regulations for power plants and refineries, the air in LA was the cleanest in 50 years. In 1997 LA issued only one smog alert, and air in its basin exceeded federal limits on ozone in the lower atmosphere on 68 days, down from 90 in 1996. The main reason is new cars that emit 95% less than 1970 vehicles. The near elimination of leaded gasoline in the US explains division of airborne lead by 20. Fine particles emitted by gasoline and diesel engines are, however, correlated with increased mortality.
In developing countries, large cities suffer acute and unabating air pollution. During the 1980s, the Chinese cities of Beijing and Shanghai exceeded World Health Organization (WHO) standards for particulate levels on 272 and 133 days per year. The average in New Delhi over the same period was 295 days. Since the mid-1970s, SO2 levels exceeded the standard an average of 100 days per year in Teheran. In 1991 in Mexico City standards were violated over 300 days. Wood and dung burning in Asian ovens raise indoor particulate concentrations more than one hundred times the WHO standards, illustrating indoor air pollution. Over the long run, natural gas and nuclear energy, that is, decarbonization, will largely eliminate urban air problems.
Waters: Groundwaters, many rivers in both developing and industrialized regions, and inland water bodies, such as the Aral Sea in Central Asia, continue to experience contamination from both active and inactive industrial sites, imprudent irrigation, and diffuse pollution from urban, fertilizer and pesticide runoff. Some estuaries and seas now manifest incipient eutrophication or hypoxia: dissolved oxygen reduced by more nutrients, such as those found in fertilizers and sewage. The growth of some plants and the loss of oxygen choke off other aquatic life. Shrinking cropland is likely to lower use of nitrogen and other fertilizers. In fact, fertilizer use has been flat in the US since 1980 and has dropped 10% globally since the late 1980s.
Some waters have been reclaimed. For example, although much remains to be done, the average dissolved oxygen in the rivers of the OECD nations improved over the past twenty-five years. Stresses, however, will worsen along coastlines, where urbanization proceeds faster than improvement of wastewater infrastructure.
Since 1970 oil spills have fluctuated with sporadic spikes, as due to the Exxon Valdez in Prince William Sound in 1991. Tanker accidents were fewer in the 1980s and 1990s than the 1970s. Improved technical standards for transport over the last few decades probably caused the improvement. Although commanding less public attention than spills, “normal” discharges of oil into the sea from washing tanks and discharging ballast water form the largest source of marine oil pollution and remain hard to assess. Shifts to natural gas and hydrogen would obviate oil spills as well as oil runoff from roads on land.
Industrial and municipal wastes: Population and GDP growth multiply the volume of products and objects. Thus, total wastes have tended upward despite their decline per GDP. The sophisticated materials and their applications valued in the “new materials society” make alloys and composites that can be hard to separate and recycle. For many materials, recycling seems unable to supply more than about 1/3 of demand. Popular materials can be lighter but bulkier and more toxic. So far, higher disposal prices have called forth sites for landfills, but who shall live near the dump always stresses. The vision of an industrial ecology in which waste is radically reduced and emissions approach zero is beginning to be realized in cities such as Kalundborg, Denmark, where plants are co-located so that the “wastes” from one become useful inputs to another.
Radioactive and other hazardous materials: The storage and disposal of radioactive wastes have implications from global to local. They come from nuclear reactors making electricity and arsenals making bombs. The public worries about low as well as high level radioactive wastes. Although high level volumes are smaller, they present harder problems.
The rise of nuclear electrification has raised the volume of spent fuel and other wastes, but it is still small. The waste volumes, in fact, are smaller than anticipated. In the US, for example, the current dumps for low-level radioactive waste will have excess capacity well into the next century, partly because fewer plants were built than projected, but mostly because recycling and compacting have shrunken the waste volume. In the US the annual volume of low-level waste shipped to disposal sites dropped from 3.8 million cubic feet in 1980 to 422,000 in 1996. The decline means that the three dump sites in Richland (Washington), Barnwell (South Carolina), and Clive (Utah) have 29 to 260 years of capacity at current disposal rates, which will probably drop even lower.
Wastes from weapons contribute much to total nuclear waste. In the US, the environmental problems of weapons operations are widely known, and prompted large appropriations to remedy them. In the former Soviet Union, the problems may be greater. Formal treaties have stopped earlier disposal, such as dumping at sea, and the scuttling of nuclear submarines has ceased. Regimes for transport and temporary storage of civil and defense nuclear wastes now function, although sites and designs for permanent disposal have yet to be reliably accepted.
The prevalence of several other hazardous materials has diminished in recent decades. Strontium-90 has diminished worldwide since the 1960s when atmospheric testing of nuclear weapons was banned. In the United States, levels of PCBs (used as coolants in power transformers) and lead (used in various forms in gasoline, cables, pipes, paint, and industrial chemical processes) and other heavy metals have declined dramatically as harmful consequences have been identified and remedies implemented. Despite bans, the persistence of the durable PCBs has kept them a leading topic of toxicological research and environmental controversy. Previous disposal of these and other hazardous wastes has contaminated many locations around the world, and the catalogue of these sites has grown. In the United States, while documentation and remediation of previously contaminated sites goes forward, few new sites are polluted.
I have searched history and found many of the specters of shortage and fallout are phantoms. Unfortunately, I must tell you that some other stresses are real.
4. Where are stresses likely?
In cities: In August 1997 the Chinese Ministry of Labor estimated that about 175 million surplus laborers linger in the countryside, representing 35% unemployment. Continuing rapid urbanization in China, parts of Africa, India, and other areas retaining large rural populations will press on water supply, waste treatment, energy, housing, and other infrastructures. Crowded, unsanitary, and unsafe conditions will bring deadly catastrophes, including epidemics, fires, and building collapses, already familiar in the overstuffed and underserved cities of today.
At cultural borders: Wealthy imploding regions such as Europe will draw into their empty rooms migrants from the poorer exploding regions such as the Mahgreb. Few countries have maintained peace when national and cultural boundaries do not coincide. Africa today is probably worse off in this regard than Europe in 1913.
Where systems leak: Best practice in industrial ecology offers zero emissions. In the world’s $200 trillion economy, however, worst practice will surely still lag behind best practice, some sectors will evolve along bad tracks, and small errors can be absolutely huge. Normal as well as surprising failures in plant operations and product design, corruption, stupidity, and carelessness will continue. Plants will leak, pipelines and tanks will explode, cement will crack, and water, air, and soil will be contaminated.
In scaling up: Within fifty years more than 3 billion people need to hook to commercial energy for the first time. China and India need more than their current 1 phone line per hundred tongues. Without capital, domestic tranquility, zero-maintenance technologies, and new economies of scale, stresses will run high, mistakes will be made and need correction, and transitions to new ways will test patience. The question of who is the next to gain service always arises.
In critical infrastructures: We move ever further from the society in which a family could farm, fuel, and clothe itself. No family can make microprocessors or storage disks. A winter ice storm shows how developed societies increasingly depend on a few, linked infrastructures. In particular, because electricity permeates the web of social services, a breakdown, even for a few hours, can bring tragedy. Neither can Internet commerce flourish, if the system is often down. To survive supply cartels, market fluctuations, war, and terrorism the wide natural gas distribution network that I envision must be an engineering masterpiece. In general, designing, building, and operating ultra-reliable infrastructures for electricity, gas, information, water, and other critical goods loom large.
For energy, the diffusion among individual consumers of multipurpose minigenerators might defend against great breakdowns. In effect, we would delegate base load to the global gas and nuclear system while leaving peaking and standby to a new household appliance able to use both gas and electricity to produce heat, cold, and electricity on demand.
In the innovation system: Although advancing productivity 2%/yr in key sectors may not sound hard, maintaining the pace for a century or more has exhausted earlier societies and enterprises, as the costliness of complexity tends to grow. Even if the world can maintain the supply of innovation, many societies historically have chosen to block diffusion. The loudest sound in the world is that of a habit breaking. Societies may choose dirt and disease, because accepting the means to lessen environmental and resource stresses will break the old culture, the tested formula for survival.
5. Conclusions
Will there be enough? There should be, though products in demand such as natural gas will surely give market power to prepared suppliers. And those with low incomes will always tend to be weak in the marketplace, though if the poorest multiply their income eightfold over today, most should be safe from hunger.
Will the fallout harm? Cities will spread and the climate may warm a little, but on balance humans may tread more lightly in nature.At the outset, we recognized the general multipliers, population and GDP. To answer the two basic questions, we now see we must address a third, “Must resource and environmental stresses intensify in unmodified lockstep with these general multipliers?” History suggests technology and science, which lift productivity and efficiency of resource use, are powerful enough divisors to lessen net stresses.
As well as the raising the divisors, people could choose to lessen the multipliers. However, habit favors multiplication, and so for the 21st century we should at least prepare for it.
A world of 10 billion people and $200 trillion will above all handle huge amounts of information, whether in its fields, factories, offices, or homes. Its greatest vulnerabilities may come from failures or rejections of the systems of control for the communication of information. Science is a uniquely effective system of communication for the control of complexity, and the ability to control complexity is effectively the central parameter of the dynamics of evolution. Having come far down the road with science and technology, perhaps we should feel greatest stress from knowing we must keep running.
Acknowledgements: I am grateful for many years of cooperative work with Arnulf Gruebler, Cesare Marchetti, Perrin Meyer, Nebojsa Nakicenovic, and Paul Waggoner and to Kurt Yeager and Chauncey Starr for asking the questions eliciting this paper.
Further reading:
The Environment for Future Business
Jesse H. Ausubel
Pollution Prevention Review 8(1):39-52, Winter 1998.
Technological Trajectories and the Human Environment
Jesse H. Ausubel and H. Dale Langford, eds.
National Academy, Washington DC, 1997.
Also appeared as special issue, “The Liberation of the Environment,” Daedalus 125(3), Summer 1996.
Elektron: Electrical Systems in Retrospect and Prospect
Jesse H. Ausubel and Cesare Marchetti, Daedalus 125(3):139-169, Summer 1996.
Toward Green Mobility: The Evolution of Transport
Jesse H. Ausubel, Cesare Marchetti, and Perrin S. Meyer
European Review 6(2):143-162, 1998.
The Environment Since 1970
Jesse H. Ausubel, David G. Victor, Iddo K. Wernick
Consequences: The Nature and Implications of Environmental Change 1(3):2-15, 1995.
Human Population Dynamics Revisited with the Logistic Model: How Much Can Be Modeled and Predicted?
Cesare Marchetti, Perrin S. Meyer, and Jesse H. Ausubel
Technological Forecasting and Social Change 52:1-30, 1996.
Lightening the Tread of Population on the Land: American Examples
Paul E. Waggoner, Jesse H. Ausubel, Iddo K. Wernick
Population and Development Review 22(3):531-545, 1996.
Searching for Leverage to Conserve Forests: The Industrial Ecology of Wood Products in the U.S.
Iddo K. Wernick, Paul E. Waggoner, and Jesse H. Ausubel
Journal of Industrial Ecology 1(3):125-145, 1997.
Jesse H. Ausubel is Director of the Program for the Human Environment at the Rockefeller University in New York City. Mr. Ausubel’s interests include environmental science and technology, industrial evolution, and the nature of the scientific enterprise. The main themes of the Rockefeller research program are industrial ecology (the study of the network of all industrial processes as they may interact with each other and live off each other, a field Mr. Ausubel helped originate) and the long-term interactions of technology and the environment.
Underlying the work are ongoing studies of the mathematics of growth and diffusion. From 1983-1988 Mr. Ausubel served as Director of Programs for the US National Academy of Engineering.
Figures
Figure 1. Land to Feed a Person for a Year, Global Average.
The blocks in Figure 2 show that global cropland per person expanded before Malthus until the mid-1950’s. Recently, however, cropland per person shrank. The star shows the land per person that would be required if global yields equaled the yield achieved by the winner of the Iowa Master Corn Growers Contest in 1996, 19.5 tons per ha.
Source of Figure: P.E. Waggoner, “Food, Feed, and Land,” in Ethics of Consumption: the Good Life, Justice, and Global Stewardship, D.A. Crocker and T. Linden, eds., Rowmand & Littlefield, Maryland, 1998. Sources of Data: J.F. Richards, “Land Transformation,” in The Earth as Transformed by Human Action, B.L. Turner et al., eds., Cambridge University, Cambridge, England, 1990; Food and Agriculture Organization of the United Nations, FAO Yearbook, vol. 45, FAO, Rome, tables 1 and 3; Rod Swoboda, “New Record Set in State Corn Contest,” Wallace’s Farmer, March 1997.
Figure 2. U.S. Total Water Use, Per Capita Per Day.
Source of figure: J. Ausubel, “Can Technology Spare the Earth,” American Scientist 84:166-178 (March-April 1996).
Sources of data: U.S. Bureau of the Census, Historical Statistics of the United States, Colonial Times to 1970, U.S. Government Printing Office, Washington D.C., 1975; U.S. Bureau of the Census, Statistical Abstract of the United States: 1992, 112th edition, U.S. Government Printing Office, Washington D.C., 1993.
Figure 3. Daily U.S. Per Capita Material Flows by Mass, Circa 1990.
All values are in kg’s. Materials here are classed as energy fuels (i.e., coal, oil, gas), construction minerals, industrial minerals, metals, forestry products, and agricultural products.
Source of figure: I.K. Wernick, “Consuming Materials: The American Way,” Technological Forecasting and Social Change 53:111-122, 1996.
Source of data: I.K. Wernick and J.H. Ausubel, “National Materials Flows and the Environment,” Annual Review of Energy and Environment 20:462-492, 1995.
Figure 4. Decarbonization or World Ascent of Hydrogen.
World primary energy sources have declined in carbon intensity since 1860. The evolution is seen in the ratio of hydrogen (H) to carbon (C) in the fuel mix, graphed on a logarithmic scale and analyzed as a logistic growth process. The data and logistic curve are plotted using a transform that renders the S-shaped logistic linear.
Source of figure: J. Ausubel, “Can Technology Spare the Earth,” American Scientist 84:166-178 (March-April 1996).