Area of Research: Technology & Human Environment
Introducing the International Quiet Ocean Experiment
The Virtual Ecology of Industry
We now forecast storms from virtual weather, recessions in virtual economies, and victories on virtual battlefields. Software companies have scored popular successes with simulations of cities, Earth history, and ant colonies. Jet pilots and nuclear power plant operators train on video displays before their hands wield the actual controls. Numerical models form the basis of all these simulations.
What are the prospects for a virtual ecology of industry that can help us toward the goal of a micro-emissions economy? The editors of The Journal of Industrial Ecology asked me to speculate about this question in what we hope will become a regular column on modeling and simulation. My judgment is that many precedents offer encouragement.
Continuous process industries, such as petrochemicals, have long sought to channel every input into profitable output. Chemical engineers already design and test refineries in detail on computers before companies buy the first length of pipe. Energy engineers have extended the concept of a petrochemical complex to a virtual “integrated energy system” which transforms crude oil and other energy materials, air, water, and other inputs into liquid fuels, electricity, heat, fertilizer, and other outputs with potentially zero emissions.i
In the many industries which produce in batches rather than in continuous flows, design and analysis of integrated manufacturing systems have also advanced markedly.ii Weighing the wastes industries now create, opportunities must abound to handle materials better, reduce wastes, and design “custom” wastes that can re-enter the economy or be safely filed away.iii Modest extensions of the simulatory arts in sectors from automotive to pulp and paper may identify quickly and effectively the leverage for lifting plants toward these goals.
Leverage is a key word. One major reason to formalize the flows and relations within a plant into equations and computer code founded on sound data is to assess numerically the power to achieve outcomes with practical effort. In a virtual plant we want to discover the levers connected to the task and resting on a fulcrum near the task.
Above the level of the plant, fewer precedents for simulation exist. Nevertheless, Peter Ince’s chart of the materials flowing from the forest into lumber, paper, and fuel invites simulation of the industrial ecology of wood products.iv Surely worthwhile occasions exist for researchers, consultants, and managers to build dynamic simulations of materials (and energy) flows at the level of an industrial sector. The vast yet overlooked services industries appear to be virtual virgins.
And then the challenge looms to capture the actual and potential flows across diverse sectors or enterprises at a useful level of detail. Surely we could simulate the touted collection of symbiotic industries in Kalundborg, Denmark, as well as imaginary Eco-Parks.
Some of the experiments industrial ecologists might wish to undertake will be excessively costly or risky unless we can build expert and public confidence through simulations. For strawberries, albeit modified with modern genetic means, field tests are hard enough. Before any material existence, the factory, firm, or landfill of the future may well be required to operate vividly and convincingly in our virtual goggles.
We know life holds incidents and interactions no simulation will ever capture. Had we modeled the ecology of medieval industry, would we have seen that low-cost linens effected by the spinning wheel would lead to abundant rags that could become cheap paper that would permit a printing industry? Perhaps not. But today we have a lot more waste to remodel. Let’s begin. SimFactory and CyberEcoPark may help.
26 August 1996
End notes
- See pp. 129-135 in Thomas H. Lee, Advanced Fossil Fuel Systems and Beyond, pp. 114-136 in Jesse H. Ausubel and Hedy E. Sladovich, eds., Technology and Environment, National Academy Press, Washington DC, 1989.
- W. Dale Compton and Joseph A. Heim, eds., Manufacturing Systems: Foundations of World-Class Practice, National Academy Press, Washington DC, 1992.
- Robert A. Frosch, Toward the End of Waste: Reflections on a New Ecology of Industry, Daedalus 125(3):199-212, 1996.
- Peter J. Ince, Recycling of Wood and Paper Products in the United States, U.S. Dept. of Agriculture Forest Service, paper delivered at United Nations Economic Commission for Europe Timber Committee Team of Specialists on New Products, Recycling, Markets, and Applications for Forest Products, June 1994. Copies available from USDA Forest Service Forest Products Laboratory, Madison Wisconsin, 53705, USA.
2020 vision
The Liberation of the Environment
Verification of International Environmental Agreements
This paper was first published in 1992 in the Annual Review of Energy and Environment, https://www.annualreviews.org. The paper posted here was scanned and re-typeset in HTML. Every effort was made to minimize errors. Please email us at phe@mail.rockefeller.edu if you would like a hard copy of the original paper.
Abbreviations used: BWU, blue whale unit; CEMS, continuous emissions monitoring systems; CFCs, chlorofluorocarbons; CFE, Treaty on Conventional Armed Forces in Europe; CITES, Convention on International Trade in Endangered Species; CTB, comprehensive test ban; EC, European Community; ECE, United Nations Economic Commission for Europe; EEZ, Exclusive Economic Zone; EMEP, Cooperative Programme for Monitoring and Evaluation of the Long-Range Transmission of Air Pollutants in Europe; GAO, General Accounting Office (U.S. Congress); IAEA, International Atomic Energy Agency; ICES, International Council for the, Exploration of the Seas; IMCO, Inter-governmental Maritime Consultative Organization (IMCO after 1981); IMO, International Maritime Organization (IMCO before 1981); INF, Intermediate Nuclear Forces Treaty; IOS, International Observer System; IUCN, International Union for the Conservation of Nature (recently renamed to World Conservation Union); IWC, International Whaling Commission; LRTAP, Convention on Long Range Transboundary Air Pollution; LTB (T), Limited Test Ban (Treaty); MARPOL, Convention for the Prevention of Pollution from Ships; MSY, maximum sustainable yield; NAAQS, National Ambient Air Quality Standards (U.S.); NGOs, nongovernmental organizations; NEAFC, Northeast Atlantic Fisheries Commission; NPT, Nuclear Non-proliferation Treaty; NTM, national technical means; OECD, Organization for Economic Cooperation and Development; OSHA, Occupational Safety and Health Administration (U.S.); OSL, on-site inspection; OSIA, On-site Inspection Agency (U.S.); SALT, Strategic Arms Limitation Talks; TAC, total allowable catch; UNEP, United Nations Environment Programme.
INTRODUCTION
Problems and opportunities frequently cross national borders. Informal and formal international arrangements-loosely termed “regimes,” defined here as systems of rule or government that have widespread influence–are for the collective management of such transboundary issues. Regimes are pervasive; their number and extent have grown markedly in the 20th century, especially since the Second World War.
Students of the international system study the conditions under which regimes are formed and the factors that contribute to their success. These include distribution of power among states, the nature of the issue, its linkages to other issues, the roles and functions of international organizations, the processes of bargaining and rule-maldng, and the influence of domestic politics (1-3). Scholars also theorize how regimes are maintained and changed (4-6).
In the past two decades students of international cooperation have increasingly applied their tools to issues of the environment and natural resources (7-9). A few studies have critically assessed international cooperation for transboundary environmental protection and drawn tentative conclusions on factors that lead to effective international regimes (8, 10-12). Studies of local management of common natural resources also yield relevant lessons for international environmental cooperation (13).
For several reasons, assessing the effectiveness of international environmental agreements requires study of how compliance is verified. International agreements that are verifiable are more likely to succeed in both negotiation and implementation. The process of verification builds confidence in existing formal and informal agreements, thus improving the prospects for future cooperation and compliance. Verification activities produce information that can provide the technical basis for future agreements and shared understanding. Such information also can provide the basis for sanctions, which depend upon timely, legitimate, and accurate information. Information from verification activities helps to assess how effectively a regime has met its goals and whether changes in the regime are needed to improve effectiveness. By increasing transparency–the extent to which behavior and violations are visible to others–verification ran help build norms that influence behavior and contribute to regime effectiveness.
These propositions have been examined extensively for arms control (e.g. Refs. 14-16), but less for other issues, including protection and management of the natural environment. This paper is a review of the functions, concepts, and theories related to verification of international environmental agreements. Other useful reviews that have come to our attention are Fischer’s study of the verification provisions in 13 international environmental treaties particularly as they relate to a global warming convention (17, 18) and the U.S. General Accounting Offices (GAO) evaluation of reporting and monitoring under 8 major international environmental treaties (19).
MOTIVATION AND OUTLINE
This review is designed to address the question of whether verification is a topic deserving more social concern and research. Our approach is organized around four smaller questions. First, based on existing international environmental regimes, how is verification conducted and what are the relevant concepts? Second, how is verification conducted under domestic environmental law? Domestic experience is important because there is extensive study of how domestic compliance with pollution laws is verified and because international agreements are typically implemented by domestic institutions. Third, can major social science perspectives explain the demand for and character of verification that is observed in existing regimes? And, do those perspectives explain the differences between arms control verification and environmental verification? Fourth, what do the answers to these questions suggest for prospective regimes such as to control global climate change, preserve biodiversity, and limit deforestation?
The paper addresses these questions seriatim. To illustrate the arguments, we first describe nine international environmental regimes. For each we provide a summary of the problem, a synopsis of the main legal agreements and approach to solving the problem, and an assessment (where possible) of compliance with the agreement(s). Second, we describe the functions and concepts related to verification of international environmental agreements. Third, we review domestic experience with compliance and enforcement of environmental laws, primarily in the United States, and offer some comparisons of that setting with the international. Fourth, we employ several theoretical perspectives to explore the patterns of verification observed in the nine cases and to explain the differences between environmental and arms control verification. In conclusion we apply some of these findings to prospective agreements. For the reader unaware of the related arms control literature, a brief review is provided in an appendix.
DEFINITIONS
We distinguish five terms. Monitoring is the process of acquiring the information used to facilitate decision-making and implementation of the agreement. Compliance is the adherence to some formal or informal commitment. Verification is the process of determining whether or not a party is in compliance. Enforcement is the suite of sanctions and incentives to entice compliance. (“Verification regime” has been used to mean all of the above, especially in the arms control literature; we avoid it because of its imprecision.) Implementation is the process of putting in place laws, activities, and institutions to meet obligations of an agreement. This paper focuses on monitoring, compliance, and verification, though enforcement and implementation are mentioned.
There are two caveats. The discussion relies heavily on US scholarship, especially in the domestic context. The literature reviewed is mostly indirectly on the verification of international environmental agreements; little has been written directly on the topic.
INTERNATIONAL ENVIRONMENTAL PROTECTION: NINE CASES
More than 100 fon-nal international agreements to protect the environment exist (20); of these, most are in force. To illustrate how verification is practiced in these cases, we survey nine regimes for international environmental protection, some of them encompassing more than one formal agreement (Table 1). These cut across four types of environmental protection: atmospheric, oceanic, management of natural resources, and preservation of natural resources. Both global and regional agreements are represented.
Atmospheric Cases
LIMITED NUCLEAR TEST BAN Many reinforcing events in the mid-1950s led to concern about radioactive fallout from atmospheric testing of nuclear weapons. The public feared the health effects of fallout, radioactive elements were, for example, measurable in milk. The test ban also became a cause of the nuclear disarmament movement (and still is). Though primarily an arms control issue, the case is included here because of the role that health effects played in forcing the agreement.
In 1958 a US-USSR-UK Conference of Experts proposed an international monitoring system for verification of a comprehensive test ban (space, underwater, atmospheric, and underground). The issue preventing agreement was the delectability of underground explosions since detection in the atmosphere, underwater, and in outer space was relatively easy. Through the early 1960s the Conference of Experts met and negotiated the terms of a verification system, presenting proposals with different degrees of cost and intrusiveness and responding to innovative challenges that the verification systems they designed could be evaded. In addition to direct negotiations, both the United States and the Soviet Union attempted to sway world opinion through a series of short-lived unilateral test bans. The Cuban Missile Crisis (1962) focused attention on arms control, as did continued fears of health effects from large atmospheric nuclear tests (21).
Table 1. Summary of the nine cases (scanned JPEG)
In the early 1960s two proposals existed: one for a comprehensive test ban (CTB) and the other for a limited test ban (LTB) to ban tests everywhere except underground. A Limited Test Ban Treaty (LTBT) resulted when the United States and the Soviet Union could not agree on an acceptable number of annual on-site inspections for verifying compliance with a CTB. Compliance with the LTB has been perfect; both sides easily moved their weapons development programs underground. There have been infractions due to venting-accidental escape of radioactive gases from underground tests–but both sides see these as minor issues. By all measurements, ambient concentrations of radioactive elements from weapons testing have declined markedly since the LTB went into effect.
ACID RAIN IN EUROPE From the late 1960s the Scandinavian countries have claimed that the acidity of their rain was increasing, that it was caused by European emissions upwind, and that the acidity was damaging Scandinavian lakes (49). Beginning in 1972 the Organization for Economic Cooperation and Development (OECD) conducted a study of long-range transport of air pollutants to assess such claims. That program was given independent status in 1978 as the Cooperative Programme for Monitoring and Evaluation of the Long-Range Transmission of Air Pollutants in Europe (EMEP). EMEP now consists of a network to monitor the chemical composition of rain (including acidity) and three international centers to analyze that and other data (24).
In parallel, at the level of high politics and quite disconnected from the OECD/EMEP activities, at the 1975 Helsinki Conference on Security and Cooperation in Europe the Soviet Union pushed for some forum to continue the east-west dialogue begun during detente of the early 1970s. The topic chosen was the environment, and the U.N. Economic Commission for Europe (ECE) was chosen as the forum for negotiation because its membership includes all relevant parties (including the United States and Canada) and had the needed organizational infrastructure for negotiating a treaty. The negotiations’ first formal product was the Convention on the Long-Range Transmission of Air Pollution (LRTAP), signed in 1979 (26). Almost all states in Europe have joined LRTAP. The main achievement has been to strengthen understanding of the links between acid-causing emissions, long-range transport and damage to health, property, and ecosystems. Few parties accepted these arguments in the 1960s and 1970s when they were first made by the Scandinavians; now, all do (24).
Three protocols to LRTAP form the substance of the agreement. The first (1984) funds the EMEP monitoring network, thus formally bringing it (and its scientific products) into the LRTAP process. The second (1985) calls for a 30% reduction in emissions of sulfur dioxide, the leading cause of acidification; not all countries have joined the sulfur protocol. A third protocol, on emissions of nitrogen oxides (NO x), was signed in 1988, also without full participation. A fourth protocol on volatile organic compounds (which are precursors to the formation of tropospheric ozone, a health hazard) was signed in 1991 but is not yet in force. In parallel with LRTAP activities, the European Community (EC) has issued directives to control some sources of acid-causing pollutants within EC countries (25; 27, parts III and IV).
Compliance with LRTAP and its protocols has been quite high, at least among industrialized countries; many countries that signed the sulfur protocol have substantially overcomplied, suggesting states would have made these reductions on their own. Indeed, the downward trend in sulfur emissions began in the early 1980s, before the sulfur protocol was negotiated. The pattern of signing the protocol only if the state was going to make the cuts anyway is evident in the NO x protocol as well (25). On the surface, this suggests that LRTAP convention and its protocols have not been effective in gaining emissions control beyond what would have happened anyway; however, the treaties may have helped to deal with free rider problems and probably provided a helpful public forum within which environmental nongovernmental organizations (NGOS) pressured governments to impose stricter emissions controls (24).
STRATOSPHERIC OZONE DEPLETION Concern that chlorofluorocarbons (CFCs) might deplete the ozone layer, causing skin cancer and other health and ecological effects, dates to 1974. Understanding of the problem changed significantly with detection of the Antarctic ozone “hole” in 1985 and subsequent studies to explain it. Despite these major changes, the hypothesized link between CFCs (and other halocarbons) and ozone depletion has been substantially confirmed (50).
In the 1970s the United States, Canada, Norway, and Sweden acted unilaterally to control some uses of CFCs. International efforts included monitoring, research, and assessment programs beginning in the middle 1970S. The Vienna Convention (1985) established a framework for subsequent protocols; the Montreal Protocol (1987), negotiated and signed shortly after the ozone hole was detected, committed signatories to cut the planned use of offending chemicals by half. Amendments and adjustments to that protocol, signed in 1990, call for a ban of ozone-depleting substances (with a few exceptions) by 2000 with an additional decade for developing countries (28, 29). Negotiations are under way to advance that schedule in light of recent scientific evidence showing observed ozone depletion at faster rates than previously predicted.
It is early to assess compliance and effectiveness of the Montreal Protocol. However, many industrialized countries may overcomply because the transition to CFC-alternatives is proving easier and less expensive than originally feared. Evidence of ozone depletion, support from most major CFC manufacturers for stricter regulation, and persistent pressure by environmental NGOs have already contributed to swifter and more stringent domestic regulation in industrialized and some developing countries.
Oceanic Cases
OIL POLLUTION AT SEA Although accidental oil spills have commanded more public attention, “normal” operational discharges of oil into the sea, primarily from washing tanks and discharging ballast water, are the largest source of human-caused marine oil pollution. Attempts to manage oil pollution date back to the 1920s, but had little effect until the combination of the environmental movement and several salient accidental spills–e.g.– Torrey Canyon (1967) and Santa Barbara blowout (1969)–highlighted the need for domestic and international action.
International efforts to control operational and accidental oil pollution have centered on the Intergovernmental Maritime Consultative Organization (IMCO), formed in 1958 (in 1981 “Consultative” was dropped, “Intergovernmental” became “International,” and IMCO became IMO). Through the late 1960s IMCO served as consultant on uniform international safety standards, some of which also helped to reduce oil pollution. Following the damage from the 1967 Torrey Canyon accident, IMCO member states clairified the rights of coastal states to be compensated for accidental oil discharges. Subsequently, the 1973 Convention for the Prevention of Pollution from Ships (MARPOL), which employs an IMO body as its secretariat, set standards for operational discharges as well as for various measures designed to reduce accidental discharges. The original MARPOL never entered into force because of disputes over other provisions regarding transport of hazardous chemicals, but a modification in 1978 made the agreement more acceptable by separating and stretching out regulations on oil, hazardous substances, and other topics. Together these are known as MARPOL 73/78. Approximately 60 countries belong to MARPOL in some form.
IMO serves as a negotiating forum to amend and adjust safety and pollution standards; thus MARPOL 73/78 and related regulations are not static. IMO and MARPOL regulations take two forms, both implemented domestically. Operational regulations set guidelines for the conduct of tankers, for example by restricting the areas and rate at which oily ballast water is discharged into the ocean. Technological regulations prescribe equipment and designs that must be present on tankers of different sizes. Data on compliance with either form of regulation are not collected. Compliance with operational regulations can be assessed only by examining the self-reported records of ship captains; given the conflict of interest and general lack of independent monitoring, compliance may be far from perfect. Compliance with some technological regulations is nearly perfect, probably because the ease of detecting noncompliance and cost of retrofitting are both high (R. Nlitchell, personal communication; 33). In practice, as is frequently the case, a few large countries and firms are more active in the setting of standards than the whole; theses heavily influence the pace and direction for the international process of setting and enforcing common standards.
MEDITERRANEAN POLLUTION By the early 1970s, pollution of the Mediterranean, especially near industrial centers, had visibly increased, as had highly publicized egregious cases. The international response was a comprehensive plan to study and reduce Mediterranean pollution as a single ecosystem, rather than through a series of piecemeal agreements. Negotiated with strong leadership from the United Nations Environment Programme (UNEP), the 1975 Action Plan (Med Plan) seta forth the comprehensive approach (34). The legal instruments began the following year with the 1976 Barcelona Convention and two protocols calling for prevention (and, for some substances and cases, banning) of marine dumping and cooperation to reduce oil pollution. UNEP subsequently made the Med Plan a model for integrated pollution control in other regional seas (51); however, in most other applications the Med Plan model has, for a variety of reasons, not worked well (36). A notable case where the Med Plan model has not been used is the North Sea; although initially ineffective, there are recent signs the North Sea regime is becoming more effective (10, 52-54).
The main feature of the Med Plan as its system of coordinated monitoring and research (Med Pol), which has improved general understanding of the problem and has transferred knowledge, skills, and technology to developing countries in the Mediterranean. Some argue that these scientific activities have built networks of concerned researchers that, in turn, have effectively pressured governments to take substantive measures to reduce Mediterranean pollution (35). The most important substantive agreement is the land-sources protocol (1980) because such sources are, by far, the most important contributors to Mediterranean marine pollution. Although that protocol entered into force in 1983, it is early to determine how effective it has been or the general level of compliance. Implementation depends on standards still to be developed by the Med Plan’s scientific research programs. An additional protocol on specially protected areas was signed in 1982 and entered into force in 1986.
There was been a great deal of activity, for example, the construction of sewage treatment plants, suggesting compliance and effectiveness. But, it is unclear how much be can assigned to the Med Plan process and how much to domestic actions that would have proceeded anyway.
Management and Preservation of Natural Resources
Management characterizes the main objective of many fisheries agreements, of which we consider one, the North Sea herring. Preservation characterizes the protection of endangered species and the Antarctic. The whaling agreement began as a management issue and has gradually shifted to preservation.
We do not consider the several agreements on transport and disposal of hazardous waste, although they are related to preservation of natural resources. These include the 1989 Basel Convention on Transboundary Movements of Hazardous Wastes and Their Disposal (55) and the 1972 London Dumping Convention on disposal of wastes at sea (56, 57).
WHALING From the end of the 19th century through the middle 1960s the annual harvest of whales grew dramatically, peaking in the 1930s and again in the 1950s; consequently, the population of blue whales, for example, dropped from a quarter million to the tens of thousands. In the 1940s, overwhaling in traditional areas of the North Atlantic and Pacific, coupled to technological improvements, pushed the industry from the North Atlantic and Pacific to the Antarctic, which rapidly became the largest source of whales. Overwhaling has long been evident, but the several pre-World War II attempts to manage the population failed (37). Using the many existing and previous agreements to manage fish and seal populations as a guide, 1 in 1946 the whaling nations established an International Whaling Commission (IWC), as a negotiating forum for management of whale stocks. The IWC meets annually to discuss the state of stocks, to set quotas and other regulations, and to review how well the past season’s quotas and regulations were obeyed. Its Scientific Committee has warned, fairly accurately, of overwhaling problems; through the middle 1960s those warnings were only partially heeded in the quota and regulation-setting process (i.e. the quotas were set too high; 38). The Scientific Committee sponsors some research of its own but also relies heavily on outside sources, for example national reports on the annual whale catch and the International Council for the Exploration of the Sea (ICES, see below discussion of North Sea herring fishery).
The original rationale for the IWC was to maximize the economic benefit of whaling by reducing overfishing and, eventually, increasing total catch. In the early 1970s that rationale changed towards preservation of whales; at the 1972 U.N. Conference on the Human Environment (Stockholm), the preservationist ethic was reflected, for example, in a “whale parade” and a call, led by the US delegation, for a 10-year moratorium on whaling. Domestic pressure in many European nations and the United States to stop whaling was also strong. From that time, annual meetings reflect the shift away from economic management towards preservation (37, 38). There were also changes in membership as nonwhaling nations joined the IWC in the late 1970s and early 1980s to form a voting bloc; with this new membership the IWC approved a moratorium, beginning in 1986, that continues to the present. Whereas through the 1960s a major problem had been that quotas were set in excess of the scientific committee’s recommendations, the moratorium set quotas below what was probably justified by the IWC’s scientific assessment (41a). Some whaling nations (Japan, Norway, and the Soviet Union) entered objections to the ban, while others (e.g. Iceland) shifted to “scientific” whaling; through both these mechanisms, some whaling continues, and IWC has no formal authority to prevent such whaling. Through public opinion, NGOs continue pressure to stop all forms of whaling; some countries have assisted these efforts with threats of retaliation against whaling nations (58a).
Overall, compliance with IWC quotas seems to have been high. 2 The IWC meetings regularly address enforcement and compliance; national reports indicate that the number of infractions was perhaps one to two percent of the total catch (37). Not all nations submitted reports, and there have been numerous third-party reports and indirect evidence (e.g. anomalously low populations of certain whales) of noncompliance, including a dozen notable cases. In 1955 Norway first proposed an International Observer System (IOS) of independent observers to be stationed on whaling ships and factories to verify compliance. It was not until 1972 that IOS was put into action, and since then compliance has probably gone up (37). However, there are indications that compliance was already rising as the whaling fleets of persistent violators were purchased by the major whaling states.
Some claim that because the moratorium fails IWC’s original goal of commercial management of whaling, IWC effectiveness is low (10). Others suggest that because whaling has declined markedly in the past two decades, in part because of IWC decisions, the whaling regime has been effective (11). Future effectiveness is unclear because Iceland, a major potential whaling nation, has announced it will withdraw from the IWC.
ANTARCTIC TREATY SYSTEM Systematic exploration and territorial claims on Antarctica extend bark to the turn of the century. After World War II those claims expanded and threatened to militarize the continent. Antarctic research figured prominently in the 1957/58 International Geophysical Ym (IGY), the highly successful 18-month internationally coordinated scientific probing of the Earth. The 1959 Antarctic Treaty, negotiated with US and USSR leadership, calls for the continued absence of military activities, the suspension of all territorial claims, and the coordination of “peaceful” scientific research on the continent Membership in the treaty has remained small, a few dozen countries, because a prerequisite is serious interest in Antarctic research, typically demonstrated by maintenance of a year-round scientific base. In addition to the 1959 treaty, the parties have negotiated agreements to control seals (1972) and Antarctic marine living resources (1980), especially the rich fisheries (59, 60). The suite of treaties is known as the Antarctic Treaty System (ATS). A 30th anniversary review of the ATS produced a ban, signed in 1991, on mineral exploration for at least 50 years.
Parties to the treaty meet every two years to make decisions and interpret the provisions of the treaty; thus the ATS evolves over time (42, 44). Because the Antarctic Treaty manages both the continent and its surrounding oceans, it overlaps with efforts in other areas, for example the Law of the Sea, the whaling regime, and agreements controlling transport and dumping in the ocean (e.g. the 1989 Basel Convention on the Control of Tran boundary Movements of Hazardous Wastes and Their Disposal which, among other controls, prohibits disposal of hazardous waste south of 60 o S latitude).
The verification provisions of the ATS are unique in allowing anytime/anywhere inspection, including over flight, by any of the parties, and requiring advance notice of all expeditions. In practice, only the United States has regularly conducted such inspections, and only to underscore the international status of the continent (42) and to establish the precedent of intrusive inspections, which the Soviet Union had not accepted in the 1960s when the United States first conducted its Antarctic inspections. Although it is difficult to assess, compliance seems perfect, except that the treaty calls for coordination of scientific research that seems the exception rather Um rule. The Scientific Committee for Antarctic Research (SCAR) of the International Council of Scientific Unions (ICSU) helps integrate scientific research programs, but final authority for essentially all Antarctic research rests with national governments who provide the funding, as is normal and was the case even for the IGY.
ENDANGERED SPECIES As with many issues of environmental preservation, extinction of species became an important issue with the 1960s environmental movement. Domestically many countries passed laws to protect species, primarily popular land mammals, and their habitats. The 1972 Stockholm conference reinforced these concerns at the international level. The main international legal instrument to control extinctions has been the 1973 Convention on International Trade in Endangered Species (CITES), negotiated with US leadership and pressure from environmental groups. We focus on CITES, although controlling loss of species involves other agreements, including whaling and others (39).
Although the CITES goal is to preserve species, the mechanism is limited to controlling international trade in those species. CITES distinguishes among species according to their risk of extinction by listing species in two appendices: the first, of endangered species, for which commercial trade is essentially banned; and the second, of threatened species, for which commercial trade is closely controlled. Because decisions on listing are made by majority voting of the parties, there is also a third appendix in which a country ran unilaterally place a species to notify the international community that the country considers that species to be in need of international controls. The competence with which the trade restrictions are implemented varies widely by country and species.
The International Union for the Conservation of Nature (IUCN), 3 a quasi-governmental organization, has adopted endangered species as one of its issues and, since the 1960s, has been the leading international authority on the status of various species, publicizing its findings through its annual “red book.” In an unusual arrangement, IUCN also provides secretariat services to CITES on contract from UNEP; in that capacity IUCN performs and contracts a limited amount of research, data collection, and technical assistance related to formulating and implementing CITES regulations (45).
Losses of biodiversity surely continue, though the magnitude and distribution of species loss are uncertain. The most important levers on species decline are domestic actions to preserve species and their habitats, which are outside the realm of CITES. Thus, the regime is unable to stop extinctions directly. Parties to the Convention are required to send annual reports, including trade records, to the secretariat but assessing compliance requires some estimate of how many international shipments circumvent the system, which appears impossible to determine. Some reports suggest that even in the United States, which has among the strictest domestic implementation of CITES, compliance is low. Both because CITES is implemented poorly in many countries and because the agreement controls only international trade, its effectiveness in stopping extinctions is probably low (46). However, for many species and in many countries, there is evidence of more stringent local regulations than would be the case if CITES were not in existence.
FISHERIES MANAGEMENT The management of fisheries for maximum sustainable yield (MSY) is the apotheosis of international management of natural resources. There have been many fisheries agreements, but most have been ineffective in stopping overfishing, although it appears that effectiveness has improved since the 1970s in many cases (61). We focus on the North Sea herring fishery because it has received the most attention and may be the single most important of the fishery arrangements.
Until the middle 1970s the catch of herring was the most abundant of an the North Sea fishes, but extensive overfishing caused yields to drop until 1977, when the fishery was closed for five years to allow recovery. The fishery has evoked a variety of institutional responses. From the late 1950s it was controlled by the Northern Atlantic Fisheries Convention and its Commission (NEAFC), but they acted only as advisory bodies and had little practical impact on overfishing (48). The extension of exclusive economic zones (EEZs)–the area in which a nation has exclusive control over economic activity–in the 1970s to 200 miles effectively divided the North Sea among Norway and the EC member states, at which point control was removed from the NEAFC to more flexible bilateral negotiations between Norway and the EC (47). Negotiations have remained cumbersome because of disputes within the EC, which was both negotiating a common fisheries policy and expanding in membership at the time the EEZs were extending outward (62).
Since 1974 the principle of total allowable catch (TAC), a quantity based on assessments of MSY and the current status of the fishery, has been accepted as the means of controlling the fishery. Before the ban, the agreed quotas markedly “ceeded TAC; furthermore, compliance even with those agreed quotas has been low. It has not been difficult to detect noncompliance since statistics on the catch have been collected and disseminated since early in the century by ICES, an organization explicitly established to improve the data on fisheries (37).
It appears that little has changed as a result of the ban. Overall, compliance with the ban, at least initially, may have been high and, generally, the stocks have recovered, though not to levels that allow MSY. In the last years of the ban there may have been considerable fishing in banned areas, but reported as catches from unbanned areas of the North Sea. In the period since the ban effectively ended in 1982, agreed quotas have exceeded recommended TACS, and disputes over dividing the quotas have resulted in fishing at levels even above the agreed quotas. An accepted formula for distributing the quotas may help reduce these controversies (47a).
FUNCTIONS AND CONCEPTS
Here we describe issues that arise when comparing agreements and illustrate them with examples that extend the brief description of each agreement already provided. The discussion is divided into the two main functions: monitoring and verification.
Monitoring
“Monitoring” here means the process of acquiring information used to facilitate decision-making and implementation of an agreement. Three types of information are collected: finite about offending behaviors that lead to the problem, for example the catching of fish; second, about the problem itself, for example trends in the stocks of fish; third, about responses to the problem, for example to what degree particular governments enforce fishing quotas. These different types of monitoring are used to different degrees in each of the cases. We illustrate by discussing five dimensions of the process of monitoring. The three by five matrix is shown in Figure 1; the discussion below fills in the boxes by moving left to right, top to bottom.
MEASURABILITY The offending behavior that can be measured affects the agreements that are negotiated and the extent to which they are implemented. The whaling and fisheries agreements have logically attempted to set quotas of allowable annual catch because such data were easily collected and comparison with some standard relatively straightforward. In the oil pollution case, the contrast between operational and technological standards further illustrates the point: technological standards are easy to monitor, for example by demonstrating the presence of a particular device onboard the ship; operational requirements are difficult to monitor because they require observing the ship in diverse settings and over extended periods. To improve measurability (and increase stringency), IMCO changed the definition of an illegal oil discharge from 100 parts per million to the “clean ballast” standard (30). Under the new definition, noncompliance with “clean ballast” could be shown by aerial photograph, rather than in situ measurement. In practice this has proved complicated because additional in situ data are needed to demonstrate that an oil slick was the fault of a particular ship.
Regarding monitoring of the problem itself, lack of measurability is pervasive. Statistics on fish populations are notoriously inaccurate; the same is true for whales, though to a lesser degree because they live on the surface and are large. Improving the capacity to measure the relevant environmental parameters has been an explicit goal of both the Med Plan (through Med Pol; 35) and LRTAP (through EMEP; 24). In both cases the approach has been twofold: to fill gaps in the scientific research programs necessary for conducting the measurements; and to adopt uniform monitoring practices so that data and results are comparable.
Figure 1. Types and dimensions of monitoring
Measurability of responses to these problems is occasionally an issue; though most international environmental agreements do not formally require monitoring of how the actions called for are implemented domestically, frequently the parties are required to self-report on the process of implementation. The issue does arise at the periodic meetings of the parties, usually in the context of debates over compliance. The question is rarely one of monitoring whether or not the agreement has been implemented but, rather, whether implementation has been sufficient.
DIRECT AND INDIRECT INDICATORS Problems with direct measurability lead to the use of indirect indicators. In the case of monitoring behavior, most agreements to control atmospheric emissions make extensive use of indirect indicators because the technology for measuring gaseous emissions accurately is expensive, especially for diffuse nonpoint sources. Sulfur dioxide emissions in Europe, which are used to assess LRTAP compliance, are computed from the sulfur content of feedstock coals and unburned ash, except in cases where emissions-monitoring devices are instaued in the stacks and thus emissions can be monitored quasi-continuously. The Montreal Protocol controls “consumption” of CFCs, which is defuied in the Protocol as: production + imports – exports. The goal of the Protocol is to control atmospheric release of CFCs, but that would have been too complicated to measure in practice, so consumption was agreed upon as a reasonable indirect measure. Indirect data on polluting behavior, for example, emissions of acid-causing substances, can also be gained by working backwards. With the EMEP monitoring network, data on emissions from other countries, data on air currents, and numerical models, it is possible to deduce the gross emissions from a particular country. EMEP’s capabilities are unusual for international environmental regimes (23). There are several cases in the IWC history when inconsistency between data on whale stocks and self-reported data on whale Catches produced suspicions of noncompliance, for example, anomalously low data on humpback populations. In the ozone case, for large countries, it may be possible to determine gross compliance of large producers and consumers of CFCs with the Monural Protocol from atmospheric monitoring, data on other countries’ emissions, and atmospheric models.
Indirect measures are also frequently used to monitor a problem. Oil pollution catastrophes–used as an implicit measure by the public–have been instrumental in pushing adoption of IMCO/IMO and MARPOL regulations. Similarly, residents of Mediterranean states easily detect dead fish and smelly water. Visible dieback of German forests served as an indicator that helped convince that country to push for controls on emissions of acid-causing substances. Because data on fish stocks are poor, the catch of fish is frequently used as an indirect indicator of the stock: the declining herring catch helped to force the United Kingdom to close the fishery in 1977; the disastrous catch of the 1964-1965 whaling season helped to galvanize whaling nations to seek more rational management of the resource.
For long-term problems, indirect indicators of the problem may be all that is available, and extensive use of models, simulation, and forecasts may be needed to identify needed policy changes in a timely fashion. The London amendments and adjustments to the Monaral Protocol are partly based on computer models of the future problem, because it is impossible to measure such a problem direcgy until well after the needed actions must be taken.
Regarding direct and indirect indicators of implementation, IMO provides an example. MARPOL requires that members report all infractions and enforcement of the MARPOL regulations. As secretariat, IMO reports the number of infractions, fines, and other sanctions; these are, at best, only indirect indicators of compliance and implementation. The same has been true in the whaling agreement, except that since 1972 there have also been the IOS reports, which are a direct measure of whether selected ships and factories obey the IWC regulations.
SELF-REPORTING The most extensive source of monitoring information for all these agreements is self-reporting. The Montreal Protocol is entirely dependent upon national reports of production, imports, and exports of ozone-depleting substances. Five years after the Protocol was signed, these basic data are still missing for some countries. Much is dependent upon these data; for example, the classification of developing country-and thus eligibility for a 10-year delay in compliance with the Protocol-is computed from self-reported data. 4 Both the herring fishery and whaling cases show a different form of self-reporting: in those cases, the industry has provided the most useful data sets. The Bureau of International Whaling Statistics, established by the industry and the Norwegian government in the 1920s, provides the essential data on commercial whaling. The International Council for the Exploration of the Sea, using industry reports of annual catch, provides the data for the history of the herring fishery. In all these cases, it is unclear to what degree self-reported data are accurate.
National reporting is also a central component of monitoring the problem. Typically the secretariat for international agreements is small and has neither the funding nor capacity to conduct its own research; the few exceptions include the IWC and the IUCN (for the whaling and CITES cases, respectively), which are able to support a very limited amount of research related to monitoring. Because of limited international research capacity, national research programs, often conducted apart from the international agreement to control the problem, are usually the most important source of information. Consequently, most international environmental agreements include an under- standing that relevant national research results will be shared. Essentially every international environmental problem that has been “identified” by some scientific research program–the depletion of stratospheric ozone is the most notable–owes its origin to a few national research programs and free dissemination of the results.
Finally, national reporting of information about implementation is the norm in those cases where such data are required (17, 19). Whaling, CITES, LRTAP, and MARPOL all have mandatory self-reporting of issues related to domestic implementation of the international agreement, for example the number and amount of fines levied against violators. However, the quality of reports varies; for example, whaling reports have been notoriously late and incomplete, and similar experience exists with many other agreements (19). In addition to formal reporting, a number of agreements are characterized by a great many informal sources of reporting about government implementation. Nongovernmental organizations (NGOs) are playing a larger role in such reporting, at least in a few of these cases. At IWC and Montreal Protocol meetings NGO observers usually outnumber the member states, and they make available detailed critical analyses of national responses. The biennial statistical anthology World Resources published by an NGO, the World Resources Institute, in cooperation with U.N. agencies, spotlights shortcomings of policy responses on a range of problems. Nonetheless, NGOs may be most effective by their direct communication with the public and creation of political pressure rather than through infon-ning the formal processes of treaty negotiation.
INTRUSIVENESS In most cases where national reporting is the norm, intrusiveness is obviously low. However, there is varied experience with intrusive monitoring; carefully considering those cases is important because some observers claim that intrusive monitoring is a prerequisite for effective international governance.
From these nine cases there are two examples of intrusive monitoring of behavior. First, the IWC’s International Observer System (IOS) requiring whaling ships to allow impartial observers to monitor the killing of whales was in response both to claims that the whaling ships and nations whose flag they fly were inaccurately reporting data, and to claims that banned or more stringently controlled species were being killed and processed at sea, then mislabelled before the ship returned to port. The IOS seems to have rectified that problem, though it is unclear if high compliance on IOS-attended ships and factories is an accurate indicator of compliance at non-IOS facilities as well. IOS is not fully intrusive because it is based on bilateral exchanges of observers, and the observers tend to be exchanged between whaling nations and thus may be more lenient than would be the case if nonwhaling nations were, extensively involved in the IOS. The second case of intrusive monitoring is the anytime/anywhere inspection system of the Antarctic Treaty. In both cases, compliance may have increased slightly as a result of having intrusive inspections available. Intrusiveness may serve goals other than higher compliance; as noted earlier, the United States conducts Antarctic inspections primarily to reaffmn the principle of nonownership of the continent and to establish a precedent for intrusive inspections.
In monitoring the problem, intrusiveness has not been a significant issue. Because of cost, little monitoring of the problem is sponsored directly by the international organization. In those cases in which international monitoring of the problem has taken place–EMEP, Med Pol, and to a much lesser degree IWC and CITES—the sanction of the international collaborative effort seems to reduce fears of intrusiveness. Furthermore, in most cases, the international monitoring is carried out by local officials. Yet, because of the large role of science in all cases, in some sense there is a lot of intrusive monitoring. International scientific research on environmental topics is highly intrusive by nature, because scientists and their instruments travel around the world, subject partly to governmental prerogative.
In the monitoring of policy responses, many transnational actors, notably NGOs, in effect act as intrusive monitors. In none of these cases is this function formally established in the international environmental agreement, but it is carried out nonetheless.
ORGANIZATION Finally, monitoring activities vary in the organizational arrangements for carrying them out. Regarding monitoring of behavior, where self-reporting is the norm, the suite of organizational arrangements is dependent upon the prerogatives of the state. One of the major obstacles in several cases, notably LRTAP, was the absence and/or incompatibility of national emissions statistics because of widely different domestic capacities to collect and report data needed for the international regime. None of the cases that uses national reporting has a perfect record; often countries do not repom falsify reports, or submit incomplete or poor-quality reports (19). Much of this stems from the lack of domestic organizational capacity to prepare such reports. Some such misbehavior is intentional; in the 1960s Panama did not submit whaling catch reports to the IWC, even though it could have, because the only Panamanian whaling ship was engaged in egregious violation of the quotas. National data collection and reporting are not the only source of information. The Bureau of Whaling Statistics and the ICES, as noted above, are primary data sources for the whaling and fishery agreements and are supported not only by member nations but also by industry. In only one case, the IWC’s International Observer System, was there a new organizational capacity explicitly established to assess the veracity of self-reporting, and in that case the program was very small and funded on a bilateral basis by the parties.
In almost every case, the organizational arrangements for monitoring the problem are informal and diverse. Insofar as scientific information is critical for such monitoring, the existing national scientific research programs–which are frequently not organized or funded for the explicit purpose of providing information to the regime–are the most important sources of information. Frequently the regime supports some applied monitoring research; for example, as secretariat for CITES, IUCN provides some grants for monitoring stocks of species; the IWC supports similar types of research. Yet this research remains highly limited, primarily because of cost and lack of resources. Funding in the examples just cited is on the order of tens of thousands of dollars annually. In a few cases international funding commitments have been greater, and organizations have been established to improve such monitoring. The EMEP program under LRTAP and the Med Pol program under the Med Plan are two cases in which the regime explicitly empowered the organization to provide the primary source of monitoring information on the problem.
Regarding the organizational aspects of monitoring policy responses, in none of these cases is an organization formally empowered to collect information on policies. In those few cases where there is some formal reporting of national policies (whaling, MARPOL, LRTAP), the process is through national self-reporting. In most cases the secretariat collates and assembles national reports but provides little or no analysis of how those reports individually or collectively contribute to the goals of the regime. Thus, the organizational arrangements for such reporting are left to the member nation’s prerogative. Indeed, the extent to which nations actually submit the required reports depends highly upon the domestic organizational and technical capacity to collect and publish the needed information (19).
Actual functions and influence of organizations differ from the formal arrangements within the regime. For example, though national reporting of policies is frequently not a formal part of international environmental regimes (and even when it is there is flagrant nonreporting), the information nonetheless makes its way into the debates and actions of the regime. Independent of whatever formal arrangements exist, nations monitor each other in their implementation of international commitments, and independent groups such as environmental NGOs frequently monitor everyone. 5
Formally established organizations might have greater legitimacy with governments than informal networks, and legitimacy might lead to greater influence. However, the relationship between legitimacy and influence is far from clear. For example, EMEP’s legitimacy has been high, but so has the quality of its work; this combination makes EMEP results influential. IWC’s Scientific Committee has always been the most legitimate scientific body for the international whaling regime, but in the 1960s the quality of its work was low and its influence consequently diminished. IWC rectified that by establishing another small scientific advisory body, under the auspices of the Food and Agriculture Organization, whose work was influential because it was seen as unbiased, even though its legitimacy as an IWC body was lower than the formally established scientific commission. IUCN has long had considerable influence on the CITES process because of its “red books,” even though IUCN’s legitimacy has been problematic for some CITES members because it is not a strictly governmental organization. In the ozone case, it appears that scientific results were given greater legitimacy through an international scientific review process sponsored by the World Meteorological Organization and the United Nations Environment Programme, even though the bulk of the work had been done by scientists in a very few industrialized countries (50, 28).
Verification
Monitoring activities do not necessarily reveal when parties are in compliance. Verification, the process of determining whether a party is in compliance, varies across three dimensions: capability to verify, definition of compliance, and organizational arrangements.
CAPACITY TO VERIFY: NATURE OF THE STANDARD Many agreements are easy to verify, sometimes reflecting that the agreement was tailored to the prospects of verification. Easily verified agreements are characterized by a close match between the standard against which compliance is assessed and the information on behavior produced by monitoring. Fisheries agreements are of this vnn because the regulations tend to be simple (e.g. a quota or a technological standard such as minimum mesh size) and there is a lot of self-reported data. When the standard is indeterminate, verifying compliance is more difficult. The population dynamics of fisheries are typically not well understood or documented. Thus, determining what the. standard or quota should be is frequently difficult. The agreement to reduce land-based sources of Mediterranean pollution essentially calls for each country to do its best; thus there is no objective standard for determining compliance. Under CITES, there are only general standards against which it might be determined if local authorities have properly implemented the agreement; only in egregious cases is it clear that CITES obligations have been violated.
Improved capability to verify need not produce a more effective agreement. In the case of the herring fishery, compliance was low even though it was easy to determine noncompliance. With CITES, even though some forms of compliance are difficult to assess, many countries probably would not have joined the agreement if the standards had been more objective.
DEFINING COMPLIANCE: STRINGENCY OF THE STANDARD Although it is difficult to test the veracity of self-reported data, it seems that compliance with the nine agreements is fairly high. However, much of this may be an artifact of the standards. In the late 1950s, Norway and the Netherlands withdrew from the IWC in a dispute over quota-setting; they rejoined in the early 1960s when quotas were raised. Compliance remained high throughout the period; indeed, IWC quotas usually exceeded the actual catch. If Iceland leaves the IWC in the future, as seems likely, then compliance may remain high although significant whaling continues outside the regime. It appears that both LRTAP and the Montreal Protocol have similar levels of over compliance, but the former has done less to control the environmental problem than the latter. Thus verifying compliance is not the same as determining whether or not a particular party or the agreement as a whole has been effective.
The process of distinguishing compliance from noncompliance depends not only on how stringent the standards are set but also on how the problem is defined. Through the 1960s the IWC thought of the whale problem largely in aggregate terms, and thus set quotas in blue whale units (BWUs)–catches of different whales were converted into a single number according to an index. Compliance largely depended upon whether a particular nation’s catch in BWUs exceeded the quota, also expressed in BWUs. The main effect of changing to New Management Procedures in the early 1970s was to abandon the BWU and, instead, set quotas for individual species and individual parts of the ocean. Increased sophistication of whaling standards better protected the whales, but also required new and more extensive monitoring information both on the behavior of whalers and on the nature of the over whaling problem.
ORGANIZATON In most environmental cases there is a minimal role for the international organization in verification of compliance. Most agreements have secretariats and require some form of exchange of information such as national reports that can be used to assess compliance. Where the international organization sponsors some monitoring–LRTAP, the Med Plan, and to a lesser degree the IWC and CITES—there is some independent capacity to determine compliance. In practice, even when the international organization actively collects information on domestic implementation of the international agreement, it plays little formal role in explicitly identifying parties that are out of compliance. However, the process of collecting and disseminating the data probably makes it possible for other organizations, such as other signatories to the agreement or NGOs, to expose noncompliance. In some cases–notably IUCN under CITES, and UNEP under the Montreal Protocol and the Med Plan–the international organization has played an important informal role in identifying actual or potential noncompliance and exerting effective pressure.
Conclusions
Monitoring and verification have not been salient aspects of most international environmental issues. No large organizational infrastructures have been created at either the international or domestic levels to fulfill these functions. Most formal information collection under the regimes is self-reported by existing domestic organizations, although NGOs and other actors oversee and contribute to the effectiveness of the regimes to some extent. Thus, although compliance with the agreements seems to be high, the heavy reliance on national reports-which are incomplete, and may be inaccurate because of conflicts-of-interest–inakes true assessment of compliance difficult. Moreover, levels of compliance depend critically on the nature and stringency of the standard. Thus it is important to consider not only compliance but also whether standards are set at appropriate levels. Because international organizations have neither the power nor the capacity to monitor and enforce standards, we tentatively suggest that the most effective standards are those that allow for unilateral action, whether by parties to the agreement or by other actors such as NGOs.
DOMESTIC EXPERIENCE
Many of the same issues and concepts arise in the domestic context, where verification and compliance have been analyzed more extensively (63, 64). Nearly all of the theoretical work on economically optimal systems of verification has been done with the domestic context in mind. Domestic cases may be easier to study because they lack the complication of inherently weak international decision-making and enforcement.
EMPIRICAL STUDIES In the United States, responsibility for environmental protection is divided between the federal government (primarily the Environmental Protection Agency, EPA) and state governments. For example, to control urban air pollution the EPA sets standards for allowable ambient concentrations of several pollutants (the National Ambient Air Quality Standards, NAAQS); the states and some localities are responsible for implementing regulations locally so that, by certain dates, emissions of pollutants are controlled and the NAAQS are met (65, 66). In addition, there are federal emissions standards for new pollution sources. 6 Most enforcement (i.e. inspecting of sources and imposing of sanctions) is done by state authorities, but some 10% is done by EPA. The result is that the states and occasionally EPA monitor individual pollution sources for compliance, both the states and EPA monitor for compliance with ambient air concentrations, and EPA monitors the progress of states in implementing their air pollution control plans. The verification regime telescopes from individual sources up to the EPA.
Studies of state monitoring of individual pollution sources suggest that state authorities vary widely in competence but that generauy their inspections of polluters are too infrequent and cursory (63, 68, 69). Harrington’s (70) study of New Mexico showed that state authorities adopt fairly effective rules of thumb–for example, to inspect large polluters and frequent violators more often-so data on inadequate inspection may understate the efficacy of the inspections that are performed. Other case studies fmd much the same. Inspections frequently consist of spot checks to gauge the consistency of self-reported data on emissions, thus encountering the obvious problems of veracity with such data. Technological innovation may soon improve the prospects for monitoring, since continuous emissions monitoring systems (CEMS) are being installed on sources, making it much easier (and less expensive for government) to gain a continuous, tamper-proof record of actual emissions to the environment.
Studies of enforcement find much the same. Regulators are usually unwilling to levy large fines or other sanctions because these lead to expensive legal challenges and delays; the courts have also assessed only modest sanctions (66). There is some evidence of a trend towards stiffer sanctions, including jail terms; since 1983, EPA referrals of cases for criminal prosecution have increased significantly (71). Studies of EPA monitoring of overall compliance with the NAAQS show marked improvement for most pollutants since 1970 (72). The record is mixed for more difficult pollutants, notably tropospheric ozone in growing population centers such as southern California. EPA also monitors state implementation plans and the progress of such plans in achieving compliance with the NAAQS. In cases of continuing noncompliance EPA can intervene to enforce the federal standards and, for example, limit the siting of new pollution sources. In practice, EPA engages in a continuous renegotiation with state and local authorities rather than exercising its full power and autonomy. Thus, as with the international case, the term “compliance” has many meanings and is a function of the standard-setting process.
There have been similar studies of verification and enforcement for other issues, for example hazardous waste (73) and water pollution (64, 74). For comparison, the air pollution case described above is situated between two endpoints. At one extreme is inspection and enforcement of workplace health and safety regulations by the Occupational Safety and Health Administration (OSHA), which is very infrequent, one inspection per century per firm. Consequently, compliance and effectiveness of OSHA regulations may be much lower than if enforcement were higher (75). At the other extreme is EPA enforcement of water pollution regulations. This is regular–about once per year per firm–and thorough, and seems to increase compliance significantly and cost-effectively (64). The experience with enforcement of air pollution laws is closer to the successful enforcement of water pollution laws than the largely unsuccessful OSHA enforcement. Because of pervasive problems of measuring benefits of environmental regulations and enforcement, it is unclear what the optimal level of enforcement would be in these varied cases. Ostrom’s empirical study of management of local commons also finds that graduated enforcement supported by monitoring of behavior and compliance, contributes to effective management of natural resources, although she is unable to assess the exact relationship between enforcement and effectiveness (13).
A commonly asserted difference between international and domestic pollution control is that the former faces problems of sovereignty and thus cannot be intrusive. Domestic cases have also had to confront intrusiveness because the fourth amendment to the US constitution prohibits “unreasonable searches and seizures.” The courts have addressed this by reinterpreting the amendment so that it does not apply to neutral (i.e. unbiased) searches by administrative agencies, for example to enforce housing codes for the general good of the public (76, 77). This finding has been extended to include inspections for enforcement of air pollution laws (78), OSHA inspections, and many other similar cases.
THEORETICAL STUDIES In addition to empirical studies of domestic enforcement of pollution laws, there have been many theoretical contributions, largely by economists. Much of this can be traced to the work of Becker (79) and Stigler (80) on optimum enforcement of laws and the deterrent value of various sanctions such as fines and imprisonment. These have been extended to the case of environmental pollution by Downing & Watson (81) and Storey & McCabe (82). This research has become progressively more realistic to reflect the imperfect enforcement of pollution laws (83, 84) and the fact that pollution monitoring is stochastic (85). Synthesizing this literature, Russell et al (63, 86) have proposed an approach to enforcement such that the frequency of inspection would depend upon the number of alleged past violations. As noted above, regulators already adopt similar rules of thumb (70, 73); it is unclear to what extent the rules of thumb and the practice of enforcement deviate from the theory except for the general conclusion, already stated, that pollution laws are probably underenforced.
This theoretical literature on domestic enforcement of environmental laws may be useful for designing better monitoring and enforcement at the international level. To date, there is little evidence that it has been applied in that context.
THEORETICAL PERSPECTIVES
How might theorists of international affairs explain the patterns of verification evident in international environmental agreements? From a survey of several promising fields, the answers are both brief and speculative, because only a handful of scholars have asked the question directly. To further illustrate the differences among the theoretical perspectives, we have explored how they explain the preoccupation with verification in arms control cases but relative lack of attention in the international environmental cases.
GAME THEORY International cooperation is inherently a process of interdependent decision-making among two or more actors: it is a “game” in the terminology of game theory (87). Economists and political scientists have made extensive use of game theory to describe the conditions under which cooperation can be achieved. The process of thinking systematically about the costs and benefits or “payoffs” from cooperation has proved helpful (88-90), but it must be remembered that game-theoretic analyses are abstract and thus unable to describe fully the processes of bargaining and cooperation.
Figure 2. Structure of payoffs using game theory
One explanation of the difference in demand for verification between arms control and environmental protection is the structure of the “game” in the two issue-areas (Figure 2). From the perspective of nation A, arms control agreements are typified by the extreme need to avoid the case where A complies but B breaks the agreement. The demand for verification is high in those cases because there is a premium on identifying when the opponent defects. In contrast, environmental agreements may be less sharply characterized by such a payoff structure and thus the demand for verification is lower (91). Also, the emphasis in arms control verification upon “timely notice” of a violation reflects that the benefits of defecting without detection can be rapidly realized, whereas for environmental problems, which may be more cumulative, it may take longer for changes in behavior (e.g. from cooperation to defection) to result in changes to the payoffs.
Thus, the theory seems to predict successfully the differences between the arms control and environmental cases. Now we explore how well game theory can predict the differences in demand for verification among the nine environmental cases. Our nine cases span two ideal types of cooperation: coordination and collaboration (88, 89). Coordination games are characterized by the need for cooperation but the relative indifference of the parties to the particular agreement that is reached. Setting of common international standards for shipping (including many oil pollution standards) are of this type: the parties most want to avoid the case where cooperation fails and they face different shipping standards in every port. Coordination games are self-enforcing because behavior is not conditional on that of other parties and thus the incentives to defect are very low; thus these games should be accompanied by a low demand for verification. The other type of game is collaboration, where cooperation can achieve some common interest but there are significant incentives to defect. Both games in Figure 2 are collaboration; the top game is the famous prisoners’ dilemma. Collaboration games are not self-enforcing; thus these games should be accompanied by a high demand for verification so that each party can have confidence the other is not cheating. Tougher collaboration (more incentives to defect) should be accompanied by greater demand for verification.
These predictions are not met by the cases. Notably, the LTB is largely a game of coordination because US, Soviet, and UK nuclear programs did not appreciably suffer by moving underground, and the common problem of radiation in the atmosphere could only be averted if all parties moved underground. Yet the collective spending on verification procedures for the LTBT is probably greater than for the combined total of the other eight cases described in this paper, which reflects Cold War concern of Soviet cheating.
Rigorous testing of these predictions is difficult because the variable “demand for verification” and the payoffs of collaboration or coordination are difficult to define precisely. There are other complications as well. For example, fishery and whaling agreements had some built-in verification procedures before the agreement was first negotiated, such as the extensive self-reporting system provided by the ICES; thus marginal demand for verification in those cases might be depressed because much of the needed capacity already existed. Interestingly, the demand for verification in both the IWC and fisheries cases seems to be largely invariant with the level of compliance. Game theory would predict that as greater degrees of compliance are demanded and realized, the need for verification would increase because the risks of defection would increase as well.
Game-theoretic studies of international cooperation also underscore that games repeated over time lead to more successful cooperation than static games (92). This is true if compliance is transparent: willingness to collaborate more extensively and effectively will increase if the parties can be confident that all other parties have been adhering to past agreements. This suggests two related predictions: first, parties that want to improve cooperation over time will seek procedures for verification so that compliance is transparent. Second, in cases where compliance is transparent there should be an increase in confidence over time, accompanied by an increase in collaboration. Neither of these predictions is rigorously supported by the cases. In the case of the IWC’s international observer system, the original proposal was precisely to improve transparency of compliance. However, it took 18 years for IOS to be adopted; this suggests that the parties did not seek verification with much vigor. 7 Regarding the second prediction, there is not much evidence that when IOS finally went into effect that it produced greater confidence and more extensive collaboration. The stringency of IWC regulations did increase from the early 1970s to the present, but not because of IOS. In the LRTAP case, transparency of compliance may have led parties not to join the substantive protocols, rather than to cooperate more extensively and risk noncompliance.
In sum, game theory would appear to offer general insights into the demand for verification, especially the difference between the arms control and environmental cases. But upon closer examination, game theory is insufficient to predict patterns of behavior in environment.
DOMESTIC POLITICS Negotiating international agreements is better understood as at least two interacting processes: one at the international level and the other among domestic actors (93). In the United States the domestic debate over arms control agreements was characterized by loud proclamations of distrust of Soviet intentions; critics have demanded that arms control agreements have stringent provisions for verifying compliance. Because these critics have also had domestic political power, their concerns have been reflected in the formal international agreements. In contrast, the cries for verification of international environmental agreements have been few and soft. In many cases, the leaders of the environmental movement have sought world peace and trust; it is not surprising that verification has not been their major preoccupation. However, there are some cases where domestic interest groups have successfully enforced international agreements and norms, for example through boycotts. Domestic groups were able to add to the 1976 Magnuson fisheries act in the United States a provision requiring retaliation in the form of denied fishing rights against any other state that weakened the effectiveness of CITES (58).
The literature linking domestic politics to international negotiation might be usefully combined with studies of bureaucratic organization and procedures (e.g. 94). It may be that the important bureaucratic actors in the domestic formation of arms control policies-primarily the military–are “stamped” with an ethos of mistrust that leads the organization to demand strict verification. In contrast, the important bureaucratic actors in cases of environmental protection–for example, the Environmental Protection Agency–may be characterized by a different ethos, one that is less suspicious and more confident that compliance can be achieved without much attention to verification. This may explain the puzzle from the previous section: namely, why was there so much demand for verification of the LTBT when it is probably a self-enforcing agreement? The answer may be that because LTBT is an arms control agreement, its verification procedures are shaped by the bureaucratic and interest groups that think all arms control agreements should be extensively verified.
REALISM Realist students of international affairs assume that the distribution of power among states determines their bargaining strength and international behavior. Realists that have studied international regimes doubt that the regimes affect the behavior of states much because the underlying determinants of regime outcomes are state power. However, most realist students of international regimes accept that while economic and power relationships may be instrumental in the formation of a regime, once created the regime might exercise some independent leverage on behavior (4, 95). Because the most powerful states matter most those states will undertake to verify and enforce these international agreements on their own, according to their own preferences, rather than entrusting the task to some international organization. There is much evidence that compliance in some cases–notably CITES (referred to above) and the IWC–has been substantially improved because of threats by the United States against noncompliant states (58).
POWER AND INTERDEPENDENCE Power has proved a difficult concept to apply to studies of international relations, and in matters of “low politics” such as harmonizing of tariffs it is not clear what utility military power has. Rather, different states and nonstate entities have different degrees of power, depending on the issue at hand. Australia, New Zealand, and France have played leading roles in renegotiating the Antarctic Treaty; the United States played a leading role in negotiating the Montreal Protocol. UNEP has played the leading role in developing measures to protect regional seas, and NGOs have considerable power to influence behavior and regime outcomes in some issues. Even entrepreneurial individuals have some power over the structure and effectiveness of international agreements; for example, the Executive Director of UNEP was instrumental in the Montreal Protocol negotiations and subsequent efforts to strengthen the Protocol (28).
So far little has been said about enforcement of international environmental agreements and its effect on the demand for verification. Because of growing interdependence of states and a sense of “community” among a relatively stable set of actors, there are strong incentives to comply with international agreements–even where it may not be in a state’s immediate interest to do so–because the negative consequences of noncompliance may be felt in other issues (96). Because issues are interlinked, states have a variety of mechanisms to enforce international regulations; for example, the United States made effective use of threats to deny Japanese access to fishing waters within the United States EEZ unless the Japanese withdrew their objection to the IWC’s whaling moratorium. Formal, dedicated verification and enforcement may not be needed where economic and political interdependencies can be used to ensure compliance through “diffuse reciprocity” extending over time and across other issues (97). Cases of “high” politics such as nuclear arms control, where territorial security is the issue, may be characterized by lower interdependence and thus lower assurance of compliance and, perhaps, greater need for verification.
SYMBOLIC POLITICS An alternative explanation is that verification tends to be low not because of an expectation that nations will comply but because of neglect. Governments may negotiate many of these agreements for symbolic reasons—for example, to demonstrate concern about the environment and placate environmentalists. Thus they are concerned primarily with the presence and image of the international agreement and do not actually seek a process for forging substantive cooperation. The demand for verification remains low because verification is not integral to the symbol. Demand also remains low because verification might reveal noncompliance.
INFORMAL ACTORS The practice of monitoring and verification is conducted through many channels, not just the states and organizations that are formally associated with an international agreement. For example, it is now commonplace to assert an important role for NGOs in implementing international agreements by collecting and publishing information related to compliance and by pressuring states to control pollution. In CITES, IUCN has partially filled this function; in the whaling and fishery agreement the partially nongovernmental ICES has contributed extensive amounts of information. At present however, the roles and effectiveness of NGOs remain understudied both at the national and international level (98).
NORMS AND SOCIAL INSTITUTIONS The large number and increasing frequency of environmental agreements may reflect a long-term trend towards some form of world governance or even government. Perhaps such international governance is already evident in the various principles, norms, and expectations–some informal and others formally codified in international agreements–that are shared internationally. Scholars have long noted the power of norms in shaping behavior (99, 100), although it has proved difficult to track accurately when and how such norms develop. Nonetheless, high degrees of compliance that seem to be experienced in most international and domestic cases may reflect the operation of such norms, rather than the fear of formal enforcement. Individual compliance with laws may reflect the widespread belief that it is “right” to obey the law. Governmental compliance with international agreements may reflect the same principle operating on the international level. Governments tend to obey international agreements, choosing to change the expected norms rather than blatantly violating them (101). The effective operation of norms may reduce the need for explicit monitoring and verification. Within established communities norms may be more effective in shaping behavior; in addition, intrusive and cooperative monitoring may be easier and less costly. Clearly the operation of even well-established norms is not guaranteed. For example, the Iraqi invasion of Kuwait in 1991 violated the well-established principle of sovereignty.
Norms can be powerful; the environmental movement shaped a norm against whaling which, from the late 1960s to the 1980s, transformed the IWC from an organization that manages whale stocks to one that preserves them (37). In cases where norms effectively control behavior, little or no verification and enforcement may be needed. This may explain why states have devoted little attention to verification of these international agreements.
EMERGING ISSUES AND RESEARCH OPPORTUNITIES
ISSUES FOR NEW REGIMES Negotiations are under way to frame environmental regimes for global warming, tropical forests, and biodiversity. Based on this review, at least four issues are worth attention by practitioners and scholars addressing these problems. The first is availability of data. Analyses of global warming are based on country-by-country estimates of sources and sinks of greenhouse gases, not direct measurement; for many countries’ sources and sinks, the estimates are poor. The rate of tropical deforestation is uncertain. Biodiversity is marked by sparse data on both number of species and rate of loss. New regimes should be based upon data that are reasonably available or likely to be so in the near future. Perhaps it is possible to build incentives into regimes to improve data collection and dissemination and to counter false and incomplete self-reporting. Regimes calling for changes in behavior that are finer than the accuracy of data will not encourage compliance or permit verification.
The second issue is transparency and openness. Many of the successful regimes reviewed in this paper provide for clear presentation of data collected under the regime (transparency) and access to the negotiating process and information for a wide range of governmental and nongovernmental actors (openness). The environmental successes contrast with the arms control cases, which are marked by secrecy, obscurity, and limited participation. New environmental regimes may also benefit from transparency and openness.
A third issue is the balance between authority vested in domestic and international organizations. There is tension between the appeal of internationalizing environmental regulation and verification–for example, through creation of a global version of a national Environmental Protection Agency–and the reality that most functions of environmental management are carried out domestically, even when they form a critical component of an international agreement. Because monitoring and verification are intrusive, expensive, and must be responsive to local conditions, the balance favors domestic institutions. International organizations can contribute to verification, for example, through audit strategies such as the International Observer System and research and monitoring, but domestic organizations remain the mainstay of implementation. New regimes should be tailored to the reality of the domestic institutions upon which they depend.
The fourth issue is the division of roles between governmental and nongovernmental organizations. Domestically, NGOs have been important for setting environmental norms and pointing out noncompliance, a pattern likely to be extended. As in human rights, where organizations such as Amnesty International and Helsinki Watch have pressured governments to comply, we imagine that perhaps a “carbon watch” will play an important role in greenhouse verification. Such contributions of NGOs to effective international environmental regimes are enhanced by transparency and openness (101). It is also important to recognize that contributions of NGOs to international environmental policy are frequently dominated by concerns of industrialized countries, often have a narrow or “single-issue” focus, and are sometimes unresponsive to scientific evidence.
CONCLUDING THOUGHTS Because many environmental problems are the result of energy consumption, international organizational arrangements for energy issues must be kept in mind. Within the U.N. system there is a program for energy statistics, but it has little analytical capability and the data are frequently poor. The International Atomic Energy Agency addresses an important subset of energy issues, namely nuclear power. In OECD countries the International Energy Agency plays a coordinating role in energy markets. However, at the global level there is no organization particularly suited to address the pervasive link between energy and environment Currently, UNEP de facto is the lead organization on these issues because of its role in environmental protection, but UNEP’s expertise is spread thin across many fields.
It is also important to consider how advances in science and technology can contribute to international environmental verification, especially in monitoring, organization, and dissemination of information. Regarding non-point sources, for example, new monitoring devices can allow verification of agreements that would otherwise be administratively infeasible. Information systems ran allow worldwide transparency. The rapidity, extent, and cost of technological change and its effect on verification regimes are worth closer attention. Some technologies centrally controlled by a few countries, such as satellites, may assist global data collection and should be employed where appropriate, for example in the measurement of rates of change and extent of forest cover. Furthermore, the release of technical capabilities devoted to national security may greatly improve public knowledge about environmental changes ranging from deforestation to extent of snow cover and ice thickness.
Finally, study is needed to determine how market-based mechanisms to control environmental problems, currently in vogue, affect notions of compliance and verification. These mechanisms are largely dependent upon domestic institutions for implementation, and there is large variance across domestic systems, for example, in tax policies. International arrangements can help harmonize disparate domestic situations, but it is unclear how much harmonization is needed to accommodate international systems such as a global greenhouse tax or system of tradeable permits. Moreover, market-based mechanisms require changes in domestic institutions that make and implement rules, as well as new forms of monitoring, for example, tracking of permit trading that could markedly increase administrative burden (102).
A shift towards the market also implies a change in the definition of compliance. Existing environmental regulation is directed towards specific, predetermined firm responses to pollution abatement; compliance is determined by whether reality conforms to the standard. Where markets are employed, compliance is determined by whether emissions are covered by a tradeable emission permit and/or payment of an effluent fee. However, it is a priori impossible to determine the quantity and spatial distribution of emissions that will result. This uncertainty implies new strategies for detecting noncompliance and new challenges for public environmental management, which has been largely premised on a strong regulatory role for government institutions. A logical place for further study is the international and domestic verification regime needed for effective implementation of these market-based strategies.
Although lacking the urgency of verification in arms control, we conclude that greater attention to verification of environmental agreements is warranted. It may be a catalyst to better design of agreements and reporting of information and a stimulus to countries’ capacity to comply, as more environmental problems are addressed by international agreements. An enhanced statistical base will be needed to assess performance and compliance in meeting environmental goals. More attention to the improvement of national and international statistical systems for energy, forests, fisheries, toxics, and so forth may prove one of the greatest benefits of the development of international regimes.
APPENDIX: LESSONS FROM ARMS CONTROL VERIFICATION
Verification of arms control agreements is quite different in salience and procedures compared with international environmental agreements. Arms control agreements address matters of “hard security” and thus it is especially important to have timely detection of defections. Because arms control agreements predominantly control state activities rather than state subjects (people, corporations, etc), arms control verification is politically and physically less intrusive than international environmental agreements on the liberties of state subjects, which tend to be guaranteed by constitutions and norms of freedom.
Regardless of the differences, a comparison between arms control and environmental verification may be a useful exercise, if only because so much attention has been devoted to the arms control cases during the past three decades. In this appendix we briefly review the arms control verification literature and draw several lessons. Other types of comparisons would also be illuminating, for example between environmental and international criminal law enforcement.
Verification figures prominently in US-Soviet nuclear arms control (103). Also studied are the role of third countries, the role of international organizations, conventional arms control (104), prospective agreements to strengthen chemical and biological weapons, and the role of nuclear operations (105).
NUCLEAR ARMS CONTROL IN PRACTICE All major post-World War II arms control failures have in part been due to claims that the agreement could not be adequately verified: the 1946 Baruch Plan to transfer all nuclear weapons and materials to the United Nations partially foundered on the inability to detect clandestine nuclear weapons production without highly intrusive inspections; perennial proposals for a comprehensive nuclear test ban (see below) have partially failed because of disagreements over on-site inspections needed to distinguish between nuclear explosions and earthquakes; the United States failed to ratify the 1979 Strategic Arms Limitation Talks (SALT) II treaty in part because of fears the Soviets could cheat without being detected.
Verification is intertwined with assessments and fears of noncompliance. Claims and counter-claims of deceit and noncompliance periodically characterize east-west arms control. Fear of cheating produced a characteristic style, sought at least by US negotiators, of highly specific arms control agreements that reduce ambiguity and make it easier to detect compliance and noncompliance (106, 107).
The issue of on-site inspection (OSI) for verification is a perennial arms control issue because, in many cases, it is the best method for assessing compliance (108, 109). Because it is potentially intrusive and therefore potentially useful for military and industrial espionage as well as arms control, OSI has proved difficult to employ. 8 Through the 1970s intrusiveness of arms control verification was very low, with one exception (see below); rather, independent national means–cared national technical means (NTM), a term formally introduced in the SALT I treaty-were the norm. In practice, NTM has never been formally defined, but includes all forms of remote sensing whose platforms do not enter the other country’s territory (e.g. satellites but not aircraft; eavesdropping ships on the high seas but not territorial waters). NTM is not fully independent: the SALT process put limits on the extent to which nations could interfere with each other’s NTM, for example, by encrypting of certain data during missile testing and thus reducing the capacity of NTM to detect violations (107). 9
Recently arms control verification has become more intrusive and less politicized (110), because of improved east-west relations. The 1987 Intermediate Nuclear Forces (INF) agreement and the 1990 Treaty on Conventional Armed Forces in Europe (CFE) provide for on-site inspectors (22, 111). The 1991 Strategic Arms Reduction Talks (START) agreement allows on-site inspections of nuclear missiles, including surprise inspections. The United States has established an On-Site Inspection Agency (OSIA) to conduct inspections and perform other functions under these and other existing and prospective arms control agreements. As an indicator of the salience of arms control verification, OSIA’s budget for implementing INF alone is $522 million (112, 113).
One arms control arrangement–the International Atomic Energy Agency’s (IAEA) nuclear materials accounting-has made longstanding use of on-site inspection. Established in 1957, IAEA was charged with inspecting civilian nuclear power plants to “safeguard” all nuclear materials in participating countries, confirming they were not diverted from peaceful purposes. Under the 1968 nuclear nonproliferation treaty (NPT), IAEA safeguards have been extended to a larger group of nations and nuclear programs (114, 115, 116a). In practice, IAEA negotiates bilateral agreements with each country for each nuclear facility subject to safeguards; those contracts call for both regular and surprise short-notice (24-hour) inspection (117). IAEA safeguards are, by design, supposed to provide high confidence of timely detection of diversion of any significant amount of nuclear materials away from peaceful uses. “Timely” and “significant’” are defined by IAEA according to the material diverted.
IAEA inspections are limited, however, to nuclear facilities described in the bilateral agreements. Inspectors are not free to wander the countryside. IAEA members thought to own or be developing nuclear weapons are doing so outside of the declared facilities rather than diverting materials from the IAEA-monitored fuel cycle. Discovery of a well-advanced Iraqi nuclear weapons program by U.N. inspectors after the most recent Persian Gulf war is widely seen as a failure of safeguards procedures (Iraq was a member of NPT), and has underscored that timely detection of clandestine nuclear programs will require more intrusive inspections. At present, it is unclear (a) whether and to what degree IAEA has authority for more intrusive “special inspections” or whether such authority might be vested in IAEA, (b) whether and how IAEA might employ national intelligence data in its efforts to detect clandestine nuclear programs, and (c) what might be done when such programs are detected (118).
Currently IAEA safeguards apply to approximately 1000 nuclear facilities; a budget of approximately $50 million per year supports several hundred field inspectors and activities related to safeguards. Because IAFA provides equal inspections to all states under NPT, the bulk of IAEA safeguards resources are spent inspecting facilities in industrialized countries, primarily the France, Japan, and the United Kingdom. For comparison, the IAEA safeguards budget is approximately equal to the entire budget of the United Nations Environment Programme. The total IAEA budget is approximately $150 million and includes technical assistance, basic research, and other activities related to promotion of peaceful nuclear power.
LESSONS FROM PRACTICE AND THEORY First, verification can become a salient dimension of international cooperation, so much that agreements that cannot be verified adequately are politically infeasible. Clearly much rests on the definition of “adequate.” Concern about Soviet noncompliance had been so great within the US government that, since 1984, by requirement of Congress, the US President annually reported the status of Soviet compliance with arms control agreements (110).
Second, verification can be divisive. Within the United States, bitter disputes over verification, although a reflection of deeper ideological divisions, may have eroded the prospects for meaningful arms control in the late 1970s and early 1980s, especially because of debates over verifiability of the 1979 SALT II agreement. Disputes over which violations, if any, were significant led to escalating reciprocal charges of possible treaty “breakout,” all of which may have undermined support for international cooperation.
Third, verification is not an end in itself; rather, it should be seen as contributing to one’s overall goals, such as security (119). 10 Thus scholars have long distinguished between detecting important and unimportant violations of arms control agreements. Insofar as verification has contributed to increased confidence in east-west arms control–perhaps evidenced in the increasing stringency of arms control agreements and intrusiveness of verification-then it has probably enhanced the prospects for further arms control and security. Not all arms control contributes to increased security or lower military spending, but increased confidence in meaningful arms control in the past two decades is probably at least partially due to verification activities.
Fourth, the suite of technological and organizational arrangements for arms control verification has other purposes, for example, espionage. Attempts to explain the types of verification demanded in international agreements must consider the constraints and opportunities of these overlapping activities rather than just the more narrow purposes of arms control verification (14, 120, 121).
Fifth, technological change and scientific research programs can enhance the verification process. Research to improve verification techniques can make possible certain types of agreements; for example, research programs undertaken by government research programs to improve the capacity to distinguish earthquakes helped the negotiation of a partial test ban (21). Similarly, technological change in the commercial sector may also offer opportunities for verification and related activities.
ACKNOWLEDGMENTS
The authors gratefully acknowledge the assistance of Wolfgang Fischer and Juan C. Di Primio, and James Broadus, Antonia and Abram Chayes, and Eugene Skolnikoff.
ENDNOTES
1 The success of those agreements was mixed at best, A notable exception, the highly successful 1911 Fur Seal Agreement, is discussed by Lyster (39).
2 As implied above, through the 1960s high levels of compliance reflected that quotas were set high and thus states had to make little or no effort to remain in compliance with their quotas.
3 IUCN has recently changed its name to the World Conservation Union.
4 A developing country is defined as having consumption of CFCs below 0.3 kilograms per capita.
5 NGOs are becoming active in many issue-areas. Particular NGOs have adopted particular issues: for example, IUCN (which has both governmental and nongovernmental members) is active in CITES and Greenpeace is active in whaling. To understand better how and why a particular NGO captures a certain issue one would have to look more closely at the goals and processes within the NGO.
6 For a review of the recent changes to the federal clean air legislation see Ref. 67.
7 As Birnie (37) shows, the IOS was always mentioned at IWC meetings; however, none of the parties seems to have been extremely active in forcing the idea. IOS was also difficult to put into place because of rigidity in the Whaling Convention. Thus, the 18-year delay does not disprove the hypothesis here, though it does weaken it.
8 Additional difficulties in negotiating intrusive arms control verification procedures stem from differences in the degree of openness of societies. Calls for intrusiveness are often surrogates for larger political debates over openness. For example, the United States long pushed for intrusive arms control inspections in part to underscore the closed nature of Soviet society. That US position has become more cautious in its demands for OSI since approximately 1987 because Glasnost, among other achievements, produced greater Soviet willingness to allow intrusive inspections. Faced with negotiating the need for intrusive inspections as an issue in its own right rather than as a surrogate debate, the United States has become less insistent on OSI. Ironically, in some cases such as the chemical weapons treaty currently under negotiation, the United States is now actively opposing some forms of intrusive inspection.
9 The open skies proposals of the 1950s (which resurfaced in the 1980s) would have modified what is now known as NTM by allowing free overflight of enemy territory. This would be useful not only for arms control verification but for other activities that enhance security; for example, open skies would allow easier confirmation that an enemy was not mobilizing and thus decrease skittishness in a crisis. Satellite observation may reduce the need for open skies, but many of the security benefits of open skies remain relevant today.
10 Interestingly, there has been little assessment of the costs of verification and the marginal contribution of spending on verification and spending on other measures that might enhance security. One study of the costs of verification is (113).
LITERATURE CITED
1. Krasner, S. D., ed. 1983. International Regimes. Ithaca: Cornell Univ. Press
2. Haggard, S., Simmons, B. A. 1987. Theories of international regimes. Int. Organ. 41:491-517
3. Young, O. R. 1990. Global environmental change and international governance. Millennium: J. Int. Stud. 3:337-46
4. Keohane, R. O. 1984. After Hegemony: Cooperation and Discord in the World Political Economy. Princeton: Princeton Univ. Press
5. Haas, E. B. 1990. When Knowledge is Power: Three Models of Change in International Organizations. Berkeley: Univ. Calif. Press
6. Nye, J. S. 1987. Nuclear learning and U.S.-Soviet security regimes. Int. Organ. 41:371-402
7. Young, O. R. 1989. The politics of international regime formation: Managing natural resources and the environment. Int. Organ. 43:349-75
8. Kay, D. A., Jacobson, H. K., eds. 1983. Environment Protection: The International Dimension. London: Allenheld Osmun
9. Caldwell, L. K. 1984/1990. International Environmental Policy: Emergence and Dimensions. Durham,NC: Duke Univ. Press
10. Wettestad, J., Andresen, S. 1991. The Effectiveness of International Resource Cooperation: Some Preliminary Findings. R:007-1991. Lysaker, Norway: Fridtjof Nansens Inst.
11. Young, O. R. 1992. The effectiveness of international institutions: Hard cases and critical variables. In Governance without Government: Order and Change in World Politics, ed. J. N. Rosenau, E.-O. Czempiel. New York: Cambridge Univ. Press
12. Haas, P. M., Keohane, R. O., Levy, M. A. forthcoming. Institutions for the Earth: Sources of Effective International Environmental Protection. Cambridge: MIT Press
13. Ostrom, E. 1990. Governing the Commons: The Evolution of Institutions for Collective Action. New York: Cambridge Univ. Press
14. Rowell, W. F. 1986. Arms Control Verification: A Guide to Policy Issues for the 1980s. Cambridge: Ballinger
15. Krepon, M., Umberger, M. 1988. Verification and Compliance: A Problem-Solving Approach. Cambridge: Ballinger
16. Chayes, A. H., Chayes, A. 1990. From law enforcement to dispute settlement: A new approach to arms control verification and compliance. Int. Security 14:147-64
17. Fischer, W. 1991. The Verification of International Conventions on Protection of the Environment and Common Resources: A comparative Analysis of the Instruments and Procedures for International Verification with the Example of Thirteen Conventions. Programmgruppe Technologiefolgenforschung, Forschungszentrum Julich
18. Fischer, W. 1991. The verification of a greenhouse gas convention—a new task for international politics? In Verification Report 1991: Yearbook on Arms Control and Environmental Agreements, ed. J. B. Poole, pp. 197- 206. New York: Apex
19. Gen. Account. Off., US Congress. 1992. International Environment: international Agreements Are Not Well Monitored. GAO/RCED-92-43.
20. United Nations Environ. Prog. (UNEP), 1989. Register of International Treaties and Other Agreements in the Field of the Environment. UNEP/GC.15/Inf.2. Nairobi: UNEP
21. Jacobson, H. K., Stein, E. 1966. Diplomats, Scientists and Politicians: The United States and the Nuclear Test Ban Negotiations. Ann Arbor: Univ. Mich.
22. Arms Control and Disarmament Agency (ACDA), US Dept. State. 1990. Arms Control and Disarmament Agreements: Texts and Histories of the Negotiations. Washington, DC: ACDA
23. Sand, P. 1990. Regional approaches to transboundary air pollution. In Energy: Production, Consumption and Consequences , ed. J. L. Helm. Washington, DC: Natl. Acad. Press
24. Levy, M. forthcoming. European acid rain: The power of toteboard diplomacy. See Ref. 12
25. Lammers, J. G. 1988. The European approach to acid rain. In International Law and Pollution, ed. D. B. Magraw, pp. 265-309. Philadelphia: Univ. Penn.
26. Chossudovsky, E. M. 1988. “East-West” Diplomacy for Environment in the United Nations: The High-Level Meeting within the Framework of the ECE on the Protection of the Environment, A Case Study. United Nations Inst. Train. Res. [UNITAR]. New York: United Nations
27. Boehmer-Christiansen, S., Skea, J. 1991 . Acid Politics: Environmental and Energy Policies in Britain and Germany. New York. Belhaven
28. Benedick, R. E. 1991. Ozone Diplomacy: New Directions in Safeguarding the Planet. Cambridge: Harvard Univ. Press
29. Parson, E. A. forthcoming. Stratospheric ozone and CFCs: The evolution and impact of international institutions. See Ref. 12.
30. M’gonigle, R. M., Zacher, M. W. 1979. Pollution, Politics and International Law: Tankers at Sea. Berkeley: Univ. Calif.
31. Sielen, A. B., McManus, R. J. 1983. IMCO and the Politics of Ship Pollution. See Ref. 8, pp. 140-83
32. Timagenis, G. J. 1980 . International Control of Marine Pollution. Vols. 1, 2. Dobbs Ferry, NY: Oceana
33. Mitchell, R. forthcoming. Intentional oil pollution of the oceans: Crisis, public pressure and structural standards. See Ref. 12.
34. Boxer, B. 1983. The Mediterranean Sea: Preparing and implementing a regional action plan. See Ref. 8, pp. 267-309
35. Haas, P. M. 1990. Saying the Mediterranean: The politics of International Environmental Cooperation. New York: Columbia Univ. Press
36. Haas, P. M. 1992. Save the seas: UNEP’s regional seas programme and the coordination of regional pollution control efforts. In Ocean Yearbook 9, ed. E. M. Borgese, N. Ginsburg, J. A. Morgan, pp. 188-211. Chicago: Univ. Chicago Press
37. Birnie, P. 1985. International Regulation of Whaling: From Conservation of Whaling to Conservation of Whales and Regulation of Whale-Watching. Vols. 1, 2. New York: Oceana
38. McHugh, J. L. 1974. The role and history of the International Whaling Commission. In The Whale Problem, ed. W. E. Scherill, pp. 305-35. Cambridge: Harvard Univ. Press
39. Lyster, S. 1985. International Wildlife Law. Cambridge: Grotius
40. Phillips, C. 1990. What the moratorium means in practice. Marine Policy 14:93-95
41. Andresen, S. 1989. Science and politics in the international management of whales. Marine Policy 13:99-117
41a. Andresen, S. 1989. See Ref. 41, pp. 109-11
42. Auburn, F. M. 1982. Antarctic Law and Politics. Bloomington: Indiana Univ. Press
43. Jorgansen-Dahl A., Ostreng, W., eds. 1991. The Antarctic Treaty System in World Politics. London: Macmillan
44. Peterson, M. J. 1988. Managing the Frozen South: The Creation and Evolution of the Antarctic Treaty System. Berkeley: Univ. Calif.
45. Favre, D. S. 1989. International Trade in Endangered Species. Dordrecht: Martinus Nijhoff
46. Kosloff, L. H., Trexler, M. C. 1987, The convention on international trade in endangered species: No carrot, but where’s the stick? Environ. Law Rep. 17:10222-36
47. Coull, J. R. 1988. The North Sea herring fishery in the twentieth century. In Ocean Yearbook 7, ed. E. M. Borgese, N. Ginsburg, J. R. Morgan, pp. 115-31. Chicago: Univ. Chicago Press
47a. Coull, J. R. 1988. See Ref. 47, pp. 129-30
48. Underdal, A. 1980. The Politics of International Fisheries Management: The Case of the Northeast Atlantic. Oslo: Universitetsforlaget
49. Cowling, E. B. 1982. Acid precipitation in historical Perspective. Environ. Sci. Technol. 16:110A-123A
50. World Meteorol. Organ. (WMO). 1990. Scientific Assessment of Stratospheric Ozone: 1989. 2 vols., Global Ozone Research and Monitoring Project Report 20
51. Boczek, B. A. 1986. The concept of regime and the protection of the marine environment In Ocean Yearbook 6, ed. E. M. Borgese, N. Ginsburg, pp. 271-97. Chicago: Univ. Chicago Press
52. Saetevik, S. 1988. Environmental Cooperation Between the North Sea States: Success or Failure? New York: Bellhaven
53. Andresen, S. 1989. The Environmental North Sea Regime: A successful regional approach. In Ocean Yearbook 8 , ed. E. M. Borgese, N. Ginsburg, J. R. Morgan, pp. 378-401. Chicago: Univ. Chicago Press
54. Freestone, D., Ijlstra, T., eds. 1991. The North Sea: Basic Legal Documents on Regional Environmental Coopera tion. Dordrecht: Graham and Trotman/Martinus Nijhoff
55. Hilz, C., Ehrenfeld, J. R. 1991. Transboundary movements of hazardous wastes: A comparative analysis of the policy options to control the international waste trade. Int. Environ. Affairs 3:26-63
56. McManus, R. J. 1983. Ocean dumping: Standards in action. See Ref. 8, pp. 119-39
57. Bruce, M. 1986. The London dumping convention, 1972: The first decade and future. See Ref. 51, pp. 298-318
58. Birnie, P. 1985. The role of developing countries in nudging the International Whaling Commission from regulating whaling to encouraging nonconsumptive uses of whales. Ecol. Law Q. 12:937-75
58a. Birnie, P. 1985. See Ref. 58, pp. 946-50
59. MeElroy, J. K. 1984. Antarctic fisheries: History and prospects. Marine Policy 8:239-58
60. Bardach, J. E. 1986. Fish far away: Comments on the Antarctic fisheries. See Ref. 51, pp. 38-54
61. Peterson, M. J. forthcoming. International fisheries management. See Ref. 12
62. Farwell, J., Elles, J. 1984. In Search of a Common Fisheries Policy. Brookfield, Vt: Gower
63. Russell, C. S., Harrington, W., Vaughan, W. J. 1986. Enforcing Pollution Control Laws. Washington, DC: Resour. for the Future
64. Magat, W. A., Viscusi, W. K. 1990. Effectiveness of the EPA’s regulatory enforcement: the case of industrial effluent standards. J. Law Econ. 33:331-60
65. Roberts, M. J., Farrell, S. O. 1978. The political economy of implementation: The Clean Air Act and stationary sources. In Approaches to Controlling Air Pollution, ed. A. F. Friedlander. Cambridge: MIT Press
66. Melnick, R. S. 1983. Regulation and the Courts: The Case of the Clean Air Act. Washington, DC: The Brookings Inst.
67. Ferrall, B. L. 1991. The Clean Air Act Amendments of 1990 and the use of market forces to control sulfur dioxide emissions. Harvard J. Regul. 28:235-52
68. Gen. Account. Off., US Congress. 1989. Air Pollution: National Air Monitoring Network is Inadequate. GAO/RCED-90-15
69. Gen. Account. Off., US Congress. 1990. Air Pollution: Improvements Needed in Detecting and Preventing Violations. GAO/RCED-90-155
70. Harrington, W. 1981. The Regulatory Approach to Air Quality Management: A case study of New Mexico. Research Paper R-25, Resour. for the Future, Washington, DC
71. Counc. Environ. Qual. (CEQ). 1990. Environmental Quality. Washington, DC: US Gov. Print. Off.
72. Environ. Protect. Agency (EPA, US). 1990. National Air Quality and Emissions Trends Reports. Off. Air Qual. Plann. Standards, EPA/450/4-90-002
73. Gen. Account. Off., US Congress. 1987. Hazardous Waste: Facility Inspections Are Not Thorough and Complete. GAO/RCED-88-20.
74. Gen. Account. Off., US Congress. 1990. Drinking Water: Compliance Problems Undermine EPA Program as New Challenges Emerge. GAO/RCED-90-127
75. W. K. Viscusi, 1986. The impact of occupational safety and health regulation, 1973-1983. Rand J. Econ. 17: 567-80
76. Camara v. Municipal court of the City and County of San Francisco. 1967. US Supreme Court 387:523-40
77. See v. City of Seattle. 1967. US Supreme Court 387:541-55
78. Air Pollution Variance Board of Colorado v. Western Alfalfa Corp. 1974. US Supreme Court 416:861-66
79. Becker, G. S. 1968. Crime and punishment: An economic approach. J. Polit. Econ. 76:169-217
80. Stigler, G. J. 1970. The optimum enforcement of laws. J. Polit. Econ. 78:526-36
81. Downing, P. B., Watson, W. D. 1974. The economics of enforcing air pollution controls. J. Environ. Econ. Manage. 1: 219-36
82. Storey, D. J., McCabe, P. J. 1980. The criminal waste discharger. Scottish J. Polit. Econ. 27:30-40
83. Harford, J. D. 1978. Firm behavior under imperfectly enforceable pollution standards and taxes. J. Environ. Econ. Manage. 5:26-43
84. Viscusi, W. K., Zeckhauser, R. J. 1979. Optimal standards with incomplete enforcement. Public Policy 27:437-56
85. Beavis, B., Walker, M. 1983. Random wastes, imperfect monitoring and environmental quality standards. J. Public Econ. 21:377-87
86. Russell, C. S. 1990. Monitoring and enforcement. In Public Policies for Environmental Protection, ed. P. R. Portney. Washington, DC: Resour. for the Future
87. Ordeshook, P. C. 1986. Game Theory and Political Theory: An Introduction. New York: Cambridge Univ. Press
88. Stein, A. 1983. Coordination and collaboration: regimes in an anarchic world. See Ref. 1, pp. 115-40
89. Snidal, D. 1985. Coordination versus Prisoners’ Dilemma: Implications for international cooperation and regimes. Am. Polit. Sci. Rev. 79:923-42
90. Oye, K. A. 1986. Explaining cooperation under anarchy: Hypotheses and strategies. In Cooperation Under Anarchy, ed. K. A. Oye, pp. 1-24. Princeton: Princeton Univ. Press
91. Efinger, M., Breitmeier, H. 1991. Verifying a convention on greenhouse gases: A game-theoretic approach. In A Regime to Control Greenhouse Gases: Issues of Verification, Monitoring, Institutions, ed. J. C. Di Primio, G. Stein, pp.59-68. Proc. Workshop, Bad Neuenahr, June 12-14. Forschungszentrum Jülich, Programmgruppe Technologiefolgenforschung
92. Axelrod, R. 1984. The Evolution of Cooperation. New York: Basic Books
93. Putnam, R. D. 1988. Diplomacy and domestic politics: The logic of two-level games. Int. Organ. 42:427-60
94. Wilson, J. Q. 1990. Bureaucracy. New York: Basic Books
95. Krasner, S. D. 1983. Structural causes and regime consequences: regimes as intervening variables. See Ref. 1, pp. 1-21
96. Keohane, R. O., Nye, J. S. 1977/1989. Power and Interdependence. Glenview, Ill: Scott, Foresman. 2nd ed.
97. Keohane, R. O. 1986 Reciprocity in international relations. Int. Organ . 40:1-27
98. Carnegie Comm. Sci., Technol., Gov. 1992. Report of the Task Force on Nongovernmental Organizations. W. D. Carey and C. M. Mathias, chairs. New York: Carnegie Comm.
99. Kratochwil, F. V. 1989. Rules, Norms, and Decisions: On the Conditions of Practical and Legal Reasoning in International Relations and Domestic Affairs. New York: Cambridge Univ. Press
100. Nadelman, E. A. 1990. Global prohibition regimes: the evolution of norms in international society. Int. Organ. 44:479-526
101. Chayes, A., Chayes, A. H., 1991. Adjustment and compliance processes in international regulatory regimes. In Preserving the Global Environment: The Challenge of Shared Leadership, ed.J. T. Mathews. pp. 280-308. New York: Norton
102. Victor, D. G. 1991. Limits of market-based strategies to slow global warming: The case of tradeable permits. Policy Sci. 24:199-222
103. Crawford, A., MacKinnon, G., Hanson, L, Morris, E. 1987. Compendium of Arms Control Verification Proposals. Vols. 1-3. Operational Research and Analysis Establishment, Extramural paper no. 42. Ottawa, Canada: Dept. Natl. Defence
104. Kokowki, R., Koulik, S., eds. 1990. Verification of Conventional Arms Control in Europe: Technological Constraints and Opportunities. Boulder: Westview Press
105. May, M. M., Harvey, J. R. 1987. Nuclear operations and arms control. In Managing Nuclear Operations, ed. A. B. Carter, J. D. Steinbruner, C. A. Zraket, pp. 704-35. Washington, DC: The Brookings Inst.
106. Newhouse, J. 1973. Cold Dawn: The Story of SALT. New York: Holt, Rinehart and Winston
107. Talbott, S. 1979. Endgame: The Inside Story of SALT II. New York: Harper & Row
108. Dunn, L. A. with Gordon, A. E., eds. 1990. Arms Control Verification and the New Role of On-site Inspection. Lexington, Mass: Lexington Books
109. Graybeal, S. N., Krepon, M. 1988. On-site inspections. See Ref. 15, pp. 92-108
110. Lowenthal, M. M. 1991. The politics of verification: What’s new, what’s not. The Washington Q . 14:119-31
111. Kunzendorff, V. 1989. Verification in Conventional Arms Control . Adelphi Papers 245 . London: Brassey’s
112 Gen. Account. Off., US Congress. 1991. Arms Control: Intermediate-Range Nuclear Forces Treaty Implementation. GAO/NSIAD-91-262
113. Congressional Budget Office (CBO), United States Congress. 1990. U.S. Costs of Verification and Compliance under Pending Arms Treaties. Washington, DC: CBO
114. Scheinman, L. 1985. The Nonproliferation role of the International Atomic Energy Agency: A Critical Assessment. Washington, DC: Resour. for the Future
115. Scheinman, L. 1987. The International Atomic Energy Agency and World Nuclear Order. Washington, DC: Resour. for the Future
116. Schroeer, D. 1984. Science, Technology and the Nuclear Arms Race. New York: Wiley
116a. Schroeer, D. 1984. See Ref. 116, chapter 14
117. Fischer. D., Szasz, P. 1985. Safeguarding the Atom: A Critical Appraisal. Stockholm Int. Peace Res. Inst. London: Taylor & Francis
118. Pilat, J. F. 1992. Iraq and the future of nuclear nonproliferation: The roles of inspections and treaties. Science 255: 1224-29
119. Schelling, T. C., Halperin, M. H. 1962/1985 Strategy and Arms Control. Washington, DC: Pergamon-Brassey’s (reissue)
120. Tsipis, K., Hafemeister, D. W., Janeway, P., eds. 1986. Arms Control Verification: The Technologies That Make It Possible. Washington, DC: Pergamon-Brassey’s
121. Off. Technol. Assess. (OTA), US Congress. 1990. Verification Technologies: Measures for Monitoring Compliance with the START Treaty. Summary. Washington, DC: OTA
A note on the population 50 years hence
Maglevs and the Vision of St. Hubert
1. Introduction
The emblems of my essay are maglevs speeding through tunnels below the earth and a crucifix glowing between the antlers of a stag, the vision of St. Hubert. Propelled by magnets, maglev trains levitate passengers with green mobility. Maglevs symbolize technology, while the fellowship of St. Hubert with other animals symbolizes behavior.
Better technology and behavior can do much to spare and restore Nature during the 21st century, even as more numerous humans prosper.
In this essay I explore the areas in human use for fishing, farming, logging, and cities. Offsetting the sprawl of cities, rising yields in farms and forests and changing tastes can spare wide expanses of land. Shifting from hunting seas to farming fish can similarly spare Nature. I will conclude that cardinal resolutions to census marine life, lift crop yields, increase forest area, and tunnel for maglevs would firmly promote the Great Restoration of Nature on land and in the sea. First, let me share the vision of St. Hubert.
2. The Vision of St. Hubert
In The Hague, about the year 1650, a 25 year-old Dutch artist, Paulus Potter, painted a multi-paneled picture that graphically expresses contemporary emotions about the environment.[i] Potter named his picture “The Life of the Hunter” (Figure 1). The upper left panel establishes the message of the picture with reference to the legend of the vision of St. Hubert.[ii] Around the year 700, Hubert, a Frankish courtier, hunted deep in the Ardennes forest on Good Friday, a Christian spring holy day. A stag appeared before Hubert with a crucifix glowing between its antlers, and a heavenly voice reproached him for hunting, particularly on Good Friday. Hubert’s aim faltered, and he renounced his bow and arrow. He also renounced his riches and military honors, and became a priest in Maastricht.
The upper middle panel, in contrast, shows a hunter with two hounds. Seven panels on the sides and bottom show the hunter and his servant hounds targeting other animals: rabbit, wolf, bull, lion, wild boar, bear, and mountain goat. The hunter’s technologies include sword, bow, and guns .
One panel on either side recognizes consciousness, in fact, self-consciousness, in our fellow animals. In the middle on the right, a leopard marvels at its reflection in a mirror. On the lower left apes play with their self-images in a shiny plate.
In the large central panels Potter judges 17th century hunters. First, in the upper panel the man and his hounds come before a court of the animals they have hunted. In the lower central, final panel the animal jury celebrates uproariously, while the wolf, rabbit, and monkey cooperate to hang the hunter’s dogs as an elephant, goat, and bear roast the hunter himself. Paulus Potter believed the stag’s glowing cross converted St. Hubert to sustainability. The hunter remained unreconstructed.
With Paulus and Hubert, we can agree on the vision of a planet teeming with life, a Great Restoration of Nature. And most would agree we need ways to accommodate the billions more humans likely to arrive while simultaneously lifting humanity’s standard of living. In the end, two means exist to achieve the Great Restoration. St. Hubert exemplifies one, behavioral change. The hunter’s primitive weapons hint at the second, technology. What can we expect from each? First, some words about behavior.
3. Our Triune Brain
In a fundamental 1990 book, The Triune Brain in Evolution, neuroscientist Paul MacLean explained that humans have three brains, each developed during a stage of evolution.[iii] The earliest, found in snakes, MacLean calls the reptilian brain (Figure 2). In mammals another brain appeared, the paleomammalian, bringing such new behavior as care of the young and mutual grooming. In humans came the most recent evolutionary structure, the hugely expanded neocortex. This neomammalian brain brought language, visualization, and symbolic skills. But conservative evolution did not replace the reptilian brain, it added. Thus, we share primal behavior with other animals, including snakes. The reptilian brain controls courting mates, patrolling territory, dominating submissives, and flocking together. The reptilian brain makes most of the sensational news and will not retreat. Our brains and thus our basic instincts and behaviors have remained largely unchanged for a million years or more. They will not change on time scales considered for “sustainable development.”
Of course, innovations may occur that control individual and social behavior. Law and religion both try, though the snake brain keeps reasserting itself, on Wall Street, in the Balkans, and clawing for Nobel prizes in Stockholm.
Pharmacology also tries for behavioral control, with increasing success. Having penetrated only perhaps 10% of their global market, sales of new “anti-depressants,” mostly tinkering with serotonin in the brain, neared $10 billion in 2000. Drugs can surely make humans very happy, but without restoring Nature.
Because, I believe, behavioral sanctions will be hard-pressed to control the eight or ten billion snake brains persisting in humanity, we should use our hugely expanded neocortex on technology that allows us to tread lightly on Earth. Since ever, homo faber has been trying to make things better and to make better things. During the past two centuries we have become more systematic and aggressive about it, through the diffusion of research & development and the institutions that perform them, including corporations and universities.
What can behavior and technology do to spare and restore Nature during the 21st century? Let’s consider the seas and then the land.
4. Sparing sea life
St. Hubert exemplifies behavior to spare land’s animals. Many thousands of years ago our ancestors sharpened sticks and began hunting. They probably extinguished a few species, such as woolly mammoths, and had they kept on hunting, they might have extinguished many more. Then without waiting on St Hubert, our ancestors ten thousand years ago began sparing land animals in Nature by domesticating cows, pigs, goats, and sheep. By herding rather than hunting animals, humans began a technology to spare wild animals — on land.
In 2001 about 90 million tons of fish are being taken wild from the sea and 30 from fish farms and ranches. Sadly, little reliable information quantifies the diversity, distribution, and abundance of life in the sea, but many anecdotes suggest large, degrading changes. In any case, the ancient sparing of land animals by farming shows us an effective way to spare the fish in the sea. We need to raise the share we farm and lower the share we catch. Other human activities, such as urbanization of coastlines and tampering with the climate, disturb the seas, but today fishing matters most. Compare an ocean before and after heavy fishing.
Fish farming does not require invention. It has been around for a long time. For centuries, the Chinese have been doing very nicely raising herbivores, such as carp.
Following the Chinese example, one feeds crops grown on land by farmers to herbivorous fish in ponds. Much aquaculture of carp and tilapia in Southeast Asia and the Philippines and of catfish near the Gulf Coast of the USA takes this form. The fish grown in the ponds spare fish from the ocean. Like poultry, fish efficiently convert protein in feed to protein in meat. And because the fish do not have to stand, they convert calories in feed into meat even more efficiently than poultry. All the improvements such as breeding and disease control that have made poultry production more efficient can be and have been applied to aquaculture, improving the conversion of feed to meat and sparing wild fish.[iv] With due care for effluents and pathogens, this model can multiply many times in tonnage.
A riskier and fascinating alternative, ocean farming, would actually lift life in the oceans.[v] The oceans vary vastly in their present productivity. In parts of the ocean crystal clear water enables a person to see 50 meters down. These are deserts. In a few garden areas, where one can see only a meter or so, life abounds. Water rich in iron, phosphorus, trace metals, silica, and nitrate makes these gardens dense with plants and animals. The experiments for marine sequestration of carbon demonstrate the extraordinary leverage of iron to make the oceans bloom.
Adding the right nutrients in the right places might lift fish yields by a factor of hundreds. Challenges abound because the ocean moves and mixes, both vertically and horizontally. Nevertheless, technically and economically promising proposals exist for farming on a large scale in the open ocean with fertilization in deep water. One kg of buoyant fertilizer, mainly iron with some phosphate, could produce a few thousand tons of biomass.[vi]
Improving the fishes’ pasture of marine plants is the crucial first step to greater productivity. Zooplankton then graze on phytoplankton, and the food chain continues until the sea teems with diverse life. Fertilizing 250,000 sq km of barren tropical ocean, the size of the USA state of Colorado, in principle might produce a catch matching today’s fish market of 100 million tons. Colorado spreads less than 1/10th of 1% as wide as the world ocean.
The point is that the today’s depleting harvest of wild fishes and destruction of marine habitat to capture them need not continue. The 25% of seafood already raised by aquaculture signals the potential for Restoration (Figure 3). Following the example of farmers who spare land and wildlife by raising yields on land, we can concentrate our fishing in highly productive, closed systems on land and in a few highly productive ocean farms. Humanity can act to restore the seas, and thus also preserve traditional fishing where communities value it. With smart aquaculture, we can multiply life in the oceans while feeding humanity and restoring Nature. St. Hubert, of course, might improve the marine prospect by not eating fellow creatures from the sea.
5. Sparing farmland
What about sparing nature on land? How much must our farming, logging, and cities take?
First, can we spare land for nature while producing our food? [vii] Yields per hectare measure the productivity of land and the efficiency of land use. For centuries land cropped expanded faster than population, and cropland per person rose as people sought more proteins and calories. Fifty years ago farmers stopped plowing up nature (Figure 4). During the past half-century, ratios of crops to land for the world’s major grains-corn, rice, soybean, and wheat-have climbed fast on all six of the farm continents. Between 1972-1995 Chinese cereal yields rose 3.3% per year per hectare. Per hectare, the global Food Index of the Food and Agriculture Organization of the UN, which reflects both quantity and quality of food, has risen 2.3% annually since 1960. In the USA in 1900 the protein or calories raised on one Iowa hectare fed four people for the year. In 2000 a hectare on the Iowa farm of master grower Mr. Francis Childs could feed eighty people for the year.
Since the middle of the 20th century, such productivity gains have stabilized global cropland, and allowed reductions of cropland in many nations, including China. Meanwhile, growth in the world’s food supply has continued to outpace population, including in poor countries. A cluster of innovations including tractors, seeds, chemicals, and irrigation, joined through timely information flows and better organized markets, raised the yields to feed billions more without clearing new fields. We have decoupled food from acreage.
High-yield agriculture need not tarnish the land. Precision agriculture is the key. This approach to farming relies on technology and information to help the grower prescribe and deliver precise inputs of fertilizer, pesticides, seed, and water exactly where they are needed. We had two revolutions in agriculture in the 20th century. First, the tractors of mechanical engineers saved the oats that horses ate and multiplied the power of labor. Then chemical engineers and plant breeders made more productive plants. The present agricultural revolution comes from information engineers. What do the past and future agricultural revolutions mean for land?
To produce their present crop of wheat, Indian farmers would need to farm more than three times as much land today as they actually do, if their yields had remained at their 1966 level. Let me offer a second comparison: a USA city of 500,000 people in 2000 and a USA city of 500,000 people with the 2000 diet but the yields of 1920. Farming as Americans did 80 years ago while eating as Americans do now would require 4 times as much land for the city, about 450,000 hectares instead of 110,000.
What can we look forward to globally? The agricultural production frontier remains spacious. On the same area, the average world farmer grows only about 20 percent of the corn of the top Iowa farmer, and the average Iowa farmer lags more than 30 years behind the state-of-the-art of his most productive neighbor. On average the world corn farmer has been making the greatest annual percentage improvement. If during the next 60 to 70 years, the world farmer reaches the average yield of today’s USA corn grower, the ten billion people then likely to live on Earth will need only half of today’s cropland. This will happen if farmers maintain on average the yearly 2% worldwide growth per hectare of the Food Index achieved since 1960, in other words, if dynamics, social learning, continues as usual. Even if the rate falls to 1%, an area the size of India, globally, could revert from agriculture to woodland or other uses. Averaging an improvement of 2% per year in the productivity and efficiency of natural resource use may be a useful operational definition of sustainability.
Importantly, as Hubert would note, a vegetarian diet of 3,000 primary calories per day halves the difficulty or doubles the land spared. Hubert might also observe that eating from a salad bar is like taking a sport utility vehicle to a gasoline filling station. Living on crisp lettuce, which offers almost no protein or calories, demands many times the energy of a simple rice-and-beans vegan diet.[viii] Hubert would wonder at the greenhouses of the Benelux countries glowing year round day and night. I will trust more in the technical advance of farmers than in behavioral change by eaters. The snake brain is usually a gourmet and a gourmand.
Fortunately, lifting yields while minimizing environmental fall out, farmers can effect the Great Restoration.
6. Sparing forests
Farmers may no longer pose much threat to nature. What about lumberjacks? As with food, the area of land needed for wood is a multiple of yield and diet, or the intensity of use of wood products in the economy, as well as population and income. Let’s focus on industrial wood — logs cut for lumber, plywood, and pulp for paper.
The wood “diet” required to nourish an economy is determined by the tastes and actions of consumers and by the efficiency with which millers transform virgin wood into useful products.[ix] Changing tastes and technological advances are already lightening pressure on forests. Concrete, steel, and plastics have replaced much of the wood once used in railroad ties, house walls, and flooring. Demand for lumber has become sluggish, and in the last decade world consumption of boards and plywood actually declined. Even the appetite for pulpwood, logs that end as sheets of paper and board, has leveled.
Meanwhile, more efficient lumber and paper milling is already carving more value from the trees we cut.[x] And recycling has helped close leaks in the paper cycle. In 1970, consumers recycled less than one-fifth of their paper; today, the world average is double that.
The wood products industry has learned to increase its revenue while moderating its consumption of trees. Demand for industrial wood, now about 1.5 billion cubic meters per year, has risen only 1% annually since 1960 while the world economy has multiplied at nearly four times that rate. If millers improve their efficiency, manufacturers deliver higher value through the better engineering of wood products, and consumers recycle and replace more, in 2050 virgin demand could be only about 2 billion cubic meters and thus permit reduction in the area of forests cut for lumber and paper.
The permit, as with agriculture, comes from lifting yield. The cubic meters of wood grown per hectare of forest each year provide strong leverage for change. Historically, forestry has been a classic primary industry, as Hubert doubtless saw in the shrinking Ardennes. Like fishers and hunters, foresters have exhausted local resources and then moved on, returning only if trees regenerated on their own. Most of the world’s forests still deliver wood this way, with an average annual yield of perhaps two cubic meters of wood per hectare. If yield remains at that rate, by 2050 lumberjacks will regularly saw nearly half the world’s forests (Figure 5). That is a dismal vision — a chainsaw every other hectare, skinhead Earth.
Lifting yields, however, will spare more forests. Raising average yields 2 percent per year would lift growth over 5 cubic meters per hectare by 2050 and shrink production forests to just about 12 percent of all woodlands. Once again, high yields can afford a Great Restoration.
At likely planting rates, at least one billion cubic meters of wood — half the world’s supply — could come from plantations by the year 2050. Semi-natural forests — for example, those that regenerate naturally but are thinned for higher yield — could supply most of the rest. Small-scale traditional “community forestry” could also deliver a small fraction of industrial wood. Such arrangements, in which forest dwellers, often indigenous peoples, earn revenue from commercial timber, can provide essential protection to woodlands and their inhabitants.
More than a fifth of the world’s virgin wood is already produced from forests with yields above 7 m3 per hectare. Plantations in Brazil, Chile, and New Zealand can sustain yearly growth of more than 20 m3 meters per hectare with pine trees. In Brazil eucalyptus — a hardwood good for some papers — delivers more than 40 m3 per hectare. In the Pacific Northwest and British Columbia, with plentiful rainfall, hybrid poplars deliver 50 m3 per hectare.
Environmentalists worry that industrial plantations will deplete nutrients and water in the soil and produce a vulnerable monoculture of trees where a rich diversity of species should prevail. Meanwhile, advocates for indigenous peoples, who have witnessed the harm caused by crude industrial logging of natural forests, warn that plantations will dislocate forest dwellers and upset local economies. Pressure from these groups helps explain why the best practices in plantation forestry now stress the protection of environmental quality and human rights. As with most innovations, achieving the promise of high-yield forestry will require feedback from a watchful public.
The main benefit of the new approach to forests will reside in the natural habitat spared by more efficient forestry. An industry that draws from planted forests rather than cutting from the wild will disturb only one-fifth or less of the area for the same volume of wood. Instead of logging half the world’s forests, humanity can leave almost 90 % of them minimally disturbed. And nearly all new tree plantations are established on abandoned croplands, which are already abundant and accessible. Although the technology of forestry rather than the behavior of hunters spared the forests and stags, Hubert would still be pleased.
7. Sparing pavement
What then are the areas of land that may be built upon? One of the most basic human instincts, from the snake brain, is territorial. Territorial animals strive for territory. Maximizing range means maximizing access to resources. Most of human history is a bloody testimony to the instinct to maximize range. For humans, a large accessible territory means greater liberty in choosing the points of gravity of our lives: the home and the workplace.
Around 1800, new machines began transporting people faster and faster, gobbling up the kilometers and revolutionizing territorial organization.[xi] The highly successful machines are few—train, motor vehicle, and plane—and their diffusion slow. Each has taken from 50 to 100 years to saturate its niche. Each machine progressively stretches the distance traveled daily beyond the 5 km of mobility on foot. Collectively, their outcome is a steady increase in mobility. For example, in France, from 1800 to today, mobility has extended an average of more than 3% per year, doubling about every 25 years. Mobility is constrained by two invariant budgets, one for money and one for time. Humans always spend an average 12-15% of their income for travel. And the snake brain makes us visit our territory for about one hour each day, the travel time budget. Hubert doubtless averaged about one hour of walking per day.
The essence is that the transport system and the number of people basically determine covered land.[xii] Greater wealth enables people to buy higher speed, and when transit quickens, cities spread. Both average wealth and numbers will grow, so cities will take more land.
The USA is a country with a fast growing population, and expects about another 100 million people over the next century. Californians pave or build on about 600 m2 each. At the California rate, the USA increase would consume 6 million hectares, about the combined land area of the Netherlands and Belgium. Globally, if everyone new builds at the present California rate, 4 billion added to today’s 6 billion people would cover about 240 million hectares, midway in size between Mexico and Argentina.
Towering higher, urbanites could spare even more land for nature. In fact, migration from the country to the city formed the long prologue to the Great Restoration. Still, cities will take from nature.
But, to compensate, we can move much of our transit underground, so we need not further tar the landscape. The magnetically levitated train, or maglev, a container without wings, without motors, without combustibles aboard, suspended and propelled by magnetic fields generated in a sort of guard rail, nears readiness (Figure 6). A route from the airport of Shanghai to the city center will soon open. If one puts the maglev underground in a low pressure or vacuum tube, as the Swiss think of doing with their Swissmetro, then we would have the equivalent of a plane that flies at high altitude with few limitations on speed. The Swiss maglev plan links all Swiss cities in 10 minutes.[xiii]
Maglevs in low pressure tubes can be ten times as energy efficient as present transport systems. In fact, they need consume almost no net energy. Had Hubert crossed the USA in 1850 to San Francisco from St. Louis on the Overland Stage, he would have exhausted 2700 fresh horses.
Future human settlements could grow around a maglev station with an area of about 1 km2 and 100,000 inhabitants, be largely pedestrian, and via the maglev form part of a network of city services within walking distance. The quarters could be surrounded by green land. In fact, cities please people, especially those that have grown naturally without suffering the sadism of architects and urban planners.
Technology already holds green mobility in store for us. Naturally maglevs want 100 years to diffuse, like the train, auto, or plane. With maglevs, together with personal vehicles and airplanes operating on hydrogen, Hubert could range hundreds of kilometers daily for his ministry, fulfilling the urges of his reptilian brain, while leaving the land and air pristine.
8. Cardinal Resolutions
How can the Great Restoration of Nature I envision be accomplished? Hubert became only a Bishop, but in his honor, I propose we promote four cardinal resolutions, one each for fish, farms, forests, and transport.
Resolution one: The stakeholders in the oceans, including the scientific community, shall conduct a worldwide Census of Marine Life between now and the year 2010. Some of us already are trying.[xiv] The purpose of the Census is to assess and explain the diversity, distribution, and abundance of marine life. This Census can mark the start of the Great Restoration for marine life, helping us move from uncertain anecdotes to reliable quantities. The Census of Marine Life can provide the impetus and foundation for a vast expansion of marine protected areas and wiser management of life in the sea.
Resolution two: The many partners in the farming enterprise shall continue to lift yields per hectare by 2% per year throughout the 21st century. Science and technology can double and redouble yields and thus spare hundreds of millions of hectares for Nature. We should also be mindful that our diets, that is, behavior, can affect land needed for farming by a factor of two.
Resolution three: Foresters, millers, and consumers shall work together to increase global forest area by 10%, about 300 million hectares, by 2050. Furthermore, we will concentrate logging on about 10% of forest land. Behavior can moderate demand for wood products, and foresters can make trees that speedily meet that demand, minimizing the forest we disturb. Curiously, neither the diplomacy nor science about carbon and greenhouse warming has yet offered a visionary global target or timetable for land use.[xv]
Resolution four: The major cities of the world shall start digging tunnels for maglevs. While cities will sprawl, our transport need not pave paradise or pollute the air. Although our snake brains and the instinct to travel will still determine travel behavior, maglevs can zoom underground, sparing green landscape.
Clearly, to realize our vision we shall need both maglevs and the vision of St. Hubert. Simply promoting the gentle values of St. Hubert is not enough. Soon after he painted his masterpiece, Paulus Potter died of tuberculosis and was buried in Amsterdam on 7 January 1654 at the age of 29. In fact, Potter suffered poor engineering. Observe in The Life of the Hunter that the branch of the tree from which the dogs hang does not bend.
Because we are already more than 6 billion and heading for 10 in the new century, we already have a Faustian bargain with technology. Having come this far with technology, we have no road back. If Indian wheat farmers allow yields to fall to the level of 1960, to sustain the present harvest they would need to clear nearly 50 million hectares, about the area of Madhya Pradesh or Spain.
So, we must engage the elements of human society that impel us toward fish farms, landless agriculture, productive timber, and green mobility. And we must not be fooled into thinking that the talk of politicians and diplomats will achieve our goals. The maglev engineers and farmers and foresters are the authentic movers, aided by science. Still, a helpful step is to lock the vision of the Great Restoration in our minds and make our cardinal resolutions for fish, farms, forests, and transport. In the 21st century, we have both the glowing vision of St. Hubert and the technology exemplified by maglevs to realize the Great Restoration of Nature.
Acknowledgements: Georgia Healey, Cesare Marchetti, Perrin Meyer, David Victor, Iddo Wernick, Paul Waggoner, and especially Diana Wolff-Albers for introducing me to Paulus Potter.
Figures

Figure 1. The Life of the Hunter by Paulus Potter. The painting hangs in the museum of the Hermitage, St. Petersburg.
Figure 2. Symbolic representation of the triune brain. Source: P. D. MacLean, 1990.
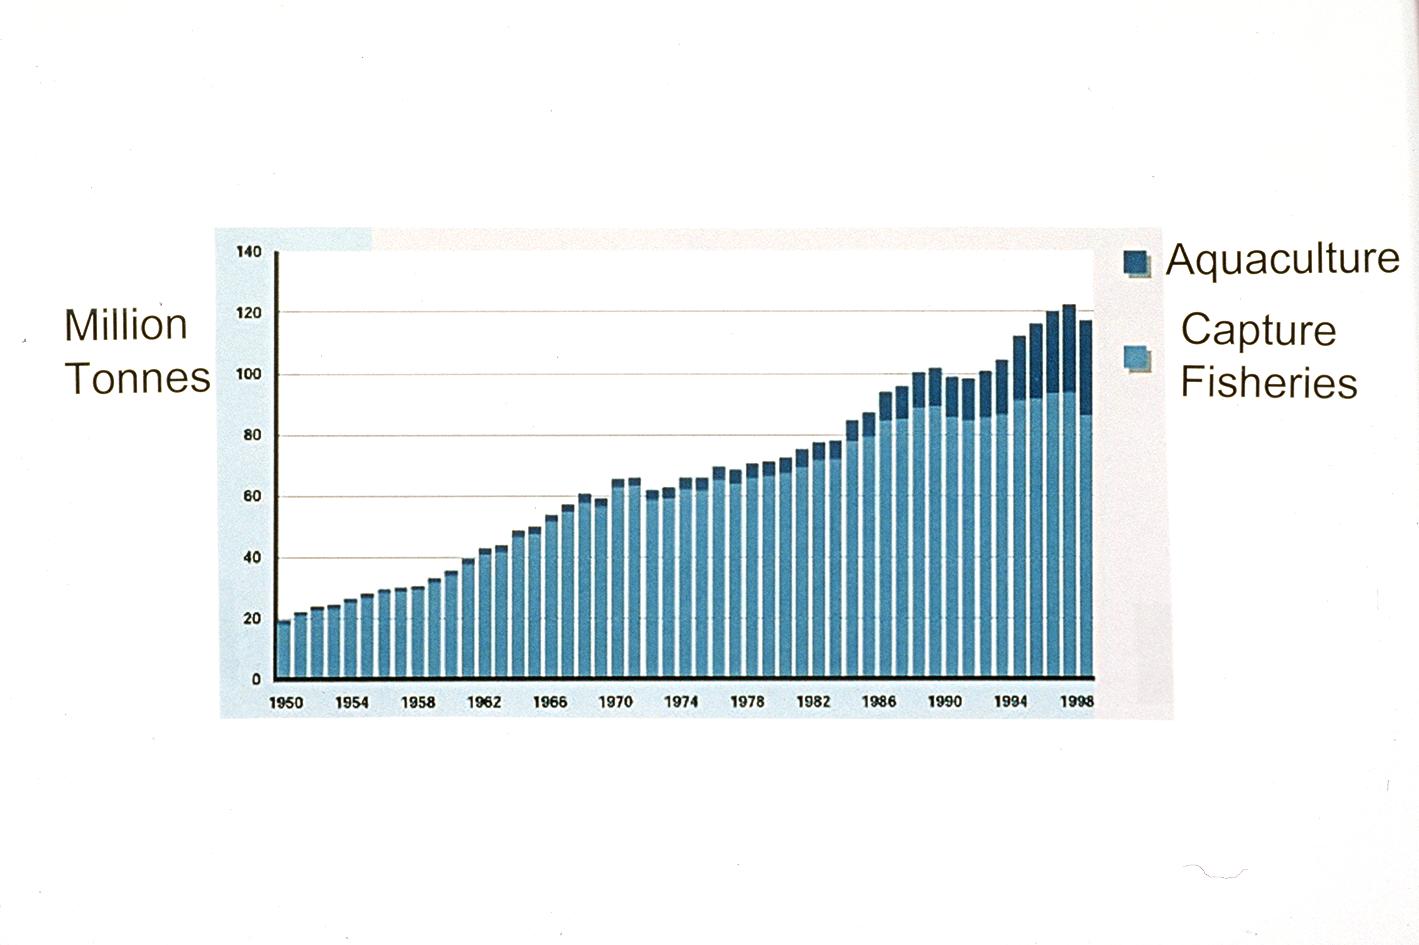
Figure 3. World capture fisheries and aquaculture production. Note the rising amount and share of aquaculture. Source: Food and Agriculture Organization of the UN, The state of world fisheries and aquaculture 2000, Rome. https://www.fao.org/DOCREP/003/X8002E/X8002E00.htm
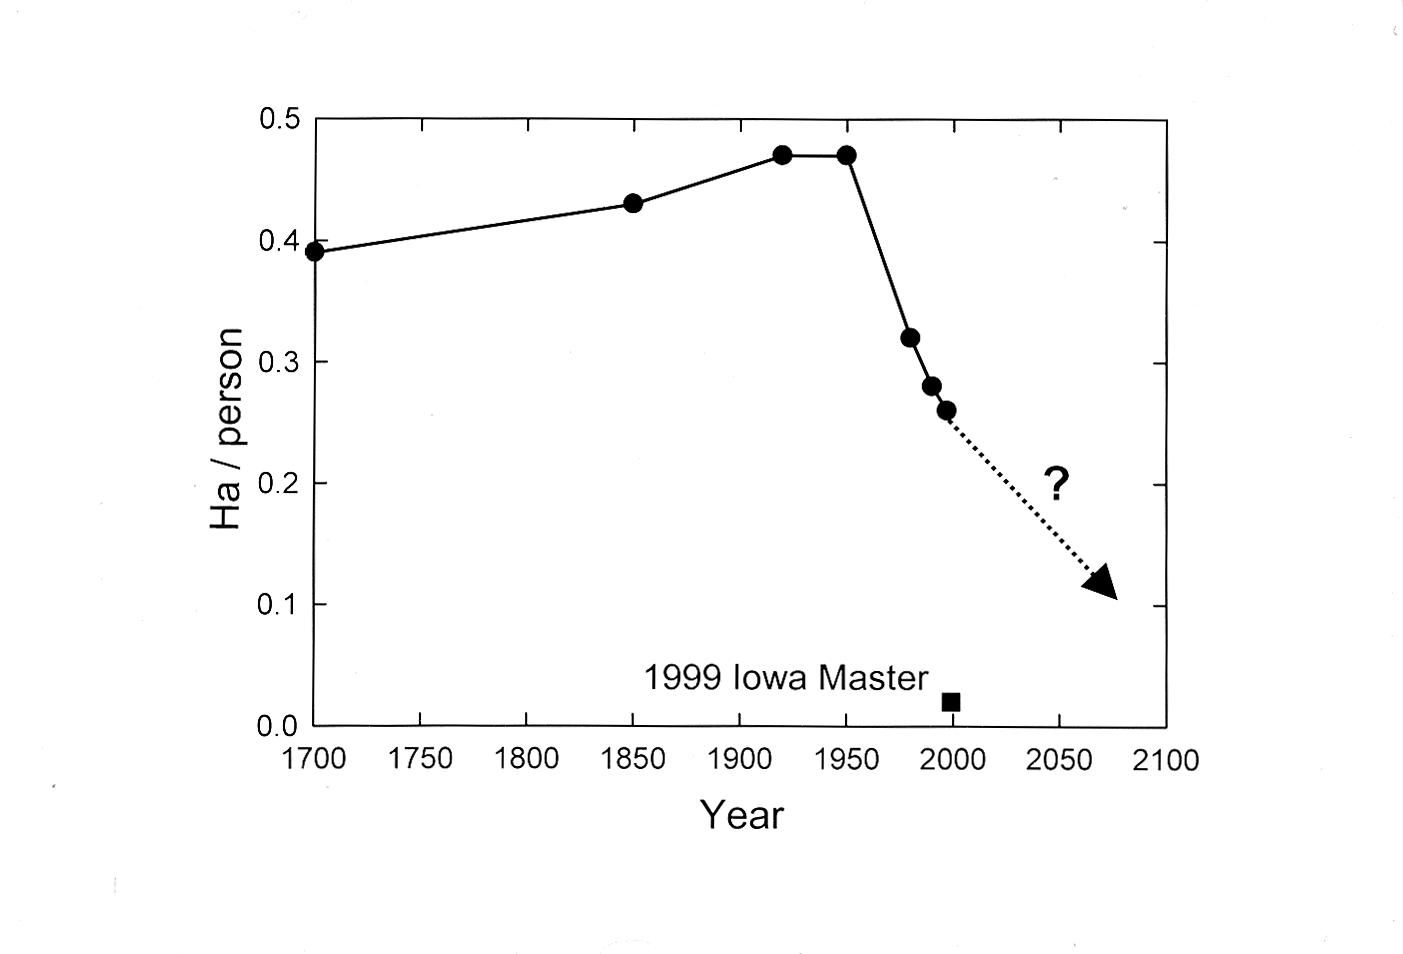
Figure 4. Reversal in area of land used to feed a person. After gradually increasing for centuries, the worldwide area of cropland per person began dropping steeply in about 1950, when yields per hectare began to climb. The square shows the area needed by the Iowa Master Corn Grower of 1999 to supply one person a year’s worth of calories. The dotted line shows how sustaining the lifting of average yields 2 percent per year extends the reversal. Sources of data: Food and Agriculture Organization of the United Nations, various Yearbooks. National Corn Growers Association, National Corngrowers Association Announces 1999 Corn Yield Contest Winners, Hot Off the Cob, St. Louis MO, 15 December 1999; J. F. Richards, 1990, “Land Transformations,” in The Earth as Transformed by Human Action, B. L. Turner II et al. eds., Cambridge University: Cambridge, UK.
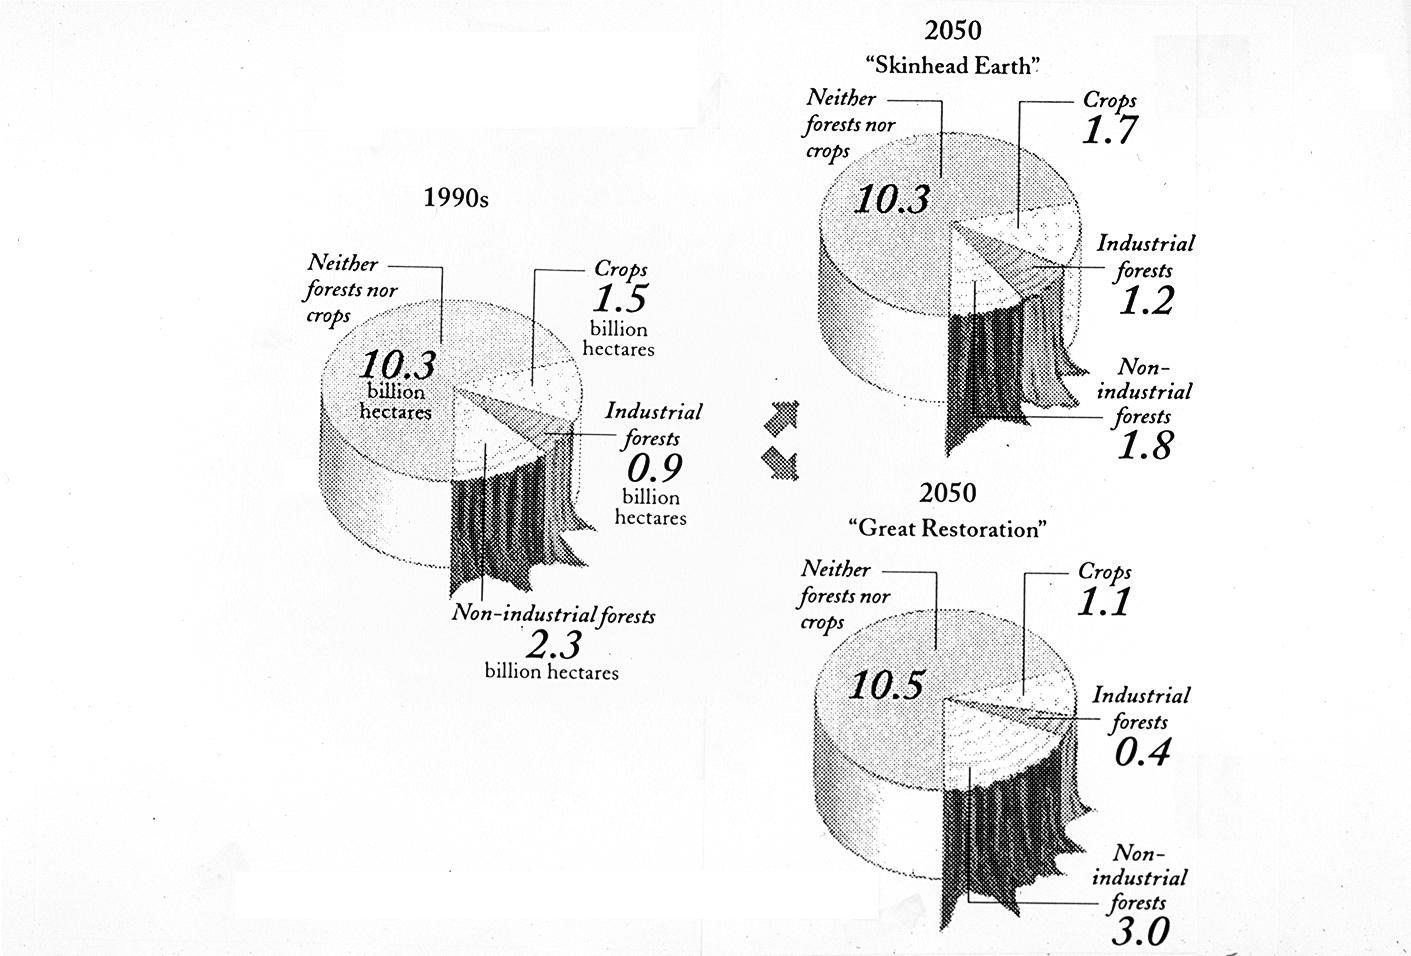
Figure 5. Present and projected land use and land cover. Today’s 2.4 billion hectares used for crops and industrial forests spread on “Skinhead Earth” to 2.9 while in the “Great Restoration” they contract to 1.5. Source: D. G. Victor and J. H. Ausubel, Restoring the Forests, Foreign Affairs 79(6): 127-144, 2000.
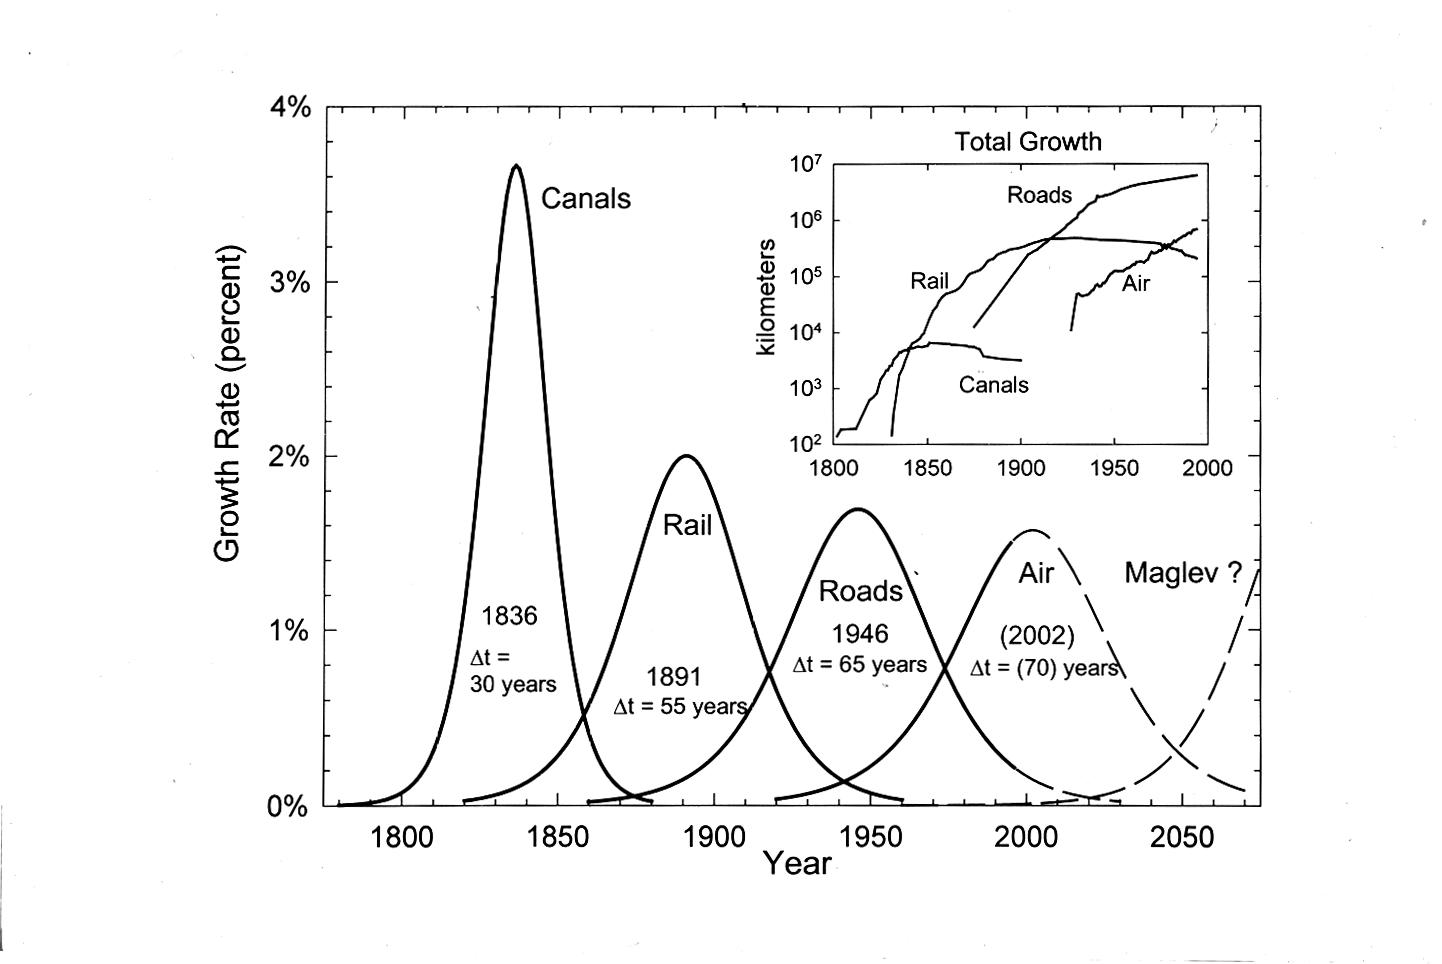
Figure 6. Smoothed historic rates of growth (solid lines) of the major components of the US transport infrastructure and conjectures (dashed lines) based on constant dynamics. Rhythm evokes a new entrant now, maglevs. The inset shows the actual growth, which eventually became negative for canals and rail as routes were closed. Delta t is the time for the system to grow from 10% to 90% of its extent. Source: Toward Green Mobility: The Evolution of Transport, J. H. Ausubel, C. Marchetti, and P. S. Meyer, European Review 6(2): 137-156 (1998).
References and Notes
[i] A. Walsh, E. Buijsen, and B. Broos, Paulus Potter: Schilderijen, tekeningen en etsen, Waanders, Zwolle, 1994.
[ii] The upper right panel shows Diana and Acteon, from the Metamorphosis of the Roman poet Ovid. Acteon, a hunter, was walking in the forest one day after a successful hunt and intruded in a sacred grove where Diana, the virgin goddess, bathed in a pond. Suddenly, in view of Diana, Acteon became inflamed with love for her. He was changed into a deer, from the hunter to what he hunted. As such, he was killed by his own dogs. This panel was painted by a colleague of Potter.
[iii] P. D. MacLean, The Triune Brain in Evolution: Role in Paleocerebral Functions, Plenum, New York, 1990.
[iv] In some fish ranching, notably most of today’s ranching of salmon, the salmon effectively graze the oceans, as the razorback hogs of a primitive farmer would graze the oak woods. Such aquaculture consists of catching wild “junk” fish or their oil to feed to our herds, such as salmon in pens. We change the form of the fish, adding economic value, but do not address the fundamental question of the tons of stocks. A shift from this ocean ranching and grazing to true farming of parts of the ocean can spare others from the present, on-going depletion.
[v] J. H. Ausubel, The Great Reversal: Nature’s Chance to Restore Land and Sea, Technology in Society 22(3):289-302, 2000; M. Markels, Jr., Method of improving production of seafood. US Patent 5,433,173, July 18, 1995, Washington DC.
[vi] Along with its iron supplement, such an ocean farm would annually require about 4 million tons of nitrogen fertilizer, 1/20th of the synthetic fertilizers used by all land farms.
[vii] P. E. Waggoner and J. H. Ausubel, How Much Will Feeding More and Wealthier People Encroach on Nature? Population and Development Review 27(2):239-257, 200.
[viii] G. Leach, Energy and Food Production, IPC Science and Technology Press, Guildford UK, 1976, quantifies the energy costs of a range of food systems.
[ix] I. K. Wernick, P. E. Waggoner, and J. H. Ausubel, Searching for Leverage to Conserve Forests: The Industrial Ecology of Wood Products in the U.S., Journal of Industrial Ecology 1(3):125-145, 1997.
[x] In the United States, for example, leftovers from lumber mills account for more than a third of the wood chips turned into pulp and paper; what is still left after that is burned for power.
[xi] J. H. Ausubel, C. Marchetti, and P. S. Meyer, Toward Green Mobility: The Evolution of Transport, European Review 6(2):143-162, 1998.
[xii] P. E. Waggoner, J. H. Ausubel, I. K. Wernick, Lightening the Tread of Population on the Land: American Examples, Population and Development Review 22(3):531-545, 1996.
[xiii] www.swissmetro.com
[xiv] J. H. Ausubel, The Census of Marine Life: Progress and Prospects, Fisheries 26 (7): 33-36, 2001.
[xv] D. G. Victor and J. H. Ausubel, Restoring the Forests, Foreign Affairs 79(6): 127-144, 2000.
We must make nature worthless
Because the Brain Does Not Change, Technology Must
This paper was originally published by the American Association of Engineering Societies (Washington D.C.), in a report “Production Efficiencies: The Engineers’ Report,” pp. 14-18, 1999.
It was republished in: IEEE Aerospace and Electronic SYSTEMS 14(10):3-6, October 1999.
The paper is based on a talk Jesse gave at the UN Commission on Sustainable Development meetings in New York in April 1999.
(Note: The figures are at the end of this document for easier online reading.)
My message is my title: Because the Human Brain Does Not Change, Technology Must. That is, technology must change, must improve, to accommodate billions more people and to lift the standard of living. Engineers, receiving feedback from the market and regulated wisely in the public interest, do much of the improving. Thus, the chance for improving Earth’s environment hinges on engineers, and therefore their social context and technical vision. [1]
First I will explain what I mean by the unchanging human brain. Then I will exemplify technical change in energy and agriculture in the cardinal directions it must go.
The Triune Brain
In a remarkable 1990 book, The Triune Brain in Evolution , neuroscientist Paul MacLean explained that humans have three brains, each developed during a stage of evolution. [2] The earliest, found in reptiles, MacLean calls the snake brain. In mammals another brain appeared, the paleomammalian, with new particular behavior, for example, care of the young and mutual grooming. In humans came the most recent evolutionary structure, the hugely expanded neocortex. This neomammalian brain enabled language, visualization, and symbolic skills. But economical evolution did not replace the reptilian brain, it added. Thus, we share primal patterns of behavior with other animals, just as they share those brain structures. The snake brain controls courtship, patrolling of territory (including our daily 75-minute travel budget), displays of dominance and submission, and flocking. And makes most of the sensational news.
Our brains and thus our basic instincts and behaviors have remained unchanged for a million years or more. They will not change on time scales considered for “sustainable development.”
Of course, innovations may occur that control individual and social behavior. Law and religion both try, though the snake brain keeps reasserting itself, in crime and in punishment. Pharmacology also tries, with increasing success. Sales of new “anti-depressants,” mostly tinkering with serotonin in the brain, are about $10 billion in 1999, having penetrated only perhaps 10% of their global market.
Because, it seems to me, these forms of social control are unreliable, we should emphasis our greatest success, bettering technique. Since ever, homo faber has been trying to make things better and to make better things. During the past two centuries we have become more systematic and aggressive about it, through the diffusion of research & development and the institutions that perform them, including corporations and universities.
Let me now focus on two cardinal directions for technique, for engineering, decarbonization of energy and landless agriculture.
Decarbonization
Carbon matters because it burns; combustion releases energy. But burnt carbon in local places can cause smog and in very large amounts can change the global climate. Raw carbon blackens miners’ lungs and escapes from containers to form spills and slicks. Carbon enters the energy economy in the hydrocarbon fuels, coal, oil, and gas, as well as wood. In fact, the truly desirable element in these fuels for energy generation is not their carbon (C) but their hydrogen (H).
Wood is made of much cellulose and some lignin. Heated cellulose leaves charcoal, almost pure carbon. Lignin has a complex benzenic structure with an H:C ratio of about 0.5. Combining the pure carbon of cellulose and the 0.5 ratio of lignin, wood with 20% lignin effectively has an H:C ratio of 0.1. Said differently, wood weighs in heavily at ten effective Cs for each H. Coal approaches parity with one or two Cs per H, while oil improves to two H per C, and a molecule of natural gas (methane) is a carbon-trim CH 4.
The most important single finding from thirty years of energy studies is that that for two hundred years the world has progressively lightened its energy diet by favoring hydrogen atoms over carbon in our hydrocarbon stew (Figure 1). We will and must continue to do so. The increasing density of end-use of energy in cities finally accepts only natural gas, hydrogen, and electricity. Office buildings and homes reject smoking coals or hay.
The spectrum of national achievements also shows how far most of the world economy is from best practice in decarbonization. The present carbon intensity of the Chinese and Indian economies resembles those of America and Europe at the onset of industrialization in the nineteenth century.
Engineers must foster the unrelenting though slow ascendance of hydrogen in the energy market. We must squeeze most of the carbon out of the energy system and move, via natural gas, to a hydrogen economy. Hydrogen, fortunately, is the immaterial material. It can be manufactured from something abundant, namely water; it can substitute for most fuels; and its combustion to water vapor does not pollute.
Part of economizing on carbon is economizing on energy more broadly. Widgets work better than behavior modifications. The snake brain resists the carpool but grabs a lighter laptop. Fortunately, efficiency has been gaining in the generation of energy, in its transmission and distribution, and in the innumerable devices that finally consume energy (Figure 2). In fact, the struggle to make the most of our fires dates back at least 750,000 years to the ancient hearths of the Escale cave near Marseilles. A good stove did not emerge until 1744 CE. Benjamin Franklin’s invention proved to be a momentous event for the forests and wood piles of America. The Franklin stove greatly reduced the amount of fuel required. Its widespread diffusion took a hundred years, however, because the American colonials were poor, development of manufactures sluggish, and iron scarce.
Looking globally in 1999, nothing in the energy game has changed, only now the stakes are higher. But we should be encouraged by our inventiveness with the performance of motors and lights. For the next couple of decades, the context indicates that priority and profit will come to those who build a highly efficient methane economy, the next stage of decarbonization.
Landless agriculture
As we must spare carbon while producing our energy, so must we spare land for nature while producing our food. Earth cannot sustain humans if it sustains humans alone. The direction, inevitably, is landless agriculture.
Yields per hectare measure the productivity of land and the efficiency of land use. During the past half-century, ratios of crops to land for the world’s major grains-corn, rice, soybean, and wheat-have climbed fast on all six of the farm continents. Per hectare, world grain yields rose about two percent annually since 1960. The productivity gains have stabilized global cropland since mid-century, mitigating pressure for deforestation in all nations and allowing forests to spread again in many. A cluster of innovations including tractors, seeds, chemicals, and irrigation, joined through timely information flows and better organized markets, raised the yields to feed billions more without clearing new fields.
Fortunately, as Figure 3 shows, the agricultural production frontier remains spacious. On the same area, the average world farmer grows only about 20 percent of the corn of the top Iowa farmer, and the average Iowa farmer lags more than 30 years behind the state-of-the-art of his most productive neighbor. On average the world corn farmer has been making the greatest annual percentage improvement.
High-yield agriculture need not tarnish the land. The key is precision agriculture . This approach to farming relies on technology and information to help the grower use precise amounts of inputs-fertilizer, pesticides, seed, water—exactly where they are needed. Precision agriculture includes grid soil sampling, field mapping, variable rate application, and yield monitoring—tied to global positioning systems. It helps the grower lower costs and improve yields in an environmentally responsible manner. Ohio farmers recently reported using one-third less lime after putting fields on square-foot satellite grids detailing areas that would benefit from fertilizer.
We have had two revolutions in agriculture in this century. The first came from mechanical engineers. The second came from chemical engineers. The next agricultural revolution will come from information engineers, physical and genetic. What do the past and future agricultural revolutions mean for land?
For centuries land cropped expanded faster than population, and cropland per person rose (Figure 4). Fifty years ago farmers stopped plowing up nature. Meanwhile, growth in calories in the world’s food supply has continued to outpace population, especially in poor countries. To produce their present crop of wheat, Indian farmers would need to farm more than three times as much land today as they actually do, if their yields had remained at their 1966 level. By raising yields, Indian wheat farmers have spared nearly 50 million hectares, about the area of Madhya Pradesh or Spain. Let me offer a second comparison: a USA city of 500,000 people in 1994 and a USA city of 500,000 people with the 1994 diet and the yields of 1920. Farming as Americans did 75 years ago while eating as Americans do now would require 4 times as much land for the city, about 450,000 hectares instead of 110,000.
What can we look forward to globally? If during the next 60 to 70 years, the world farmer reaches the average yield of today’s USA corn grower, the ten billion people then likely to live on Earth will need only half of today’s cropland. This will happen if farmers maintain on average the yearly 2% worldwide yield growth of grains achieved since 1960, in other words, if dynamics, social learning, continues as usual. Even if the rate falls in half, an area the size of India, globally, will revert from agriculture to woodland or other uses.
Importantly, a vegetarian diet of 3,000 primary calories per day halves the difficulty or doubles the land spared. However, I trust more in the technical advance of farmers than in behavioral change by eaters.
So the challenge for the next decades in agriculture remains clear: lift yields while minimizing environmental fall out. Use less land.
And lift inhibitions on the imaginations of our food engineers. Let me offer a shocking idea to show how high we might raise limits. Going back to basics on food, we depend on the hydrogen produced by the chlorophyll of plants. With hydrogen, produced by nuclear power plants, for example, a plethora of micro-organisms can cook up the variety of substances in our diet. For decades, microbiologists have produced food by cultivating hydrogenomonas on a diet of H 2, CO 2, and a little O 2. They make nice proteins that taste like hazelnut. A person consumes around 100 watts. A current nuclear power plant has a power of a couple of gigawatts, enough to supply food for a few million people, on perhaps 1000 hectares for the Power Park. So, the nuclear plant can feed 2000 people per hectare. Iowa’s master corn growers feed about 80. So, WITH CURRENT TECHNOLOGY, we can do 25 times better than the best Iowa corn field. And finally decouple food and land.
Conclusion
If behavior and technology do not change, more numerous humans will trample the earth and endanger our own survival. The snake brain in each of us makes me cautious about relying heavily on changes in behavior. In contrast, centuries of extraordinary technical progress give me great confidence that diffusion of our best practices and continuing innovation can advance us much further in decarbonization, landless agriculture, and other cardinal directions for a prosperous, green environment. For engineers and others in the technical enterprise the urgency and prizes for sustaining their contributions could not be higher. Because the human brain does not change, technology must.
Acknowledgement: Thanks to Perrin Meyer for assistance.
Figure 1: World primary energy sources have declined in carbon intensity since 1860. The evolution is seen in the ratio of hydrogen (H) to carbon (C) in the world fuel mix, graphed on a logarithmic scale, analyzed as a logistic growth process and plotted in the linear transform of the logistic (S) curve. Progression of the ratio above natural gas (methane, CH 4) requires production of large amounts of hydrogen fuel with non-fossil energy.
Figure 2: Energy efficiency is a term of modern invention, but the efficiency of energy conversion devices has been increasing for hundreds and probably thousands of years. Improvements in motors and lamps are analyzed here in the linear transform of the logistic (S-shaped) growth process.
Figure 3: The trends of maize yields grown by the winners of the Iowa Master Corn Growers Contest and of average yields of Iowa, World, and Brazilian farmers, and the average annual rise since 1960.
Figure 4: The average cropland per person since about the year 1700. The star shows the small amount of land required by an Iowa Master corn grower to produce the calories needed to sustain a person for a year.
Endnotes:
[1] Technical information and sources for the text and figures are found in papers on-line at phe.rockefeller.edu See, for example, “The Liberation of the Environment,” Jesse H. Ausubel; “Lightening the Tread of Population on the Land: American Examples,” Paul E. Waggoner, Jesse H. Ausubel, and Iddo K. Wernick; and “Energy and Environment: The Light Path,” Jesse H. Ausubel.
[2] Paul D. MacLean, The Triune Brain in Evolution: Role in Paleocerebral Functions, Plenum, New York, 1990.