Area of Research: Technology & Human Environment
Environmental Populism
On September 23, 2019 PHE Senior Research Associate Iddo Wernick delivered at talk on ‘Environmentalism and Populism‘ at at meeting of the Breakthrough Institute in Middleburg, Virginia.
A note on the population 50 years hence
Maglevs and the Vision of St. Hubert
1. Introduction
The emblems of my essay are maglevs speeding through tunnels below the earth and a crucifix glowing between the antlers of a stag, the vision of St. Hubert. Propelled by magnets, maglev trains levitate passengers with green mobility. Maglevs symbolize technology, while the fellowship of St. Hubert with other animals symbolizes behavior.
Better technology and behavior can do much to spare and restore Nature during the 21st century, even as more numerous humans prosper.
In this essay I explore the areas in human use for fishing, farming, logging, and cities. Offsetting the sprawl of cities, rising yields in farms and forests and changing tastes can spare wide expanses of land. Shifting from hunting seas to farming fish can similarly spare Nature. I will conclude that cardinal resolutions to census marine life, lift crop yields, increase forest area, and tunnel for maglevs would firmly promote the Great Restoration of Nature on land and in the sea. First, let me share the vision of St. Hubert.
2. The Vision of St. Hubert
In The Hague, about the year 1650, a 25 year-old Dutch artist, Paulus Potter, painted a multi-paneled picture that graphically expresses contemporary emotions about the environment.[i] Potter named his picture “The Life of the Hunter” (Figure 1). The upper left panel establishes the message of the picture with reference to the legend of the vision of St. Hubert.[ii] Around the year 700, Hubert, a Frankish courtier, hunted deep in the Ardennes forest on Good Friday, a Christian spring holy day. A stag appeared before Hubert with a crucifix glowing between its antlers, and a heavenly voice reproached him for hunting, particularly on Good Friday. Hubert’s aim faltered, and he renounced his bow and arrow. He also renounced his riches and military honors, and became a priest in Maastricht.
The upper middle panel, in contrast, shows a hunter with two hounds. Seven panels on the sides and bottom show the hunter and his servant hounds targeting other animals: rabbit, wolf, bull, lion, wild boar, bear, and mountain goat. The hunter’s technologies include sword, bow, and guns .
One panel on either side recognizes consciousness, in fact, self-consciousness, in our fellow animals. In the middle on the right, a leopard marvels at its reflection in a mirror. On the lower left apes play with their self-images in a shiny plate.
In the large central panels Potter judges 17th century hunters. First, in the upper panel the man and his hounds come before a court of the animals they have hunted. In the lower central, final panel the animal jury celebrates uproariously, while the wolf, rabbit, and monkey cooperate to hang the hunter’s dogs as an elephant, goat, and bear roast the hunter himself. Paulus Potter believed the stag’s glowing cross converted St. Hubert to sustainability. The hunter remained unreconstructed.
With Paulus and Hubert, we can agree on the vision of a planet teeming with life, a Great Restoration of Nature. And most would agree we need ways to accommodate the billions more humans likely to arrive while simultaneously lifting humanity’s standard of living. In the end, two means exist to achieve the Great Restoration. St. Hubert exemplifies one, behavioral change. The hunter’s primitive weapons hint at the second, technology. What can we expect from each? First, some words about behavior.
3. Our Triune Brain
In a fundamental 1990 book, The Triune Brain in Evolution, neuroscientist Paul MacLean explained that humans have three brains, each developed during a stage of evolution.[iii] The earliest, found in snakes, MacLean calls the reptilian brain (Figure 2). In mammals another brain appeared, the paleomammalian, bringing such new behavior as care of the young and mutual grooming. In humans came the most recent evolutionary structure, the hugely expanded neocortex. This neomammalian brain brought language, visualization, and symbolic skills. But conservative evolution did not replace the reptilian brain, it added. Thus, we share primal behavior with other animals, including snakes. The reptilian brain controls courting mates, patrolling territory, dominating submissives, and flocking together. The reptilian brain makes most of the sensational news and will not retreat. Our brains and thus our basic instincts and behaviors have remained largely unchanged for a million years or more. They will not change on time scales considered for “sustainable development.”
Of course, innovations may occur that control individual and social behavior. Law and religion both try, though the snake brain keeps reasserting itself, on Wall Street, in the Balkans, and clawing for Nobel prizes in Stockholm.
Pharmacology also tries for behavioral control, with increasing success. Having penetrated only perhaps 10% of their global market, sales of new “anti-depressants,” mostly tinkering with serotonin in the brain, neared $10 billion in 2000. Drugs can surely make humans very happy, but without restoring Nature.
Because, I believe, behavioral sanctions will be hard-pressed to control the eight or ten billion snake brains persisting in humanity, we should use our hugely expanded neocortex on technology that allows us to tread lightly on Earth. Since ever, homo faber has been trying to make things better and to make better things. During the past two centuries we have become more systematic and aggressive about it, through the diffusion of research & development and the institutions that perform them, including corporations and universities.
What can behavior and technology do to spare and restore Nature during the 21st century? Let’s consider the seas and then the land.
4. Sparing sea life
St. Hubert exemplifies behavior to spare land’s animals. Many thousands of years ago our ancestors sharpened sticks and began hunting. They probably extinguished a few species, such as woolly mammoths, and had they kept on hunting, they might have extinguished many more. Then without waiting on St Hubert, our ancestors ten thousand years ago began sparing land animals in Nature by domesticating cows, pigs, goats, and sheep. By herding rather than hunting animals, humans began a technology to spare wild animals — on land.
In 2001 about 90 million tons of fish are being taken wild from the sea and 30 from fish farms and ranches. Sadly, little reliable information quantifies the diversity, distribution, and abundance of life in the sea, but many anecdotes suggest large, degrading changes. In any case, the ancient sparing of land animals by farming shows us an effective way to spare the fish in the sea. We need to raise the share we farm and lower the share we catch. Other human activities, such as urbanization of coastlines and tampering with the climate, disturb the seas, but today fishing matters most. Compare an ocean before and after heavy fishing.
Fish farming does not require invention. It has been around for a long time. For centuries, the Chinese have been doing very nicely raising herbivores, such as carp.
Following the Chinese example, one feeds crops grown on land by farmers to herbivorous fish in ponds. Much aquaculture of carp and tilapia in Southeast Asia and the Philippines and of catfish near the Gulf Coast of the USA takes this form. The fish grown in the ponds spare fish from the ocean. Like poultry, fish efficiently convert protein in feed to protein in meat. And because the fish do not have to stand, they convert calories in feed into meat even more efficiently than poultry. All the improvements such as breeding and disease control that have made poultry production more efficient can be and have been applied to aquaculture, improving the conversion of feed to meat and sparing wild fish.[iv] With due care for effluents and pathogens, this model can multiply many times in tonnage.
A riskier and fascinating alternative, ocean farming, would actually lift life in the oceans.[v] The oceans vary vastly in their present productivity. In parts of the ocean crystal clear water enables a person to see 50 meters down. These are deserts. In a few garden areas, where one can see only a meter or so, life abounds. Water rich in iron, phosphorus, trace metals, silica, and nitrate makes these gardens dense with plants and animals. The experiments for marine sequestration of carbon demonstrate the extraordinary leverage of iron to make the oceans bloom.
Adding the right nutrients in the right places might lift fish yields by a factor of hundreds. Challenges abound because the ocean moves and mixes, both vertically and horizontally. Nevertheless, technically and economically promising proposals exist for farming on a large scale in the open ocean with fertilization in deep water. One kg of buoyant fertilizer, mainly iron with some phosphate, could produce a few thousand tons of biomass.[vi]
Improving the fishes’ pasture of marine plants is the crucial first step to greater productivity. Zooplankton then graze on phytoplankton, and the food chain continues until the sea teems with diverse life. Fertilizing 250,000 sq km of barren tropical ocean, the size of the USA state of Colorado, in principle might produce a catch matching today’s fish market of 100 million tons. Colorado spreads less than 1/10th of 1% as wide as the world ocean.
The point is that the today’s depleting harvest of wild fishes and destruction of marine habitat to capture them need not continue. The 25% of seafood already raised by aquaculture signals the potential for Restoration (Figure 3). Following the example of farmers who spare land and wildlife by raising yields on land, we can concentrate our fishing in highly productive, closed systems on land and in a few highly productive ocean farms. Humanity can act to restore the seas, and thus also preserve traditional fishing where communities value it. With smart aquaculture, we can multiply life in the oceans while feeding humanity and restoring Nature. St. Hubert, of course, might improve the marine prospect by not eating fellow creatures from the sea.
5. Sparing farmland
What about sparing nature on land? How much must our farming, logging, and cities take?
First, can we spare land for nature while producing our food? [vii] Yields per hectare measure the productivity of land and the efficiency of land use. For centuries land cropped expanded faster than population, and cropland per person rose as people sought more proteins and calories. Fifty years ago farmers stopped plowing up nature (Figure 4). During the past half-century, ratios of crops to land for the world’s major grains-corn, rice, soybean, and wheat-have climbed fast on all six of the farm continents. Between 1972-1995 Chinese cereal yields rose 3.3% per year per hectare. Per hectare, the global Food Index of the Food and Agriculture Organization of the UN, which reflects both quantity and quality of food, has risen 2.3% annually since 1960. In the USA in 1900 the protein or calories raised on one Iowa hectare fed four people for the year. In 2000 a hectare on the Iowa farm of master grower Mr. Francis Childs could feed eighty people for the year.
Since the middle of the 20th century, such productivity gains have stabilized global cropland, and allowed reductions of cropland in many nations, including China. Meanwhile, growth in the world’s food supply has continued to outpace population, including in poor countries. A cluster of innovations including tractors, seeds, chemicals, and irrigation, joined through timely information flows and better organized markets, raised the yields to feed billions more without clearing new fields. We have decoupled food from acreage.
High-yield agriculture need not tarnish the land. Precision agriculture is the key. This approach to farming relies on technology and information to help the grower prescribe and deliver precise inputs of fertilizer, pesticides, seed, and water exactly where they are needed. We had two revolutions in agriculture in the 20th century. First, the tractors of mechanical engineers saved the oats that horses ate and multiplied the power of labor. Then chemical engineers and plant breeders made more productive plants. The present agricultural revolution comes from information engineers. What do the past and future agricultural revolutions mean for land?
To produce their present crop of wheat, Indian farmers would need to farm more than three times as much land today as they actually do, if their yields had remained at their 1966 level. Let me offer a second comparison: a USA city of 500,000 people in 2000 and a USA city of 500,000 people with the 2000 diet but the yields of 1920. Farming as Americans did 80 years ago while eating as Americans do now would require 4 times as much land for the city, about 450,000 hectares instead of 110,000.
What can we look forward to globally? The agricultural production frontier remains spacious. On the same area, the average world farmer grows only about 20 percent of the corn of the top Iowa farmer, and the average Iowa farmer lags more than 30 years behind the state-of-the-art of his most productive neighbor. On average the world corn farmer has been making the greatest annual percentage improvement. If during the next 60 to 70 years, the world farmer reaches the average yield of today’s USA corn grower, the ten billion people then likely to live on Earth will need only half of today’s cropland. This will happen if farmers maintain on average the yearly 2% worldwide growth per hectare of the Food Index achieved since 1960, in other words, if dynamics, social learning, continues as usual. Even if the rate falls to 1%, an area the size of India, globally, could revert from agriculture to woodland or other uses. Averaging an improvement of 2% per year in the productivity and efficiency of natural resource use may be a useful operational definition of sustainability.
Importantly, as Hubert would note, a vegetarian diet of 3,000 primary calories per day halves the difficulty or doubles the land spared. Hubert might also observe that eating from a salad bar is like taking a sport utility vehicle to a gasoline filling station. Living on crisp lettuce, which offers almost no protein or calories, demands many times the energy of a simple rice-and-beans vegan diet.[viii] Hubert would wonder at the greenhouses of the Benelux countries glowing year round day and night. I will trust more in the technical advance of farmers than in behavioral change by eaters. The snake brain is usually a gourmet and a gourmand.
Fortunately, lifting yields while minimizing environmental fall out, farmers can effect the Great Restoration.
6. Sparing forests
Farmers may no longer pose much threat to nature. What about lumberjacks? As with food, the area of land needed for wood is a multiple of yield and diet, or the intensity of use of wood products in the economy, as well as population and income. Let’s focus on industrial wood — logs cut for lumber, plywood, and pulp for paper.
The wood “diet” required to nourish an economy is determined by the tastes and actions of consumers and by the efficiency with which millers transform virgin wood into useful products.[ix] Changing tastes and technological advances are already lightening pressure on forests. Concrete, steel, and plastics have replaced much of the wood once used in railroad ties, house walls, and flooring. Demand for lumber has become sluggish, and in the last decade world consumption of boards and plywood actually declined. Even the appetite for pulpwood, logs that end as sheets of paper and board, has leveled.
Meanwhile, more efficient lumber and paper milling is already carving more value from the trees we cut.[x] And recycling has helped close leaks in the paper cycle. In 1970, consumers recycled less than one-fifth of their paper; today, the world average is double that.
The wood products industry has learned to increase its revenue while moderating its consumption of trees. Demand for industrial wood, now about 1.5 billion cubic meters per year, has risen only 1% annually since 1960 while the world economy has multiplied at nearly four times that rate. If millers improve their efficiency, manufacturers deliver higher value through the better engineering of wood products, and consumers recycle and replace more, in 2050 virgin demand could be only about 2 billion cubic meters and thus permit reduction in the area of forests cut for lumber and paper.
The permit, as with agriculture, comes from lifting yield. The cubic meters of wood grown per hectare of forest each year provide strong leverage for change. Historically, forestry has been a classic primary industry, as Hubert doubtless saw in the shrinking Ardennes. Like fishers and hunters, foresters have exhausted local resources and then moved on, returning only if trees regenerated on their own. Most of the world’s forests still deliver wood this way, with an average annual yield of perhaps two cubic meters of wood per hectare. If yield remains at that rate, by 2050 lumberjacks will regularly saw nearly half the world’s forests (Figure 5). That is a dismal vision — a chainsaw every other hectare, skinhead Earth.
Lifting yields, however, will spare more forests. Raising average yields 2 percent per year would lift growth over 5 cubic meters per hectare by 2050 and shrink production forests to just about 12 percent of all woodlands. Once again, high yields can afford a Great Restoration.
At likely planting rates, at least one billion cubic meters of wood — half the world’s supply — could come from plantations by the year 2050. Semi-natural forests — for example, those that regenerate naturally but are thinned for higher yield — could supply most of the rest. Small-scale traditional “community forestry” could also deliver a small fraction of industrial wood. Such arrangements, in which forest dwellers, often indigenous peoples, earn revenue from commercial timber, can provide essential protection to woodlands and their inhabitants.
More than a fifth of the world’s virgin wood is already produced from forests with yields above 7 m3 per hectare. Plantations in Brazil, Chile, and New Zealand can sustain yearly growth of more than 20 m3 meters per hectare with pine trees. In Brazil eucalyptus — a hardwood good for some papers — delivers more than 40 m3 per hectare. In the Pacific Northwest and British Columbia, with plentiful rainfall, hybrid poplars deliver 50 m3 per hectare.
Environmentalists worry that industrial plantations will deplete nutrients and water in the soil and produce a vulnerable monoculture of trees where a rich diversity of species should prevail. Meanwhile, advocates for indigenous peoples, who have witnessed the harm caused by crude industrial logging of natural forests, warn that plantations will dislocate forest dwellers and upset local economies. Pressure from these groups helps explain why the best practices in plantation forestry now stress the protection of environmental quality and human rights. As with most innovations, achieving the promise of high-yield forestry will require feedback from a watchful public.
The main benefit of the new approach to forests will reside in the natural habitat spared by more efficient forestry. An industry that draws from planted forests rather than cutting from the wild will disturb only one-fifth or less of the area for the same volume of wood. Instead of logging half the world’s forests, humanity can leave almost 90 % of them minimally disturbed. And nearly all new tree plantations are established on abandoned croplands, which are already abundant and accessible. Although the technology of forestry rather than the behavior of hunters spared the forests and stags, Hubert would still be pleased.
7. Sparing pavement
What then are the areas of land that may be built upon? One of the most basic human instincts, from the snake brain, is territorial. Territorial animals strive for territory. Maximizing range means maximizing access to resources. Most of human history is a bloody testimony to the instinct to maximize range. For humans, a large accessible territory means greater liberty in choosing the points of gravity of our lives: the home and the workplace.
Around 1800, new machines began transporting people faster and faster, gobbling up the kilometers and revolutionizing territorial organization.[xi] The highly successful machines are few—train, motor vehicle, and plane—and their diffusion slow. Each has taken from 50 to 100 years to saturate its niche. Each machine progressively stretches the distance traveled daily beyond the 5 km of mobility on foot. Collectively, their outcome is a steady increase in mobility. For example, in France, from 1800 to today, mobility has extended an average of more than 3% per year, doubling about every 25 years. Mobility is constrained by two invariant budgets, one for money and one for time. Humans always spend an average 12-15% of their income for travel. And the snake brain makes us visit our territory for about one hour each day, the travel time budget. Hubert doubtless averaged about one hour of walking per day.
The essence is that the transport system and the number of people basically determine covered land.[xii] Greater wealth enables people to buy higher speed, and when transit quickens, cities spread. Both average wealth and numbers will grow, so cities will take more land.
The USA is a country with a fast growing population, and expects about another 100 million people over the next century. Californians pave or build on about 600 m2 each. At the California rate, the USA increase would consume 6 million hectares, about the combined land area of the Netherlands and Belgium. Globally, if everyone new builds at the present California rate, 4 billion added to today’s 6 billion people would cover about 240 million hectares, midway in size between Mexico and Argentina.
Towering higher, urbanites could spare even more land for nature. In fact, migration from the country to the city formed the long prologue to the Great Restoration. Still, cities will take from nature.
But, to compensate, we can move much of our transit underground, so we need not further tar the landscape. The magnetically levitated train, or maglev, a container without wings, without motors, without combustibles aboard, suspended and propelled by magnetic fields generated in a sort of guard rail, nears readiness (Figure 6). A route from the airport of Shanghai to the city center will soon open. If one puts the maglev underground in a low pressure or vacuum tube, as the Swiss think of doing with their Swissmetro, then we would have the equivalent of a plane that flies at high altitude with few limitations on speed. The Swiss maglev plan links all Swiss cities in 10 minutes.[xiii]
Maglevs in low pressure tubes can be ten times as energy efficient as present transport systems. In fact, they need consume almost no net energy. Had Hubert crossed the USA in 1850 to San Francisco from St. Louis on the Overland Stage, he would have exhausted 2700 fresh horses.
Future human settlements could grow around a maglev station with an area of about 1 km2 and 100,000 inhabitants, be largely pedestrian, and via the maglev form part of a network of city services within walking distance. The quarters could be surrounded by green land. In fact, cities please people, especially those that have grown naturally without suffering the sadism of architects and urban planners.
Technology already holds green mobility in store for us. Naturally maglevs want 100 years to diffuse, like the train, auto, or plane. With maglevs, together with personal vehicles and airplanes operating on hydrogen, Hubert could range hundreds of kilometers daily for his ministry, fulfilling the urges of his reptilian brain, while leaving the land and air pristine.
8. Cardinal Resolutions
How can the Great Restoration of Nature I envision be accomplished? Hubert became only a Bishop, but in his honor, I propose we promote four cardinal resolutions, one each for fish, farms, forests, and transport.
Resolution one: The stakeholders in the oceans, including the scientific community, shall conduct a worldwide Census of Marine Life between now and the year 2010. Some of us already are trying.[xiv] The purpose of the Census is to assess and explain the diversity, distribution, and abundance of marine life. This Census can mark the start of the Great Restoration for marine life, helping us move from uncertain anecdotes to reliable quantities. The Census of Marine Life can provide the impetus and foundation for a vast expansion of marine protected areas and wiser management of life in the sea.
Resolution two: The many partners in the farming enterprise shall continue to lift yields per hectare by 2% per year throughout the 21st century. Science and technology can double and redouble yields and thus spare hundreds of millions of hectares for Nature. We should also be mindful that our diets, that is, behavior, can affect land needed for farming by a factor of two.
Resolution three: Foresters, millers, and consumers shall work together to increase global forest area by 10%, about 300 million hectares, by 2050. Furthermore, we will concentrate logging on about 10% of forest land. Behavior can moderate demand for wood products, and foresters can make trees that speedily meet that demand, minimizing the forest we disturb. Curiously, neither the diplomacy nor science about carbon and greenhouse warming has yet offered a visionary global target or timetable for land use.[xv]
Resolution four: The major cities of the world shall start digging tunnels for maglevs. While cities will sprawl, our transport need not pave paradise or pollute the air. Although our snake brains and the instinct to travel will still determine travel behavior, maglevs can zoom underground, sparing green landscape.
Clearly, to realize our vision we shall need both maglevs and the vision of St. Hubert. Simply promoting the gentle values of St. Hubert is not enough. Soon after he painted his masterpiece, Paulus Potter died of tuberculosis and was buried in Amsterdam on 7 January 1654 at the age of 29. In fact, Potter suffered poor engineering. Observe in The Life of the Hunter that the branch of the tree from which the dogs hang does not bend.
Because we are already more than 6 billion and heading for 10 in the new century, we already have a Faustian bargain with technology. Having come this far with technology, we have no road back. If Indian wheat farmers allow yields to fall to the level of 1960, to sustain the present harvest they would need to clear nearly 50 million hectares, about the area of Madhya Pradesh or Spain.
So, we must engage the elements of human society that impel us toward fish farms, landless agriculture, productive timber, and green mobility. And we must not be fooled into thinking that the talk of politicians and diplomats will achieve our goals. The maglev engineers and farmers and foresters are the authentic movers, aided by science. Still, a helpful step is to lock the vision of the Great Restoration in our minds and make our cardinal resolutions for fish, farms, forests, and transport. In the 21st century, we have both the glowing vision of St. Hubert and the technology exemplified by maglevs to realize the Great Restoration of Nature.
Acknowledgements: Georgia Healey, Cesare Marchetti, Perrin Meyer, David Victor, Iddo Wernick, Paul Waggoner, and especially Diana Wolff-Albers for introducing me to Paulus Potter.
Figures
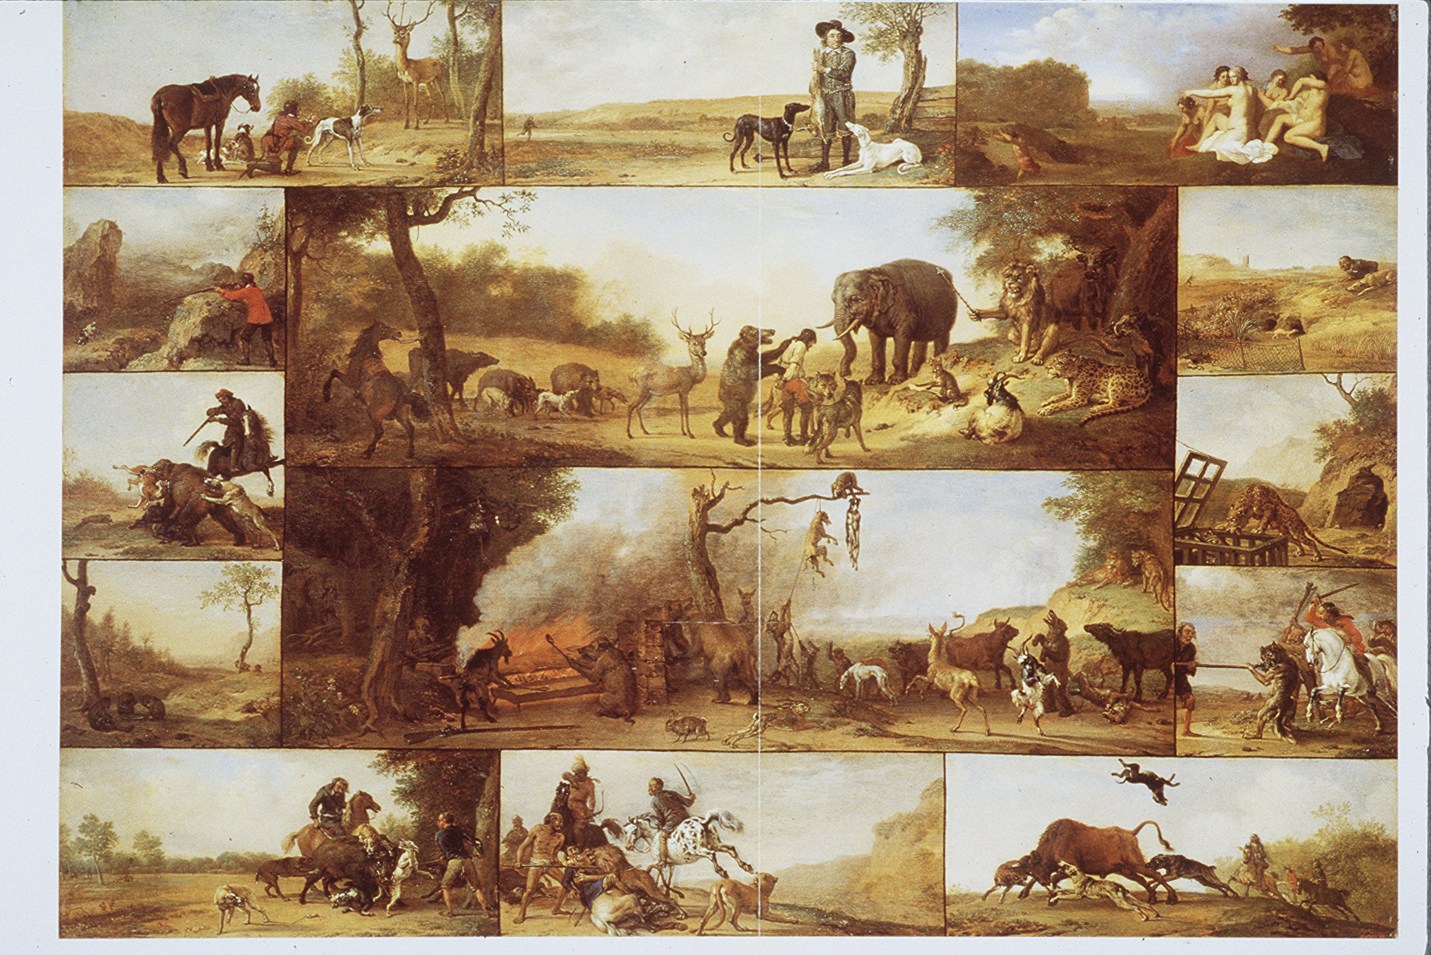
Figure 1. The Life of the Hunter by Paulus Potter. The painting hangs in the museum of the Hermitage, St. Petersburg.
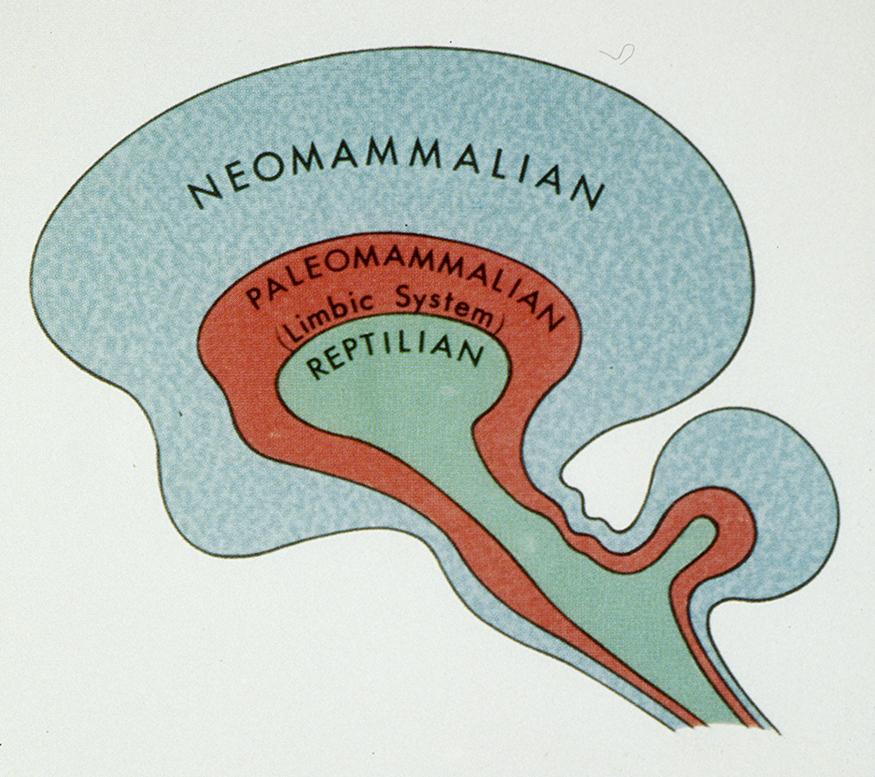
Figure 2. Symbolic representation of the triune brain. Source: P. D. MacLean, 1990.
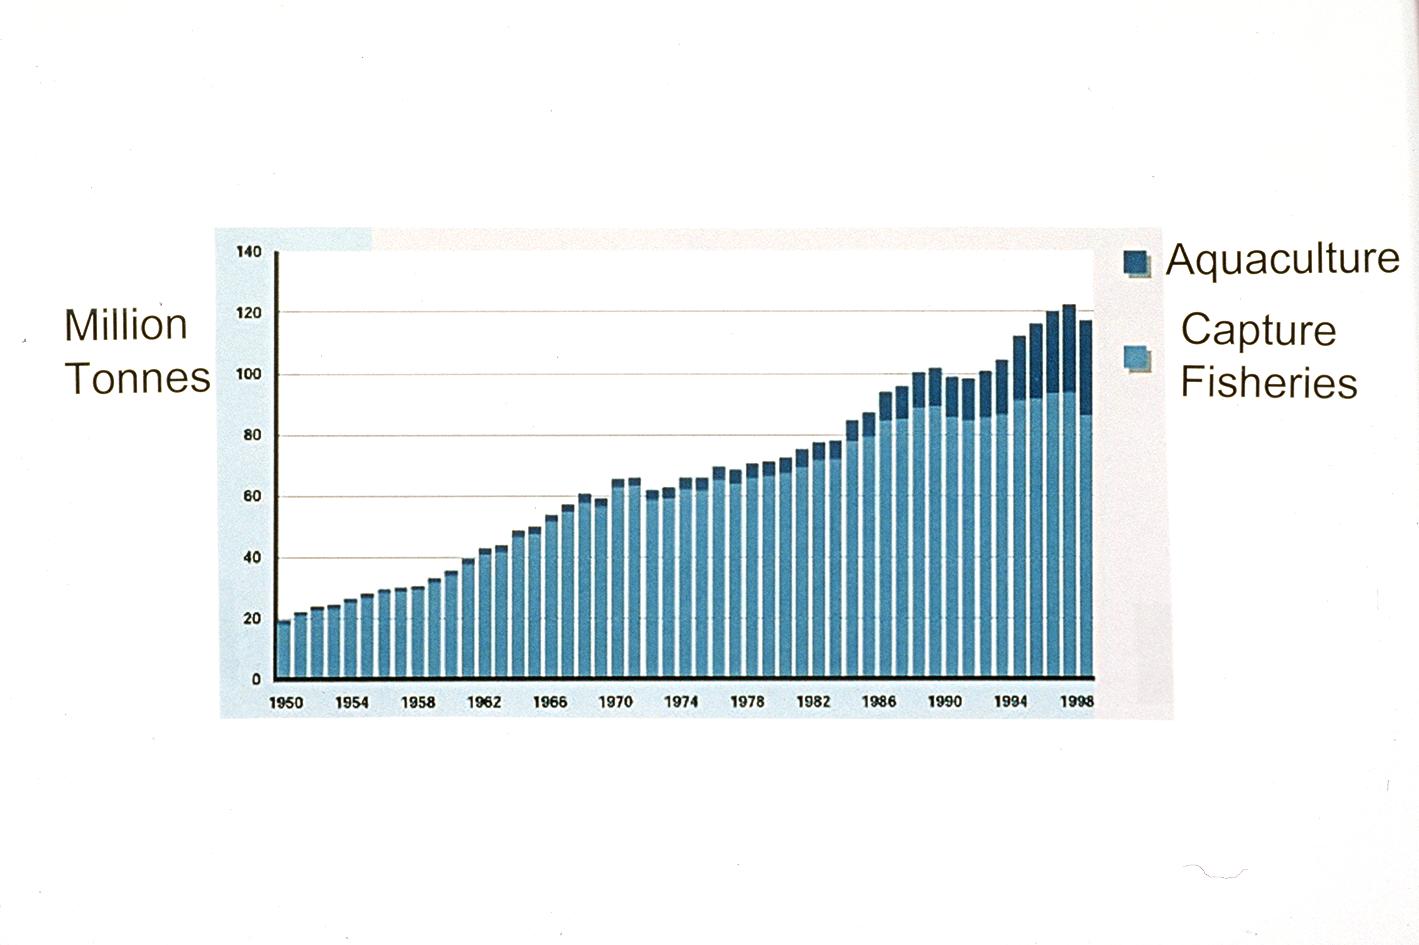
Figure 3. World capture fisheries and aquaculture production. Note the rising amount and share of aquaculture. Source: Food and Agriculture Organization of the UN, The state of world fisheries and aquaculture 2000, Rome. https://www.fao.org/DOCREP/003/X8002E/X8002E00.htm
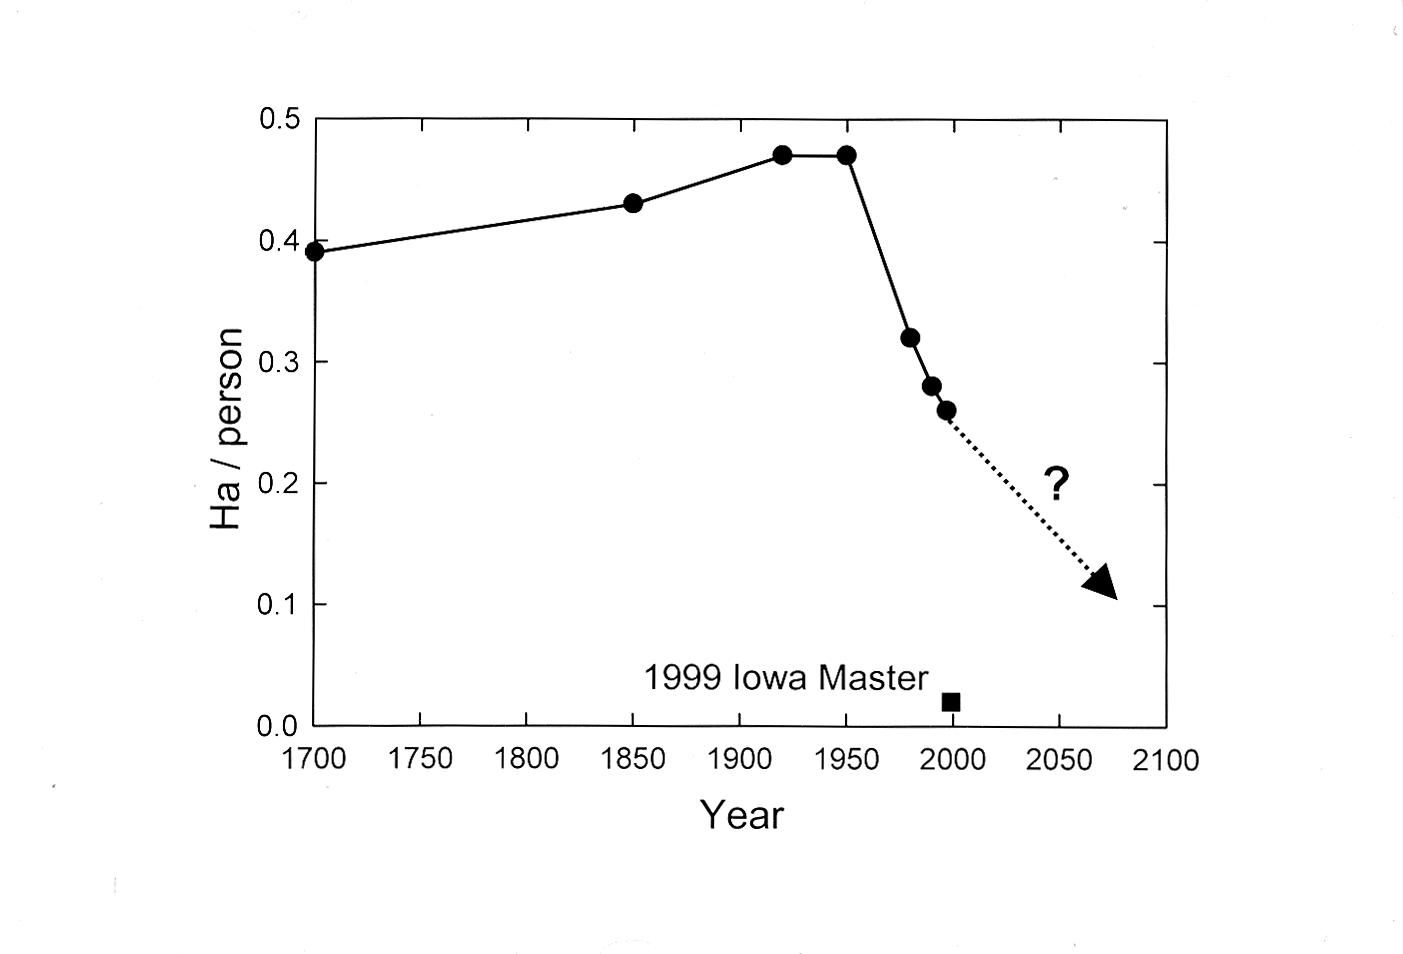
Figure 4. Reversal in area of land used to feed a person. After gradually increasing for centuries, the worldwide area of cropland per person began dropping steeply in about 1950, when yields per hectare began to climb. The square shows the area needed by the Iowa Master Corn Grower of 1999 to supply one person a year’s worth of calories. The dotted line shows how sustaining the lifting of average yields 2 percent per year extends the reversal. Sources of data: Food and Agriculture Organization of the United Nations, various Yearbooks. National Corn Growers Association, National Corngrowers Association Announces 1999 Corn Yield Contest Winners, Hot Off the Cob, St. Louis MO, 15 December 1999; J. F. Richards, 1990, “Land Transformations,” in The Earth as Transformed by Human Action, B. L. Turner II et al. eds., Cambridge University: Cambridge, UK.
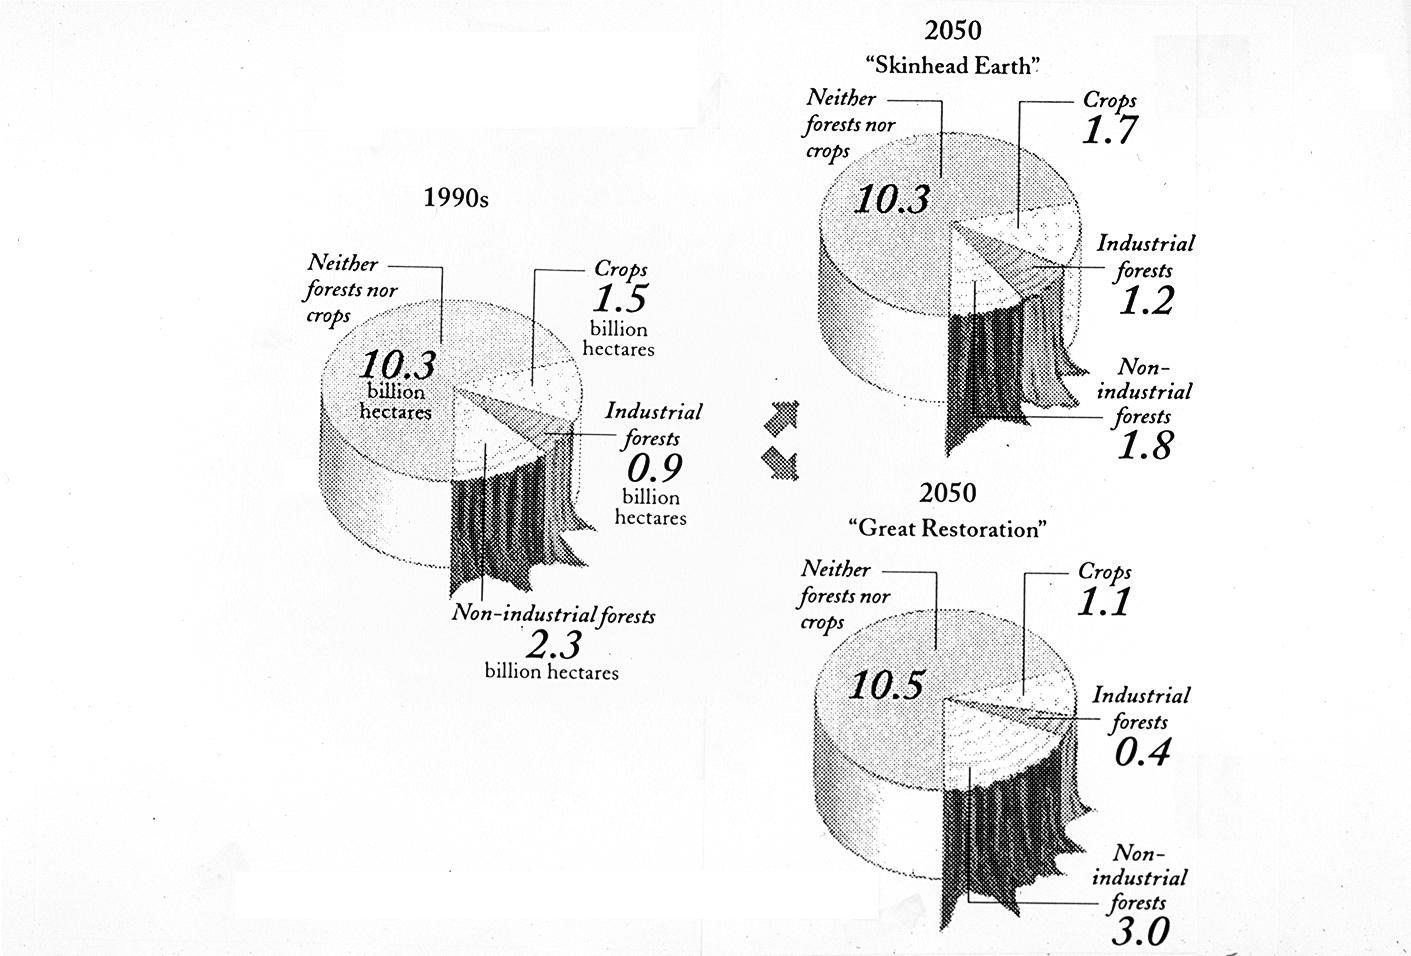
Figure 5. Present and projected land use and land cover. Today’s 2.4 billion hectares used for crops and industrial forests spread on “Skinhead Earth” to 2.9 while in the “Great Restoration” they contract to 1.5. Source: D. G. Victor and J. H. Ausubel, Restoring the Forests, Foreign Affairs 79(6): 127-144, 2000.
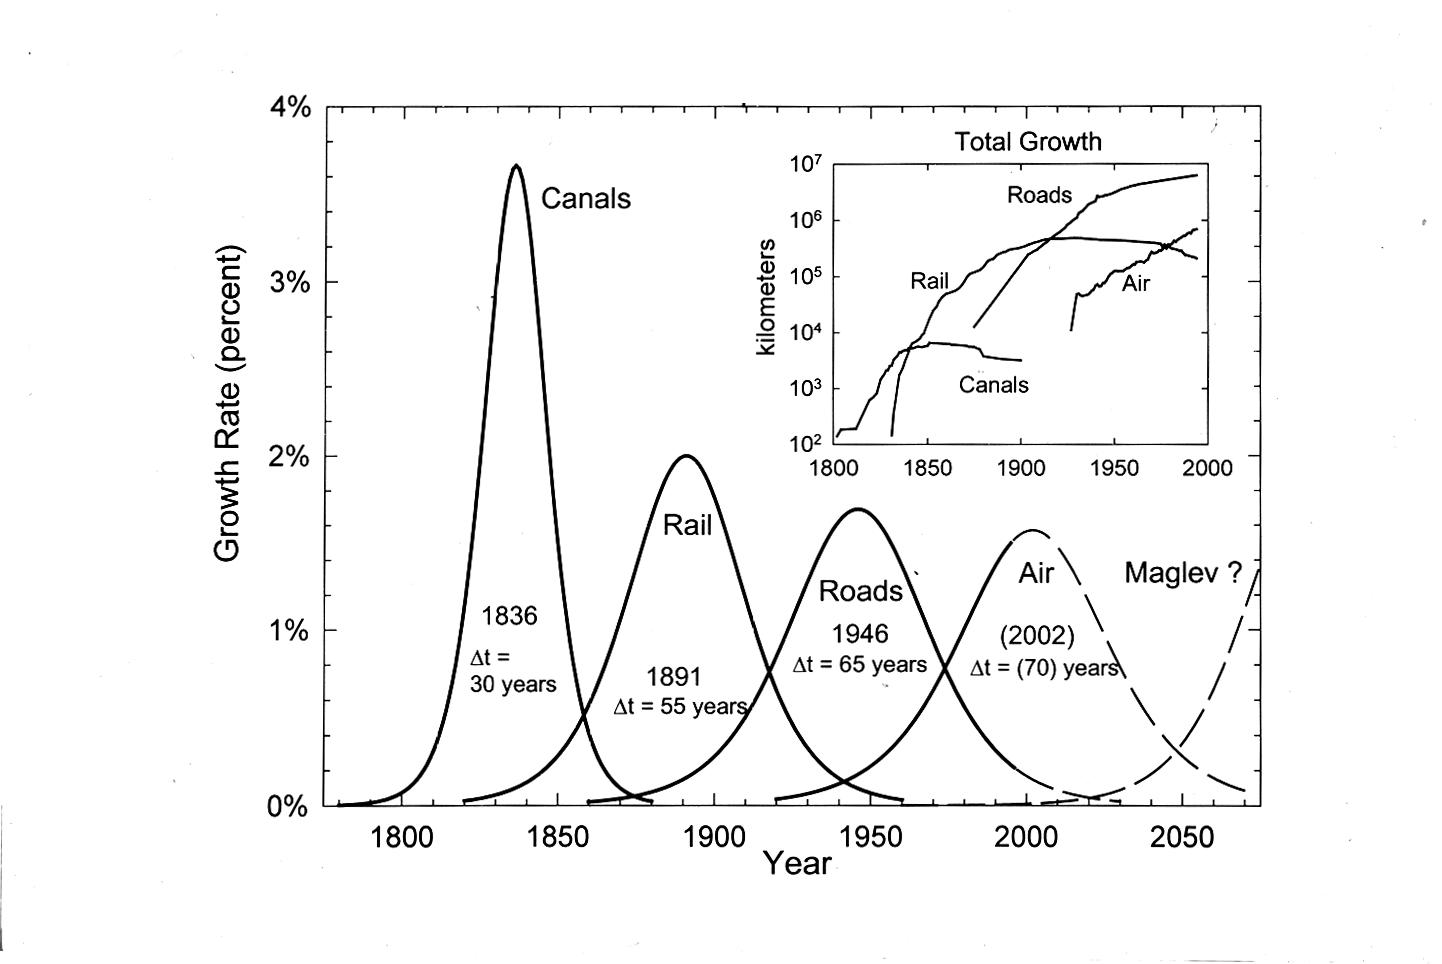
Figure 6. Smoothed historic rates of growth (solid lines) of the major components of the US transport infrastructure and conjectures (dashed lines) based on constant dynamics. Rhythm evokes a new entrant now, maglevs. The inset shows the actual growth, which eventually became negative for canals and rail as routes were closed. Delta t is the time for the system to grow from 10% to 90% of its extent. Source: Toward Green Mobility: The Evolution of Transport, J. H. Ausubel, C. Marchetti, and P. S. Meyer, European Review 6(2): 137-156 (1998).
References and Notes
[i] A. Walsh, E. Buijsen, and B. Broos, Paulus Potter: Schilderijen, tekeningen en etsen, Waanders, Zwolle, 1994.
[ii] The upper right panel shows Diana and Acteon, from the Metamorphosis of the Roman poet Ovid. Acteon, a hunter, was walking in the forest one day after a successful hunt and intruded in a sacred grove where Diana, the virgin goddess, bathed in a pond. Suddenly, in view of Diana, Acteon became inflamed with love for her. He was changed into a deer, from the hunter to what he hunted. As such, he was killed by his own dogs. This panel was painted by a colleague of Potter.
[iii] P. D. MacLean, The Triune Brain in Evolution: Role in Paleocerebral Functions, Plenum, New York, 1990.
[iv] In some fish ranching, notably most of today’s ranching of salmon, the salmon effectively graze the oceans, as the razorback hogs of a primitive farmer would graze the oak woods. Such aquaculture consists of catching wild “junk” fish or their oil to feed to our herds, such as salmon in pens. We change the form of the fish, adding economic value, but do not address the fundamental question of the tons of stocks. A shift from this ocean ranching and grazing to true farming of parts of the ocean can spare others from the present, on-going depletion.
[v] J. H. Ausubel, The Great Reversal: Nature’s Chance to Restore Land and Sea, Technology in Society 22(3):289-302, 2000; M. Markels, Jr., Method of improving production of seafood. US Patent 5,433,173, July 18, 1995, Washington DC.
[vi] Along with its iron supplement, such an ocean farm would annually require about 4 million tons of nitrogen fertilizer, 1/20th of the synthetic fertilizers used by all land farms.
[vii] P. E. Waggoner and J. H. Ausubel, How Much Will Feeding More and Wealthier People Encroach on Nature? Population and Development Review 27(2):239-257, 200.
[viii] G. Leach, Energy and Food Production, IPC Science and Technology Press, Guildford UK, 1976, quantifies the energy costs of a range of food systems.
[ix] I. K. Wernick, P. E. Waggoner, and J. H. Ausubel, Searching for Leverage to Conserve Forests: The Industrial Ecology of Wood Products in the U.S., Journal of Industrial Ecology 1(3):125-145, 1997.
[x] In the United States, for example, leftovers from lumber mills account for more than a third of the wood chips turned into pulp and paper; what is still left after that is burned for power.
[xi] J. H. Ausubel, C. Marchetti, and P. S. Meyer, Toward Green Mobility: The Evolution of Transport, European Review 6(2):143-162, 1998.
[xii] P. E. Waggoner, J. H. Ausubel, I. K. Wernick, Lightening the Tread of Population on the Land: American Examples, Population and Development Review 22(3):531-545, 1996.
[xiii] www.swissmetro.com
[xiv] J. H. Ausubel, The Census of Marine Life: Progress and Prospects, Fisheries 26 (7): 33-36, 2001.
[xv] D. G. Victor and J. H. Ausubel, Restoring the Forests, Foreign Affairs 79(6): 127-144, 2000.
We must make nature worthless
Because the Brain Does Not Change, Technology Must
This paper was originally published by the American Association of Engineering Societies (Washington D.C.), in a report “Production Efficiencies: The Engineers’ Report,” pp. 14-18, 1999.
It was republished in: IEEE Aerospace and Electronic SYSTEMS 14(10):3-6, October 1999.
The paper is based on a talk Jesse gave at the UN Commission on Sustainable Development meetings in New York in April 1999.
(Note: The figures are at the end of this document for easier online reading.)
My message is my title: Because the Human Brain Does Not Change, Technology Must. That is, technology must change, must improve, to accommodate billions more people and to lift the standard of living. Engineers, receiving feedback from the market and regulated wisely in the public interest, do much of the improving. Thus, the chance for improving Earth’s environment hinges on engineers, and therefore their social context and technical vision. [1]
First I will explain what I mean by the unchanging human brain. Then I will exemplify technical change in energy and agriculture in the cardinal directions it must go.
The Triune Brain
In a remarkable 1990 book, The Triune Brain in Evolution , neuroscientist Paul MacLean explained that humans have three brains, each developed during a stage of evolution. [2] The earliest, found in reptiles, MacLean calls the snake brain. In mammals another brain appeared, the paleomammalian, with new particular behavior, for example, care of the young and mutual grooming. In humans came the most recent evolutionary structure, the hugely expanded neocortex. This neomammalian brain enabled language, visualization, and symbolic skills. But economical evolution did not replace the reptilian brain, it added. Thus, we share primal patterns of behavior with other animals, just as they share those brain structures. The snake brain controls courtship, patrolling of territory (including our daily 75-minute travel budget), displays of dominance and submission, and flocking. And makes most of the sensational news.
Our brains and thus our basic instincts and behaviors have remained unchanged for a million years or more. They will not change on time scales considered for “sustainable development.”
Of course, innovations may occur that control individual and social behavior. Law and religion both try, though the snake brain keeps reasserting itself, in crime and in punishment. Pharmacology also tries, with increasing success. Sales of new “anti-depressants,” mostly tinkering with serotonin in the brain, are about $10 billion in 1999, having penetrated only perhaps 10% of their global market.
Because, it seems to me, these forms of social control are unreliable, we should emphasis our greatest success, bettering technique. Since ever, homo faber has been trying to make things better and to make better things. During the past two centuries we have become more systematic and aggressive about it, through the diffusion of research & development and the institutions that perform them, including corporations and universities.
Let me now focus on two cardinal directions for technique, for engineering, decarbonization of energy and landless agriculture.
Decarbonization
Carbon matters because it burns; combustion releases energy. But burnt carbon in local places can cause smog and in very large amounts can change the global climate. Raw carbon blackens miners’ lungs and escapes from containers to form spills and slicks. Carbon enters the energy economy in the hydrocarbon fuels, coal, oil, and gas, as well as wood. In fact, the truly desirable element in these fuels for energy generation is not their carbon (C) but their hydrogen (H).
Wood is made of much cellulose and some lignin. Heated cellulose leaves charcoal, almost pure carbon. Lignin has a complex benzenic structure with an H:C ratio of about 0.5. Combining the pure carbon of cellulose and the 0.5 ratio of lignin, wood with 20% lignin effectively has an H:C ratio of 0.1. Said differently, wood weighs in heavily at ten effective Cs for each H. Coal approaches parity with one or two Cs per H, while oil improves to two H per C, and a molecule of natural gas (methane) is a carbon-trim CH 4.
The most important single finding from thirty years of energy studies is that that for two hundred years the world has progressively lightened its energy diet by favoring hydrogen atoms over carbon in our hydrocarbon stew (Figure 1). We will and must continue to do so. The increasing density of end-use of energy in cities finally accepts only natural gas, hydrogen, and electricity. Office buildings and homes reject smoking coals or hay.
The spectrum of national achievements also shows how far most of the world economy is from best practice in decarbonization. The present carbon intensity of the Chinese and Indian economies resembles those of America and Europe at the onset of industrialization in the nineteenth century.
Engineers must foster the unrelenting though slow ascendance of hydrogen in the energy market. We must squeeze most of the carbon out of the energy system and move, via natural gas, to a hydrogen economy. Hydrogen, fortunately, is the immaterial material. It can be manufactured from something abundant, namely water; it can substitute for most fuels; and its combustion to water vapor does not pollute.
Part of economizing on carbon is economizing on energy more broadly. Widgets work better than behavior modifications. The snake brain resists the carpool but grabs a lighter laptop. Fortunately, efficiency has been gaining in the generation of energy, in its transmission and distribution, and in the innumerable devices that finally consume energy (Figure 2). In fact, the struggle to make the most of our fires dates back at least 750,000 years to the ancient hearths of the Escale cave near Marseilles. A good stove did not emerge until 1744 CE. Benjamin Franklin’s invention proved to be a momentous event for the forests and wood piles of America. The Franklin stove greatly reduced the amount of fuel required. Its widespread diffusion took a hundred years, however, because the American colonials were poor, development of manufactures sluggish, and iron scarce.
Looking globally in 1999, nothing in the energy game has changed, only now the stakes are higher. But we should be encouraged by our inventiveness with the performance of motors and lights. For the next couple of decades, the context indicates that priority and profit will come to those who build a highly efficient methane economy, the next stage of decarbonization.
Landless agriculture
As we must spare carbon while producing our energy, so must we spare land for nature while producing our food. Earth cannot sustain humans if it sustains humans alone. The direction, inevitably, is landless agriculture.
Yields per hectare measure the productivity of land and the efficiency of land use. During the past half-century, ratios of crops to land for the world’s major grains-corn, rice, soybean, and wheat-have climbed fast on all six of the farm continents. Per hectare, world grain yields rose about two percent annually since 1960. The productivity gains have stabilized global cropland since mid-century, mitigating pressure for deforestation in all nations and allowing forests to spread again in many. A cluster of innovations including tractors, seeds, chemicals, and irrigation, joined through timely information flows and better organized markets, raised the yields to feed billions more without clearing new fields.
Fortunately, as Figure 3 shows, the agricultural production frontier remains spacious. On the same area, the average world farmer grows only about 20 percent of the corn of the top Iowa farmer, and the average Iowa farmer lags more than 30 years behind the state-of-the-art of his most productive neighbor. On average the world corn farmer has been making the greatest annual percentage improvement.
High-yield agriculture need not tarnish the land. The key is precision agriculture . This approach to farming relies on technology and information to help the grower use precise amounts of inputs-fertilizer, pesticides, seed, water—exactly where they are needed. Precision agriculture includes grid soil sampling, field mapping, variable rate application, and yield monitoring—tied to global positioning systems. It helps the grower lower costs and improve yields in an environmentally responsible manner. Ohio farmers recently reported using one-third less lime after putting fields on square-foot satellite grids detailing areas that would benefit from fertilizer.
We have had two revolutions in agriculture in this century. The first came from mechanical engineers. The second came from chemical engineers. The next agricultural revolution will come from information engineers, physical and genetic. What do the past and future agricultural revolutions mean for land?
For centuries land cropped expanded faster than population, and cropland per person rose (Figure 4). Fifty years ago farmers stopped plowing up nature. Meanwhile, growth in calories in the world’s food supply has continued to outpace population, especially in poor countries. To produce their present crop of wheat, Indian farmers would need to farm more than three times as much land today as they actually do, if their yields had remained at their 1966 level. By raising yields, Indian wheat farmers have spared nearly 50 million hectares, about the area of Madhya Pradesh or Spain. Let me offer a second comparison: a USA city of 500,000 people in 1994 and a USA city of 500,000 people with the 1994 diet and the yields of 1920. Farming as Americans did 75 years ago while eating as Americans do now would require 4 times as much land for the city, about 450,000 hectares instead of 110,000.
What can we look forward to globally? If during the next 60 to 70 years, the world farmer reaches the average yield of today’s USA corn grower, the ten billion people then likely to live on Earth will need only half of today’s cropland. This will happen if farmers maintain on average the yearly 2% worldwide yield growth of grains achieved since 1960, in other words, if dynamics, social learning, continues as usual. Even if the rate falls in half, an area the size of India, globally, will revert from agriculture to woodland or other uses.
Importantly, a vegetarian diet of 3,000 primary calories per day halves the difficulty or doubles the land spared. However, I trust more in the technical advance of farmers than in behavioral change by eaters.
So the challenge for the next decades in agriculture remains clear: lift yields while minimizing environmental fall out. Use less land.
And lift inhibitions on the imaginations of our food engineers. Let me offer a shocking idea to show how high we might raise limits. Going back to basics on food, we depend on the hydrogen produced by the chlorophyll of plants. With hydrogen, produced by nuclear power plants, for example, a plethora of micro-organisms can cook up the variety of substances in our diet. For decades, microbiologists have produced food by cultivating hydrogenomonas on a diet of H 2, CO 2, and a little O 2. They make nice proteins that taste like hazelnut. A person consumes around 100 watts. A current nuclear power plant has a power of a couple of gigawatts, enough to supply food for a few million people, on perhaps 1000 hectares for the Power Park. So, the nuclear plant can feed 2000 people per hectare. Iowa’s master corn growers feed about 80. So, WITH CURRENT TECHNOLOGY, we can do 25 times better than the best Iowa corn field. And finally decouple food and land.
Conclusion
If behavior and technology do not change, more numerous humans will trample the earth and endanger our own survival. The snake brain in each of us makes me cautious about relying heavily on changes in behavior. In contrast, centuries of extraordinary technical progress give me great confidence that diffusion of our best practices and continuing innovation can advance us much further in decarbonization, landless agriculture, and other cardinal directions for a prosperous, green environment. For engineers and others in the technical enterprise the urgency and prizes for sustaining their contributions could not be higher. Because the human brain does not change, technology must.
Acknowledgement: Thanks to Perrin Meyer for assistance.
Figure 1: World primary energy sources have declined in carbon intensity since 1860. The evolution is seen in the ratio of hydrogen (H) to carbon (C) in the world fuel mix, graphed on a logarithmic scale, analyzed as a logistic growth process and plotted in the linear transform of the logistic (S) curve. Progression of the ratio above natural gas (methane, CH 4) requires production of large amounts of hydrogen fuel with non-fossil energy.
Figure 2: Energy efficiency is a term of modern invention, but the efficiency of energy conversion devices has been increasing for hundreds and probably thousands of years. Improvements in motors and lamps are analyzed here in the linear transform of the logistic (S-shaped) growth process.
Figure 3: The trends of maize yields grown by the winners of the Iowa Master Corn Growers Contest and of average yields of Iowa, World, and Brazilian farmers, and the average annual rise since 1960.
Figure 4: The average cropland per person since about the year 1700. The star shows the small amount of land required by an Iowa Master corn grower to produce the calories needed to sustain a person for a year.
Endnotes:
[1] Technical information and sources for the text and figures are found in papers on-line at phe.rockefeller.edu See, for example, “The Liberation of the Environment,” Jesse H. Ausubel; “Lightening the Tread of Population on the Land: American Examples,” Paul E. Waggoner, Jesse H. Ausubel, and Iddo K. Wernick; and “Energy and Environment: The Light Path,” Jesse H. Ausubel.
[2] Paul D. MacLean, The Triune Brain in Evolution: Role in Paleocerebral Functions, Plenum, New York, 1990.
Nature Rebounds
Will the Rest of the World Live Like America?
Can Technology Spare the Earth?
Evolving efficiencies in our use of resources suggest that technology can restore the environment even as population grows
(NOTE: The color figures are at the end of this document for easier online reading)
Technologies have enabled us to expand our range and transform the earth. In 1909 Peary sledded to the North Pole, and in 1911 Amundsen reached the South. Improved navigational aids and ships that could withstand the pack ice made the poles accessible to men and dogs. Less than a century later we worry about the environmental purity of the polar regions and the ozone that shields them. My fundamental question is whether the technology that has conquered the earth can also spare it. To answer this question, I shall examine secular trends in what technology does with four paramount resources: energy, materials, land and water. I focus on the evolving efficiency of use of these resources. Economists call such resources “factors of production,” along with labor and capital.
Customarily, technology’s relation to environment is considered by evaluating lists of devices and machines: cars, oil tankers, nuclear power stations, windmills, wastewater-treatment plants, spray cans and chain saws. My approach is more basic. I ask whether technology enables us to obtain services more efficiently and, if so, at what rates. The answers indicate the feasibility of greatly diminishing our environmental burdens by increasing the productivity of our resources.
Analysts, eager to assimilate the latest information, live life on the tangent, extrapolating brief fluctuations to eternity. To counter this tendency, I search for stable signals amid the noise of the daily news. The historical analyses shared here, many contributed to an ongoing project at The Rockefeller University on technological trajectories and the human environment, seek the inherent lifetimes of processes of technological development, which can extend generations and centuries. Recognizing and formally analyzing incomplete developmental processes and the rhythmic patterns of processes permits confident prediction.
Identifying secular trends also enables me to frame answers to a second question: what distinguishes the last half-century or so with regard to environment and technology. The years around 1970 marked the maximum rate of growth of human population in modern times. Have we more generally passed a point of inflection in the curve of human development? Finally, what present actions will wave us toward sweet, greener days?
Two basic arguments weigh against technology. One is that technology’s success is self-defeating. Technology makes the human niche elastic. If we solve problems, our population grows and creates further, eventually insurmountable problems. The cardinal case is the conquest of death in developing countries. Public-health measures and modern medicine defeat mortality, while fertility declines at a much slower pace, and so population explodes. Before dosing, I shall consider technology’s relation to population. Population is always the catch.
The second argument contra-technology is the paucity of human wisdom. Technology creates handguns and hydrogen bombs, and these kill. We can use science and technology to provide goods and services for human sustenance and comfort and other purposes worthy for the planet. But technology powers good and evil. Some would feel more comfort with less power. I leave it to others to discuss the cultural controls to assure constructive use of science and technology.
A subordinate, manageable argument is that unanticipated consequences of the introduction of technologies diminish their value. Chlorinated fluorocarbons solved the problem of explosive and inefficient ammonia based refrigerators, but turned out 40 years after their introduction to threaten life’s stratospheric filter. The appropriate response is a feedback system: Assess technologies early in their prospective social penetration, watch them thereafter for surprises and tailor designs to fit changing needs and tastes.
I outline a global picture, with most detail from the United States. For more than a century the United States has on average adopted technologies earliest, diffused them fullest and documented the outcomes. The symptoms and cures show.
Energy
Energy systems extend from the mining of coal through the generation and transmission of electricity to the artificial light that enables the reader to see this page. For environmental technologists, two central questions define the energy system. First, is the efficiency increasing? Second, is the carbon used to deliver energy to the final user declining?
Energy efficiency has been gaining in many segments, probably for thousands of years. Think of all the designs and devices to improve fireplaces and chimneys. Or consider the improvement in motors and lamps (Figure 2). About 1700 the quest began to build efficient engines, at first with steam. Three hundred years have increased the efficiency of generators from 1 to about 50 percent of the apparent limit, the latter achieved by today’s best gas turbines. Fuel cells can advance efficiency to 70 percent. They will require about 50 years to do so, if the socio-technical clock continues to tick at its established rate. In 300 years, physical laws may finally arrest our engine progress.
Whereas centuries measure the struggle to improve generators, lamps brighten with each decade. A new design proposes to bombard sulfur with microwaves. One such bulb the size of a golf ball could purportedly produce the same amount of light as hundreds of high-intensity mercury-vapor lamps, with a quality of light comparable to sunlight. The current 100-year pulse of improvement evident in Figure 2 will surely not extinguish ideas for illumination The next century may reveal quite new ways to see in the dark For example, nightglasses, the mirror image of sunglasses, could make the objects of night visible with a few milliwatts.
Segments of the energy economy have advanced impressively toward local ceilings of 100 percent efficiency. However, modem economies still work far from the limit of system efficiency because system efficiency is multiplicative, not additive. In fact, if we define efficiency as the ratio of the theoretical minimum to the actual energy consumption for the same goods and services, modern economies probably run at less than 5 percent efficiency for the full chain from extracting primary energy to delivery of the service to the final user. So, far from a ceiling, the United States has averaged about 1 percent less energy to produce a good or service each year since about 1800. At that pace of advance, total efficiency will still approach only 15 percent by 2100. Because of some losses difficult to avoid in each link of the chain, the thermodynamic efficiency of the total system in practice could probably never exceed 50 percent. Still, in 1995 we are early in the game.
What about the decarbonization of the energy system? Carbon matters because it blackens lungs, causes air pollution and oil spills and regulates climate. Carbon is also a surrogate for sulfur, heavy metals and other environmental bads that attach to it in the dirty fossil fuels. Carbon enters the energy economy bonded with hydrogen as wood (and other biomass), coal, oil and natural gas. Per unit of energy, wood weighs most heavily in carbon, followed by coal, and then oil, with natural gas following as much the lightest.
One can measure decarbonization in several different ways. The upper graph in Figure 4 shows the changing carbon intensity of primary energy for the world, where tons of carbon are divided by the total energy produced. This perspective shows that the long-term rate of decarbonization of the energy system is about 0.3 percent per year. Plentiful natural gas, efficient turbines and thrifty end-use devices promise more energy delivered with less carbon during the next decades.
Uranium also decarbonizes. At the end of 1993 432 operating nuclear reactors prodded almost 20 percent of the world’s electricity. Even if a fraction of the 48 listed in 1994 as under construction never operate, the remainder assure a continuing nuclear contribution to decarbonization. The radioactive reactor products, which are toxic and also hard and slow to degrade, and potentially powerful explosives, must of course be safely isolated. Solar sources also decarbonize but continue to stumble over obstacles in energy storage and transport.
Consider decarbonization also as the diminishing carbon intensity of the economies of a range of countries. Measured as the ratio of kilograms of carbon to gross domestic product and taking into account fuelwood and other renewable sources of energy, the decarbonization of dozens of nations studied, including Turkey, Thailand and China as well as the United Kingdom, Germany and Japan, has advanced almost in parallel. Countries begin at different times from different situations, but once they begin to decarbonize, they advance at about the same rates, and irreversibly, so far. Between 1970 and 1993, even the gas-guzzling United States more than doubled the ratio of its income to carbon use, decarbonizing about 3 percent per year. The spectrum of achievement, from about 3 kilograms of carbon per dollar of output in China to less than 0.2 in Japan and France, shows the distance most of the world economy stands from leading practice. The carbon intensity of the Chinese and Indian economies resembles the Japanese, American and European at the outset of industrialization in the 19th century.
Fundamentally, decarbonization tracks a technological competition between combustible elements. In the hydrocarbons, the truly desirable element for energy generation is not the carbon but the hydrocarbon. The evolution of the atomic ration of hydrogen to carbon in the world fuel mix displays the gradual and unrelenting penetration of the energy market by the number one element of the periodic table (Figure 4, bottom).
All these analyses imply that during the next 100 years the human economy will clear most of the carbon from its system and move, via natural gas, to a hydrogen metabolism, Hydrogen, fortunately, is the immaterial material. It can be manufactured from something abundant, namely water, it can substitute for most solid, liquid and gaseous fuels in use, and the product of its combustion, water vapor, does not pollute. The next decades will see a vigorous growth in the hydrogen industry. Nightly nuclear heat seeking a market outlet can efficiently steam-reform natural gas into hydrogen and carbon dioxide, the latter permanently reinjected into the gas fields from whence it came. Later, heat, nuclear or solar, can neatly decompose water.
Hydrogen, of course, requires a partner, electricity, to provide action at a distance in a clean energy system. Since Edison began the commercial industry in the 1880s, the electrical system has grown in two neat pulses each lasting about 50 years, synchronized with long cycles of economic growth. A new pulse of growth should soon begin, in which electricity powers not only more information products but also more of the transport system, using linear motors. The magnetically levitated train soon to operate between Hamburg-Berlin inaugurates the way.
Combining analyses of efficiency and decarbonization startles many with the fact that national energy systems ranging from India to South Korea to France are heading in the right direction, toward micro-emissions. The way is long, but we are on the light path.
Land
Of all human activities, agriculture transforms the environment most widely. Corps and pasture occupy at least one-fifth the land surface, at least ten times as much as cities, towns and roads. Agriculture has consumed forests, drained wetlands, erased habitats and favored some plants over others in fierce green warfare. Farms, of course, also feed us.
Yields per hectare measure the productivity of land and the efficiency of land use. To 1940, yields per hectare of most crops advanced little, and more mouths required more land to feed them. During the past half century, ratios of crop to land for the world’s major grains-maize, rice, soybean and wheat have climbed, fast and globally. The rise in wheat in India, Egypt, Ireland and the U.S. shows the inception and the spread of the trend (Figure 6, top).
A cluster of innovations including tractors, seeds, chemicals and irrigation, joined through timely information flows and better organized markets, raised yields to feed billions more without clearing new fields. In fact, since mid-century global cropland has remained stable. Expansion in developing countries has offset contraction in Europe and North America.
As the century draws to a close, the earth is at a historic turning point in land use. The continuing diffusion of high yields and efficient land use permits the absolute reversal of the destruction of nature that has occurred for many centuries.
Societies chronically fear exhaustion of the potential to increase food supply. In reality, the agricultural production frontier is still spacious, even without invoking the engineering of plants with new molecular techniques. For many decades in Iowa, while yields have risen steadily, the average corn grower has managed only half the yield of the Iowa master grower, and the world grows only about 20 percent of the top Iowa farmer. The production ratio of the performers has not changed much since 1960. In Iowa the average performer lags more than 30 years behind the state of the art.
Even where diffusion proceeds at a moderate pace, the effects accumulate dramatically. In India, for example, by raising wheat yields farmers spared 42 million hectares, about the size of Sweden or California, if we compare the land actually harvested in 1991 with the land the farmers would have harvested at 1961-66 yield for the actual production. Globally, the land spared since 1960 by raising yields of grain, which make up more than half of all calories, equals the Amazon basin (Figure 6, bottom).
A single-minded concentration on land raises concern that side effects will harm the nature we seek to preserve. In fact, land requires little more clearing, tilling and cultivating for high yields than for low ones. Protecting lush foliage needs little more pesticide and usually less herbicide than sparse foliage. Luxuriant foliage also protects soil better from erosion. The law of diminishing returns applies to fertilizers, which farmers tend to use abundantly. In many areas yield gains now come by optimizing inputs such as nitrogen and phosphorus in step and lowering total application. In sum, careful management of the land we do use is likely to diminish the total fallout from food production. Most fallout is coextensive with land used.
What is a reasonable outlook for the land cropped for future population? Future calories per capita will likely lie between the 3,000 per day of a vegetarian diet and the 6,000 that include meat (counting dietary calories plus the calories fed to food and draft animals and not recovered in milk, meet and so on). Let us consider, as Paul Waggoner has done (Waggoner 1994) how much cropland a population of 10 billion, almost twice the present, could spare for wilderness or other purposes with that range of calories per capita. If farmers fail to raise global average yields from the present 2 tons grain equivalent per hectare, people will have to lower their daily portions to 3,000 calories to avoid further land clearing. But Irish wheat and American corn now average 8 tons per hectare. If farmers can lift the global average to 5,10 billion people on average can enjoy the diet 6,000 calories bring, and spare a quarter of the present 1.4 billion hectares of cropland. The quarter spared is about twice the size of Alaska. If future farmland on average yielded today’s U.S. corn, 10 billion eating an American diet could allow cropland the area of Australia to revert to wilderness.
Per hectare, annual world grain yields in fact rose 2.15 percent 1960-1994. If dynamics continue as usual, farmers will grow 8 tons per hectare around 2060, at the end of the decade in which the United Nations projects population to reach 10 billion From the Great Plains of America to the Great Plains of China, reversion of farms and ranches to woods and grasses will be a spreading, major environmental feature of the next decades, and beyond. And governments will avidly seek rationales to subsidize agriculture to keep it from contracting more rapidly than culture will allow.
Materials
We can reliably project more efficient energy, decarbonization and effectively landless agriculture. What about a companion dematerialization? I will define dematerialization primarily as the decline over time in weight of materials used to perform a given economic function.
Dematerialization would matter enormously for the environment. Excluding water and oxygen, in 1990 each American mobilized on average about 50 kilograms per day. Reducing the materials intensity of the economy could preserve landscapes and natural resources, lessen garbage and reduce human exposures to hazardous materials.
Over time new materials substitute for old. Successful new materials usually show improved properties per ton, thus leading to a lower intensity of use for a given task The idea is as old as the epochal succession from stone to bronze to iron. Our century has witnessed the relative decline of wood and the traditional metals and the rise of aluminum and especially plastics (Figure 7, top).
Modern examples of dematerialization abound. Since the early 19th century, the ratio of weight to power in industrial boilers has decreased almost 100 times. Within the steel industry, powder metallurgy, thin casting, ion-beam implantation and directional solidification as well as drop and cold forging have allowed savings up to 50 percent of material inputs in a few decades. In the 1970s a mundane invention, the radial tire, directly lowered weight and material by one-quarter below the bias-ply tires they replaced. An unexpected and bigger gain in efficiency came from the doubling of tire life by radials, so halving the use of material (and the piles of tire carcasses blighting landscapes and breeding mosquitoes). Lightweight optical fibers with 30 to 40 times the carrying capacity of conventional wiring and invulnerability to electromagnetic interference are ousting copper in many segments of the telecommunications infrastructure. The development of high-fructose corn syrup (HFCS) in the 1960s eliminated sugar from industrial uses in the United States. HFCS has five times sugar’s sweetening power on a unit-weight basis, with a proportional impact on agricultural land use.
Certainly many products–for example, cars, computers and containers–have become lighter and often smaller. Compact discs selling for less than $100 now contain 90 million home phone numbers of Americans, equivalent to the content of telephone books once costing $60,000 and weighing 5 tons. At midcentury, glass bottles dominated. In 1953 the first steel soft-drink can was marketed. Cans of aluminum, one-third the density of steel, entered the scene a decade later and by 1986 garnered more than 90 percent of the beer and soft-drink market. Between 1973 and 1992 the aluminum can itself lightened 25 percent. In 1976 polyethylene terephthalate resins began to win a large share of the market, especially for large containers previously made of glass.
Recycling, of course, diminishes the demand for primary materials and may thus be considered a form of dematerialization. No longer limited to resource-poor individuals and regions, during the past couple of decades recycling has regained standing as a generalized social practice in the U.S. and other societies with huge material appetites.
Difficulties arise in the more complex “new materials society” in which the premium lies on sophisticated materials and their applications. Alloys and composites with attractive structural properties can be hard to separate and recycle. Popular materials can be lighter but bulkier or more toxic. Reuse of plastics may be less economical than burning them (cleanly) for fuel or otherwise extracting their chemical energy. Most important, economic and population growth has multiplied the volume of products and objects. Thus, total wastes have tended to increase while declining per unit of economic activity (Figure 7, bottom).
By weight, construction materials make up about 40 percent of the materials Americans consume and thus form a significant metric. Although absolute use of physical-structure materials by weight has fluctuated, consumption per unit of economic activity has trended downward since 1970. Because energy materials such as petroleum constitute another 40 percent of our materials diet, increases in energy efficiency could also markedly dematerialize economies.
As yet, trends with respect to dematerialization are equivocal. Better and more complete data on materialization and dematerialization over long periods for the United States and the rest of the world need to be assembled and analyzed. Moreover, the heterogeneity of purpose of materials will never permit the performance of the materials sector to be summarized as simply as kilowatts and carbon can summarize energy or tons per hectare summarize land. A kilogram of iron does not compare with one of arsenic. But the promise dearly exists for what Robert Frosch, I and our colleagues call a superior “industrial ecology,” in which the materials intensity of the economy declines, wastes lessen and the wastes that are created become nutritious in new industrial food webs.
Water
We can get more value from each unit of energy, land and material. Can we squeeze more from a drop of water?
Total per capita water withdrawals quadrupled in the United States between 1900 and 1970, and overall personal consumption increased by one-third between just 1960 and the early 1970s (Figure 9). However, since 1975, per capita water use has fallen appreciably, at an annual rate of 1.3 percent. Absolute water withdrawals peaked about 1980.
Industry, alert to technology as well as costs, exemplifies the progress, although it consumes a small fraction of total water. Total industrial water withdrawals plateaued a decade earlier than total U.S. withdrawals and have dropped by one-third, more steeply than the total. More interesting, industrial withdrawals per unit of GNP (in 1982 dollars) have dropped steadily since 1940, when 14 gallons of water flowed into each dollar of output. Now the flow is less than 3 gallons per dollar. The steep decline taps many sectors, including chemicals, paper, petroleum refining, steel and food processing. After adjusting for production levels, not only intake but discharges per unit of production are perhaps one-fifth of what they were 50 years ago.
In manufacturing, technology as well as law and economics have favored frugal water use. More efficient use of heat and water usually go together, through better heat exchangers and the recirculation of cooling water. Legislation, such as the U.S. Clean Water Act of 1972, encouraged reduction of discharges and recycling and conservation as well as shifts in relative prices. Although water treatment may cost only about 5 percent of production, wastewater-treatment systems are expensive capital investments.
Despite the gains, the United States is far from most efficient practice. Water withdrawals for all users in the countries making up the Organization for Economic Cooperation and Development range tenfold, with the U.S. and Canada the highest. Allowing for differences in major uses (irrigation, electrical cooling, industry, public water supply), large opportunities for reductions remain. In the late 1980s over 90 percent of measured U.S. hazardous wastes were still wastewaters.
In the long run, with much higher thermodynamic efficiency for all processes, removing impurities to recycle water will require small amounts of energy. Dialytic membranes open the way to such efficient purification systems. Because hydrogen will be, with electricity, the main energy carrier, its combustion (if from seawater) may eventually provide another important source of fresh water, perhaps 200 liters per person per day at the level of final consumers, about one-fourth the current withdrawal in water-prudent societies such as Denmark. Importantly, as agriculture contracts spatially and irrigates more frugally; its water demand will shrink.
Population
l have demonstrated a revolution in factor productivity, whether energy, land, materials or water. The game to get more from less is old. In energy, global progress is documented for centuries. With land, the Chinese started long ago, but most of the world began only about 1940. 1940 also appears to have marked a crossing point for new materials. In water, U.S. industry joined the search about 1940, and the population more generally about 1970.
The catch for homo faber is that our technology not only spares resources but also expands our niche. Technology further adds to population by increasing longevity and decreasing mortality. Although fertility has also declined greatly; the role of new birth-control technologies in the decline has been small. Feedbacks may well also occur between population growth and density on the one hand and invention and innovation on the other.
Population provides a multiplier that determines total consumption. So far I have stressed ratios, not absolutes.
To see graphically how technology can change carrying capacity, consider the population history of Japan. From the establishment of the Tokugawa Shogunate about 1600 Japan insulated itself from outside technology until 1854 when American Commodore Matthew Perry reopened trade. In 1868 the Meiji restoration lessened the isolationist policy of the former imperial party, and Japan entered a period of great borrowing from the Occident. As evident in Figure 10, Japanese population growth since 1100 sorts perfectly into two pulses of growth. Tokugawa technology (and culture) and its medieval predecessors accommodated a gradual addition of 28 million over about five centuries to Japan’s earlier population of about 5 million. Meiji and Western technology keyed the opening of the niche to another 100 million or so in one century.
Reasoning about the link between technology and carrying capacity from the Japanese case, my colleague Perrin Meyer and I have speculated about the growth of the population of the U.S. We hypothesize a sequence of overlapping pulses of population growth centered on times of rapid economic expansion, the midpoints of tentatively identified 50-yearlong waves of economic growth. Technological innovations affecting resources, processes and products cluster in each economic wave and expand carrying capacity. The first pulse of population growth associates with wood, iron, steam, canals, and wool and cotton textiles; the second with coal, steel, railways, telegraphy and early electrification, and the third with oil, plastics, autos, widespread electrification, telephony, computers and pharmaceuticals. The fourth, emerging pulse revolves around natural gas, aviation and a host of information and molecular technologies. Daring to extrapolate our reasoning with a “superlogistic” curve using the center points of the growth pulses as the base points, we find the U.S. population saturating around 400 million in 2100, a total consistent with projections made by conventional demographic methods.
Clearly the limits to human numbers keep shifting. In any case, analysis of historic population data shows that the global rate of growth peaked at about 2.1 percent per year around 1970, as noted near the outset of this article. Fertility rates, the key factor, have been falling in most nations and are below the levels needed to replace current population in Europe and Japan. The difficulty is that we have no logic to predict future fertility, and simply fitting an equation, as we did for the U.S., is chancy. Globally, the pervasive economic and social effects of the information revolution could allow the increase in human numbers to 15 or 50 or 100 billion, or influence the fertile to choose not to reproduce. The question of future population appears quite open, as reflected in the spray of projections.
Conclusion
Population frames the challenge for green technologists. To maintain current levels of cleanliness with the 50 percent increase in population I think likely for the United States and the current level and kind of economic activity, emissions per unit of activity would need to drop by one-third. That is an easy target. An improvement of 1.5 percent per year reaches the target by 2020, 80 years early.
The challenge is much harder taking into account growing consumption. If economic activity doubles per capita roughly every 30 years, as it has since about 1800 in the industrialized countries, the result is an eightfold increase by 2100. Multiplied by population, the United States would have 12 times today’s emissions and demands on resources, other things being equal. This scenario of the “dirty dozen” requires micro- or zero emissions per unit of economic activity to maintain or enhance environmental quality In other words, Americans need to clean processes by more than one order of magnitude. More reassuringly, the annual cleaning need be about 2.5 percent.
In Europe and Japan population is stable or even shrinking, easing the magnitude of their environ mental challenges. The rest of the world, where most people live, faces the twin pressures of enlarging economies and populations. So in absolute terms the technical gains must be enormous.
But we have seen the outlines of how the gains can be made. In the long run, we need a smoke free system of generating hydrogen and electricity that is highly efficient from generator to consumer, food decoupled from acreage, materials smartly designed and selected for their uses and recycled, and carefully channeled water. In short, we need a lean, dry, light economy.
In truth, I exaggerate the challenge. With respect to consumption, multiplying income will not cause an American to eat twice as much as today in 2020 or eight times more in 2100, and even a mouth moving today from Lima to Los Angeles only triples its original caloric intake. With respect to production, history shows that the economy can grow from epoch to epoch only according to a new industrial paradigm, not by inflating the old. High environmental performance forms an integral part of the modern paradigm of total quality. The past half-century signals the preferred directions: the changeover from oil to gas, the contraction of crops in favor of land for nature, the development of a new ecology of materials use in industry, and diffusion of more efficient water use to farmers and residents as well as industries.
Economists always worry about trading off benefits in one area for costs in another. Hearteningly, we have seen that in general efficiency in energy favors efficiency in materials; efficiency in materials favors efficiency in land; efficiency in land favors efficiency in water; and efficiency in water favors efficiency in energy. The technologies that will thrive, such as electricity, will concert higher resource productivity. Prone to fail is a technology, such as biomass farming for energy, which brings into conflict the goal to spare land with the goal to spare carbon.
Some worry that the supply of a fifth major resource, ingenuity, will run short. But nowhere do averages appear near the frontier of current best practice. Simply diffusing what we know can bring gains for several decades. Moreover, science and technology are young. Aggressively organized research and development (R&D) is another innovation of the past 50 years. Many industries have systematized their search for better practice (“endogenized R&D” in the economics jargon) and have the productivity gains to show for it. Other industries, including much of the service sector which now forms the bulk of modern economies, and the enlarging public and non-profit sectors have improved slowly. Overall, society hardly glimpses the theoretical limits of performance.
Inevitably, sectors and societies will advance at unequal pace. We will continue to have laggards as well as pioneers. Problems will arise from the distribution of goods, the actions and interactions of bads, shocking and poorly tailored innovations, and social traps such as the well-known “tragedy of the commons,” which today sadly entangles the wild stocks of fish. Yet the long history of technical progress and its reach into more sectors during recent decades encourage. Perhaps the first Earth Day in 1970 was an inflection point.
Policy can interfere wastefully with dynamics-as-usual, where they are benign. For example, decarbonization mandates the phasing out of the coal industry worldwide over the next decades; the political system might prudently assist those who lose their livelihoods, but not with dollars for actual coal. Wise policy favors science, experimentation and fluidity, while addressing inequity and insecurity and insuring against catastrophe.
Families named Smith, Cooper, and Miller people our nation because until not long ago most of us beat metal, bent casks, and ground grain. Now few workers hold such jobs. So far, except in video, we are not named Programmer, Sub-Micron, and Genesplicer. We easily forget how much the modem world has changed and yet how early our day is. We forget the power of compounding our technical progress, even at one or two percent per year. Knowledge can grow faster than population and provide abundant green goods and services. The message from history is that technology, wisely used, can spare the earth. You can click on it.
Acknowledgments
The author thanks Arnold Grübler, Raphael Kasper, Robert Kates, Alan McGowan, Perrin Meyer, Nebojsa Nakicenovic, Donald Rogich, Paul Waggoner and Iddo Wernick.
FIGURES


Figure 1. Advances in technology enable people to obtain services more efficiently. Greater efficiency in our use of energy, materials, land and water could help diminish the burdens people place on the environment. One possible future is captured by the vision of the “buffalo commons”: jobs would concentrate in urban areas (as, for example, at busy Dallas-Forth Worth Airport, above, where 37,000 people work) as vast lands in the interior of North America return to a wild state. Restoration of tall grass prairie in the Midwest, as at the Konza Prairie Research Natural Area in Kansas (also above), has been guided by conservation organizations and will accelerated as highly productive agriculture frees additional land. (Above photograph courtesy of Dallas Fort Worth Airport.)
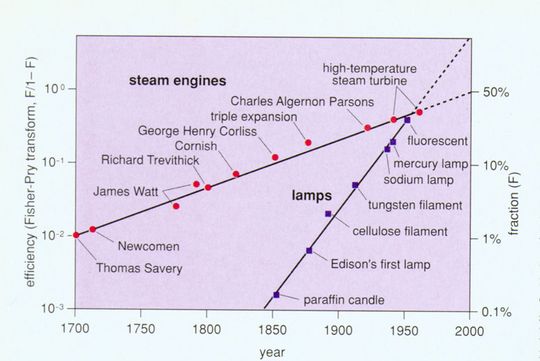
Figure 2. Energy efficiency is a tern of modern invention, but the efficiency of energy-conversion technologies has been increasing for hundreds and probably thousands of years. Improvements in motors and lamps are analyzed here as a logistic (sigmoid) growth process with a linear transform that normalizes the data to ease comparison. (From Ausubel and Marchetti, in press.)
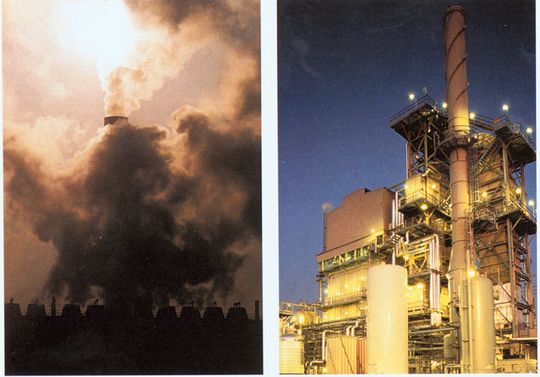
Figure 3. Decarbonization of the world’s energy mix moves the economy from dependence on carbon-heavy fuels, responsible for black lung, oil spills and large releases of climate-changing greenhouse gases. A power station in Bitterfeld, Germany (kft), burned lignite, or “brown coal,” contributing to Eastern Europe’s severe air-pollution problem. The author envisions a cleaner energy economy based on hydrogen, whose combustion produces water vapor. At right a California plant produces hydrogen by steam reforming of natural gas. (Right photograph courtesy of Air Products and Chemicals, Inc.)
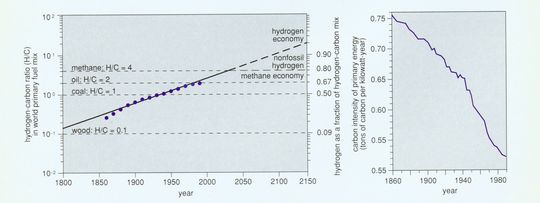
Figure 4. World primary energy sources have declined in carbon intensity since 1860. The evolution is seen in the ratio of hydrogen (H) to carbon © in the world fuel mix, graphed on a logarithmic scale, analyzed as a logistic growth process and plotted in the linear transform of the logistic curve (left). After Marchetti 1985). Wood has an effective hydrogen-to-carbon ratio of 0.1, coal 1, oil 2, and natural gas 4. Progession of the ratio above natural gas (methane, CH4) requires production of large amounts of hydrogen fuel without fossil energy. Carbon intensity can also be calculated as the ratio of the sum of the carbon content of all fuels to the sum of the energy content of all primary energy sources (right). For such a calculation carbon emission in tons per kilowatt-year average: wood, 0.84, coal, 0.73; oil 0.55; and gas, 0.44. (From Nakicenovic, in press).
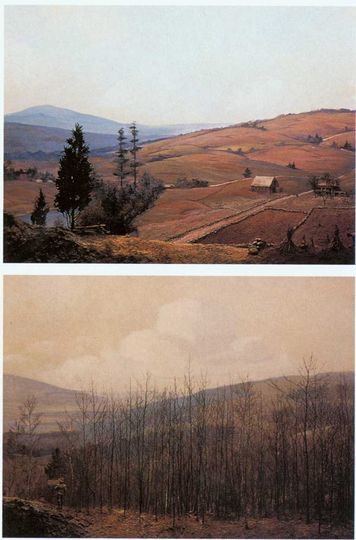
Figure 5. Much American land cleared by early settlers has reverted to nature as a result of changes closely related to technological progress and the increasing ability to grow more crops per acre. As better transport and machines made farming the rich soils of the Midwest highly profitable, New England farmers abandoned the rocky fields they had cleared. Dioramas on display at the Harvard Forest in Petersham, Mass., document the return of New England to forest. This pair shows the landscape around Petersham in 1830, at the height of cultivation, and a century later, when volunteer pines and the maturing hardwoods that followed them filled the landscape. (Photographs courtesy of the Fisher Museum at Harvard Forest.)
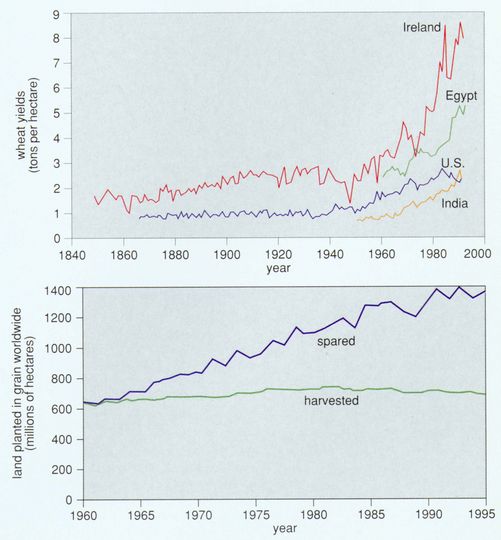
Figure 6. Rising yields of wheat on four continents (top) illustrate progress in agricultural productivity. Improved yields have allowed the global area actually harvested for grain to remain stable at around 600 million hectares (bottom). “Land spared” is the amount of land that would have been needed to produce actual grain crops with the 1960 average yield. (Data from Mitchell 1980, Yearbooks of the Food and Agriculture Organization and the U.S. Department of Agriculture’s “PS&D View,” a database.)
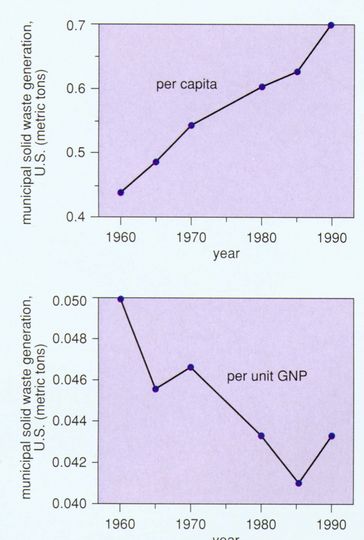
Figure 7. Countervailing trends can be detected in the use of materials in the US. In the top graph, production data are divided by the Gross National Product in constant (1982) dollars and normalized to 1940. The use of heavy materials such as steel has been supplanted in the economy by lighter materials, especially plastics. Since 1970 even aluminum and the agricultural minerals, phosphates and potash, have declined in relative use. Municipal solid-waste generation, however, has grown steadily on a per capita basis. In relation to GNP, solid-waste generation dropped 1960-19185 but climbed again recently. (From Wernick et al., in press. Data from U.S. Bureau of the Census 1975 and 1993; U.S. Environmental Protection Agency 1992.)
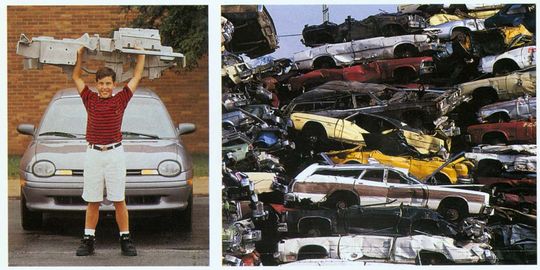
Figure 8. Auto manaufacturing today uses plastics and lightweight metals, exemplifying dematerialization, the trend toward higher materials and products per unit of economic activity. A Chrysler demonstration car, the Neon Lite, includes a lightweight instrument panel made of magnesium (left). Yet total wastes have risen in the U.S. with economic and population growth. At right, crushed automobiles pile high at a Philadelphia scrap-metal reclamation center. (Left photograph courtesy of Chrysler Corporation.)
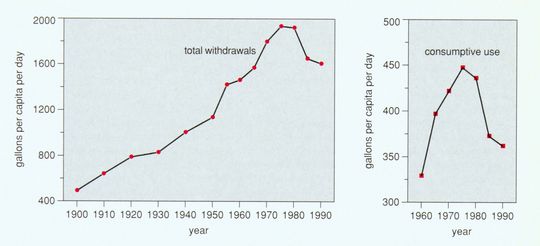
Figure 9. Total per capita water withdrawals quadrupled in the U.S. between 1900 and 1970, and overall personal consumption (right) increased by one-third between 1960 and the early 1970s. Since 1975, however, per capita water use has fallen annually 1.3 percent. Industrial withdrawals per unit of GNP have dropped steadily since 1940, encouraged by technology as well as law and economics. Data from other nations show that the U.S. is far from most efficient practice. (Data from U.S. Bureau of the Census 1975 and 1993.)
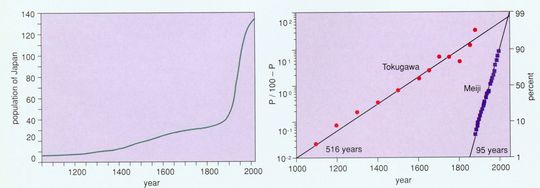
Figure 10. History of Japanese population growth shows how technology changes carrying capacity. Under the Tokugawa Shogunate from about 1600 to 1854, Japan insulated itself from outside technology. The right-hand graph decomposes the population data into a pair of logistic growth pulses in linear form. The pulse the Tokugawa Shoguns took to its culmination was centered in 1537, required 516 years to grow from 10 percent to 90 percent of its extent, and saturated at 28 million people (on top of a pre-existing level of 5 million). The Meiji pulse, centered in 1950, required 95 years, and is saturating now with an addition of 103 million. (Meyer 1994. Data from Tsuneta Yano Memorial Society 1993 and Taeuber 1958.)

Figure 11. Growing consumption raises the challenge of saving resources through technology. Since about 1800 in industrialized countries, economic activity has doubled per capita roughly every 30 years. The contrast between consumption in developed and developing countries is illustrated by the “global family portrait” developed by the Material World project, which photographed typical families with their possessions around the world. Shown here are the Skeen family of Pearland, Texas, and the Yadev family of Ahraura, India. (From Material World, Sierra Club Books 1994.)
Bibliography
Ausubel, J. H. 1992. Industrial ecology: Reflections on a colloquium. Proceedings of the National Academy of Sciences 89(3):879-884.
Ausubel, J. H. 1991. Energy and environment: The light path.Energy Systems and Policy 15(3):181-188.
Ausubel, J. H., and C. Marchetti. 1996. Elektron: Electrical systems in retrospect and prospect.Daedalus 125(3):139-169.
Ayres, R. U. 1989. Energy Inefficiency in the US Economy: A New Case for Conservation. RR-89-12. Laxenburg, Austria: International Institute for Applied Systems Analysis.
Ayres, R. U. 1994. Information, Entropy, and Progress. New York: American Institute of Physics.
Banks, R. B. 1994. Growth and Diffusion Phenomena. Berlin: Springer-Verlag.
Bernardini, O., and R. Galli. 1993. Dematerialization: Long term trends in the intensity of use of materials and energy. Futures 25(4):431-148.
Boserup, E. 1981. Population and Technical Change: A Study of Long-Term Trends. Chicago: University of Chicago Press.
Curzio, A. Q., M. Fords and R. Zoboli, eds. 1994. Innovation, Resources, and Economic Growth. Berlin: Springer-Verlag.
Frosch, R. A. 1992. Industrial ecology: A philosophical introduction. Proceedings of the National Academy of Sciences 89(3):800-803.
Frosch, R. A. 1994. Industrial ecology: Minimizing the impact of industrial waste. Physics Today (November):63-68.
Graedel, T E., and B. R. Allenby. 1995. Industrial Ecology. Englewood Cliffs, New Jersey: Prentice-Hall.
Grübler, A. 1994. Technology. In Changes in Land Use and Land Cover, eds. W. B. Meyer and B. L. Turner. Cambridge, U.K.: Cambridge University Press, pp. 287-328.
Grübler, A., and N. Nakicenovic, eds. 1991. Diffusion of Technologies and Social Behavior. Berlin: Springer-Verlag.
Grübler, A., and H. Nowotny. 1990. Towards the fifth Kondratiev upswing: Elements of an emerging new growth phase and possible development trajectories. International Journal of Technology Management 5(4):431-171.
Herman, R., S. A. Ardekani and J. H. Ausubel. 1989. Dematerialization. In Technology and Environment, eds. J. H. Ausubel and H. E. Sladovich. Washington, D.C.: National Academy Press, pp. 50-69.
Hirschman, C. 1994. Why Fertility Changes. Annual Review of Sociology 20:203-233.
Homer-Dixon, T. 1994. The ingenuity gap: Can poor countries adapt to resource scarcity? Toronto: Peace and Conflict Studies Program, University of Toronto.
Kates, R. W. 1996. Population, technology and the human environment: A thread through time. Daedalus 125(3):43-72.
Kelley, A. C. 1988. Economic consequences of population change in the Third World. Journal of Economic Literature XXVI:1685-1728.
Lutz, W., ed. 1994. The Future of World Population Growth: What Can We Assume Today? London: Earthscan.
Marchetti, C. 1985. Nuclear plants and nuclear niches. Nuclear Science and Engineering 90:521-526.
Marchetti, C. 1989. How to solve the CO2 problem without tears. International Journal of Hydrogen Energy 14(8):493-506.
Marchetti, C., P. S. Meyer and J. H. Ausubel. 1996. Human population dynamics revisited with the logistic model: How much can be modeled and predicted?Technological Forecasting and Social Change 52:1-30.
Matthews, A. 1992. Where the Buffalo Roam. New York: Grove Weidenfeld.
Meyer, P. 1994. Bi-logistic growth.Technological Forecasting and Social Change 47:89-102.
Mitchell, B. R. 1980. European Historical Statistics 1750-1975, 2nd ed. New York: Facts on File.
Nakicenovic, N. 1989. Technological Progress, Structural Change and Efficient Energy Use: Trends Worldwide and in Austria, International Part. Laxenburg, Austria: International Institute for Applied Systems Analysis.
Nakicenovic, N. 1996. Decarbonization. Daedalus 125(3):95-112.
Organization for Economic Cooperation and Development. 1991. The State of the Environment. Paris: OECD.
Perez, C. 1983. Structural change and the assimilation of new technologies in the economic and social system. Futures 15(5):357-375.
Rogich, D.G., et al. 1993. Materials Use, Economic Growth, and the Environment, presented at the International Recycling Congress and REC ’93 Trade Fair. Washington, D.C.: U.S. Bureau of Mines.
Taeuber, I. B. 1958. The Population of Japan. Princeton: Princeton University Press.
Tsuneta Yano Memorial Society, ed. 1993. Nippon: A Chartered Survey of Japan, 1993/1994. Tokyo: Kokusei-Sha.
Turner, B. L., II, R. W. Kates, J. F. Richards, J. T. Matthews and W. B. Meyer. 1990. The Earth as Transformed by Human Action. New York: Cambridge University Press.
United Nations Population Division, Department of Economic and Social Information and Policy Analysis. 1994. World Population Prospects: The 1994 Revision. New York: United Nations.
U.S. Bureau of the Census. 1975. Historical Statistics of the United States, Colonial Times to 1970. Washington D.C.: U.S. Government Printing Office.
U.S. Bureau of the Census. 1993. Statistical Abstract of the United States: 1992, 112th ed. Washington, D.C.: U.S. Government Printing Office.
U.S. Bureau of Mines. 1990. The New Materials Society. Volumes I-III. Washington, D.C.: U.S. Government Printing Office.
U.S. Environmental Protection Agency. 1992. Characterization of Municipal Solid Waste in the United States: 1992 Update. Final Report, No. 530-R-92-019. Washington, D.C.: Environmental Protection Agency.
U.S. Geological Survey. 1993. Estimated Use of Water in the United States in 1990. Circular 1081. Washington, D,C.: U.S. Government Printing Office.
U.S. Geological Survey, National Water Summary 1987-Hydrologic Events and Water Supply and Use. Water Supply Paper 2350. Washington, D.C.: U.S. Government Printing Office, 1987, pp. 81-92.
Waggoner, P E. 1994. How Much Land Can Ten Billion People Spare for Nature? Ames, Iowa: Council for Agricultural Science and Technology.
Wernick, I. K., and J. H. Ausubel. 1995. National materials flows and the environment. Annual Review of Energy and the Environment 20:463-492.
Wernick, I. K., R. Herman, S. Govind and J. H. Ausubel. 1996. Materialization and dematerialization: Measures and trends.Daedalus 125(3):171-198.
Jesse H. Ausubel is director of the Program for the Human Environment and Senior Research Associate at The Rockefeller University and a program officer of the Alfred P. Sloan Foundation in New York City. From 1977 to 1988, he was associated with the National Academy complex in Washington as a fellow of the National Academy of Sciences, then as a staff officer with the National Research Council Board on Atmospheric Sciences and Climate, and finally as director of programs for the National Academy of Engineering, where he developed and oversaw studies on the performance of technology-intensive sectors of U.S. industry and on the diffusion and globalization of technology. In recent years, he has helped originate industrial ecology, the study of the networks of flows of materials and energy in industry. Educated at Harvard and Columbia, Ausubel served on the U.S. Environmental Protection Agency’s Science Advisory Board. Address: Program for the Human Environment, The Rockefeller University, 1230 York Avenue, Box 234, New York, NY 10021-6399. Internet: phe@mail.rockefeller.edu.