Area of Research: Technology & Human Environment
Environmental Populism
On September 23, 2019 PHE Senior Research Associate Iddo Wernick delivered at talk on ‘Environmentalism and Populism‘ at at meeting of the Breakthrough Institute in Middleburg, Virginia.
Earth at night – if the rest of the world lived like America
Technology and environment
Elektron: Electrical Systems in Retrospect and Prospect
And I saw something like the color of amber,
Ezekiel 1:27 (circa 595 b.c.)
like the appearance of fire round about enclosing it;
from what appeared to be his loins upward,
and from what appeared to be his loins downward,
I saw what appeared to be fire,
and there was a brightness round about him.
In the ancient world, electrum (Hebrew) or elektron (Greek) was the material amber. Amber, when rubbed and electrified, preferably with cat fur, moved and lifted dust specks and small objects. The Greeks first identified electricity by its g odlike capacity for action at a distance. This capacity and its control have been and will continue to be the trump cards in the invention and diffusion of electric machinery.
While its power and magic are old, electricity as an applied technology is young, with a history of barely more than a century. Two thousand five hundred years passed between Ezekiel and Thomas Edison. Today the electrical system can place power in pre cise positions in space with an immense range of capacity, from nanowatts to gigawatts. This spatial fingering is made possible by electrical conductors that are immersed in insulating space or solids. The conductors, which are basically metals, are impen etrable to electric fields and can modify and draw them into long thin threads reaching an office, home, or the memory cell in a computer chip.
Electromagnetic waves, as well as wires, transport electrical energy into space. Microwave guides and optical fibers resemble wires fingering into space. Efficient interfaces between the two modes of transport have developed, greatly extending the pano ply of gadgets that transform electricity into useful actions.
Electrical technology is one of the few technologies that emerged straight from science and organized research. The lexicon of electricity-ohms, amperes, galvanometers, hertz, volts-is a gallery of great scientists of the eighteenth and nineteenth cent uries. Applications of electricity were the subject of the first systematic industrial research laboratory, established in 1876 by Edison in Menlo Park, New Jersey. There, Edison and his colleagues made the phonograph in 1877, a carbon-filament incandesce nt lamp in 1879, and myriad other inventions.
The earliest attempts to apply electricity came from laboratories studying electrostatic phenomena. Medicine, always curious to test new phenomena in the human body that promised healing or strength, led the way. Many claims sprang from the spark, shoc k, and sizzle of electrostatic phenomena. Eighteenth-century scientists reported that electric charges made plants grow faster and that electric eels cured gout. They sent electrical charges through chains of patients to conquer disease and, as among the clientele of Dr. James Graham’s fertility bed in London, to create life. C. J. M. Barbaroux, later a leader of the Girondist faction in the French Revolution, enthused in 1784:
O feu subtil, âme du monde,
Bienfaisante électricité
Tu remplis l’air, la terre, l’onde,
Le ciel et son immensité.1
Electricity brought to life the subject of Dr. Frankenstein’s experiments in Mary Shelley’s famous novel, published in 1818. An application of electricity also vitalized the ancient Egyptian in Edgar Allan Poe’s 1845 story “Some Words with a Mummy.”2 Upon awakening, the mummy observes to the Americans gathered round him, “I perceive you are yet in the infancy of Galvanism.” Later in the nineteenth century the Swedish playwright August Strindberg wrapped himself in current s to elevate his moods and even gave up writing to pursue electrical research until he badly burned his hands in an ill-planned experiment.
Popular imagery notwithstanding, the high-voltage, low-current electrostatic phenomena were at the core of electric research until only about 1800, when Alessandro Volta announced his invention of the battery. Volta introduced the more subtle low-volta ge, high-current game of electrodynamics. Twenty-five years linked the flow of electric currents to the force of electric magnets. Another twenty-five years bound the two productively into the electric dynamo and motor.
Among the key figures in the electromechanical game was an American, Joseph Henry, who, with the Englishman Michael Faraday, contributed a series of discoveries leading to practical electric generators. Tracing a bright path back to Benjamin Franklin, electricity was one of the first fields of research in which the United States assumed a leading role, and one of the first technologies to diffuse earliest in America. As we shall see, once the interface between mechanical and electrical power had been i nvented, the niche for expansion proved immense.3
Power for the Workshop
Since the Middle Ages, water wheels had provided the primary drive for grinding grain, fulling cloth, working metal, and sawing wood. But mechanical power drawn from water or wind did not permit action at a distance, except through even more mechanical devices. These could become sophisticated and baroque. For example, a cable system spread 1 megawatt of mechanical power from the falls of Schaffhausen, Switzerland, to the industrial barracks around them. The mechanically drawn San Francisco cable cars continue to delight visitors but only travel a distance of one or two kilometers.
Powered by water, workshops had to be riparian. “Zavod,” the Russian word for a plant, literally means “by the water.” Ultimately, steam detached power from place. Over a period of decades, steam engines overtook water wheels. In America, steam needed one hundred years to supersede water. Though we recall the nineteenth century as the age of steam, water did not yield first place until 1870. The primacy of steam in America would then last just fifty years (Figure 1).
Figure 1. Sources of Power for Mechanical Drives in the United States.Note: The upper panel shows the absolute horsepower delivered by each type and their sum. The lower panel shows the fraction (F) of the total horsepower provided by each type, according to a logistic substitution model.Data Source: Warren D. Devine, Jr., “From Shafts to Wires: Historical Perspective on Electrification,” Journal of Economic History 43 (1983): 347_372; Table 3, p. 351.
At first, steam preserved the layout of the factory. It simply provided more flexible and dependable mechanical energy. The small early steam engines usually operated individual devices. A leap forward came with the advent of the single, efficient, cen tral steam station to serve all the machinery inside a plant. Pulleys rotating above the heads of the workers provided power for their diverse machines via vibrating and clapping belts. But the network of beams, blocks, cords, and drums for transmitting t he steam power to the machinery on the floor encumbered, endangered, and clamored.
The electric motor drive, which emerged around 1890, revolutionized the layout of the factory. The first era of electrical systems commenced. The steam engine now ran an electric generator that penetrated the factory with relatively inconspicuous coppe r wires carrying electricity, which in turn produced mechanical energy at the point of consumption with an electric motor. Here was the seed of modern manufacturing. The electric motor drive permitted the factory machines to be moved along the production sequence, rather than the reverse.
One might suppose that the superior electric transmission, with a generator at one end and motors at each machine, would quickly supplant the old mechanical system. In fact, as Figure 1 shows, the process required fifty years. Resis tance was more mental than economic or technical. In 1905 the influential American historian and journalist Henry Adams chose the images of the Virgin and the dynamo around which to write his autobiography.4 The dynamo symbolized the dangerous, inhuman, and mindless acceleration of social change.
Power for the Region
By the time arcs and lamps emerged from Mr. Edison’s workshops, the generator could illuminate as well as grind, cut, and stamp. But the paradigm of the single generator for the single factory was soon superseded by the idea of a generator, or, better yet, a power plant, serving an entire community.
At first, electric companies were necessarily small. Technology for the transport of electricity particularly limited the scale of operations. The original Edison systems were based on low-voltage direct current (dc), which suffered drastic energy loss es over distance. Each piece of territory thus required its own company, and founding a new company meant filling a piece of territory or market niche.
Consider eastern Pennsylvania, a coal-and-steel region where some of the earliest Edison utilities began (Figure 2). Entrepreneurs swarmed the area to spread the successful innovation. About 125 power-and-light companies were establ ished between the middle 1880s and early 1920s, with 1897 being the year of peak corporate fertility. The rush to form companies was a cultural pulse, diffused by imitation.5
Figure 2. Founding and Consolidation of Electric Companies in the United States.Note: The main figure presents the two sets of data shown in the inset panel fitted to a linear transform of the logistic curve that normalizes each process to 100 percent, with estimates for the duration of the process, its midpoint, and saturation l evel indicated.Data Source: Pennsylvania Power and Light, Corporate History in nine volumes, Origin and Development of the Company, vol. 1, Allentown, Pa., 1940.
The evolution of technology to transport electricity, combined with the increase in the density of consumption (kW/km2), made higher transmission voltages economical and progressively coalesced companies. The key technology, first explored i n the 1880s by the inventor Nikola Tesla, was alternating current (ac), which could be raised in voltage through transformers and then transmitted long distances with low losses. The merger wave crested in 1914. By 1940 the resulting process left only Pen nsylvania Power and Light in operation.
When companies cover a geographical space, their natural tendency is to coalesce, like soap bubbles, especially if a technology permits the larger scale physically and encourages it economically. Several non-technical factors, including government and consumer fears about monopoly, can set limits on scale. Early in the century, Samuel Insull’s “electricity empire,” centered in Chicago, evoked public regulation, which became normal for the industry. Rapid growth and change usually elicit external regula tion. Still, the systems grow in the long run, as we shall see.
In the provision of electric power, the overriding independent variable is spatial energy consumption. Its increase leads to higher-capacity transport lines using higher voltage, making it possible to transport energy over longer distances with generators having higher power. This “higher and higher” game led the United States from the 10-kilowatt generator of Edison to the 1-gigawatt generators of today, one hundred thousand times larger.6
In fact, the expansion divides into two eras, as we see in Figure 3, which shows the evolution of the maximum line capacity of the US electric system. For the line-capacity indicator, we take over time the square of the highest volt age that is operational. Although various factors lower actual line capacity in practice, this indicator provides a consistent measure of power capacity for analysis of long-term trends.7 The maximum line capacity grows in two waves, one centered in 1921 and the second fifty-four years later in 1975.
Figure 3. Capacity of Top US Power Lines.Note: The units are kV2/1,000-a rough measure of power capacity. This figure as well as Figures 4, 6, and 8 show a two-phase process analyzed as a “bi-logistic” normalized with a l inear transform. In essence, one S-shaped growth curve surmounts another. The actual values are the sum of the two waves, once the second wave is underway. See Perrin S. Meyer, “Bi-logistic Growth,” Technological Forecasting and Social Change 47 (1 994): 89_102.Data Source: Edison Electric Institute, Washington, D.C.
We label the first wave “Steinmetz,” for Charles Proteus Steinmetz, the founding leader of the engineering department of the General Electric Company (GE) and a symbol of the fruitful interaction of mathematical physics and electrical technology.8 Following the pioneering work of Tesla, Steinmetz began investigating the problems of long-distance transmission and high-voltage discharges around 1905. The spectacular success of GE in subsequent decades testifies to the timel iness of Steinmetz’s innovations. New alternating-current systems and related gadgets made huge profits for GE and the other leading equipment supplier, Westinghouse, and incidentally killed many small-scale utilities, as in Pennsylvania.
The second pulse of growth in line voltage reaches a temporary ceiling at about 1.5 megavolts. Interestingly, the stretches of innovative activity, as measured by the interval to achieve 10 to 90 percent of the system development, cover only about half the time of electricity’s waves of growth. Two to three decades of rapid expansion are digested in a comparably long period of stability and consolidation, a frustrating cycle for engineers. Again the limit may not be technical or economic, but social. S ociety tailors the expanded system to fit its norms for safety and harmony. One constraint is available rights-of-way, which are very limited at present.
Because the area of the United States is constant and filled by the electrical network, total generating capacity approximates the spatial density of consumption. The growth in installed generating capacity also splits into two pulses, centered around 1923 and 1971 (Figure 4). At peak times operators experience the most rapid change and customers suspect the operators’ ability to handle it. During the second wave, annual growth in consumption peaked in the 1950s and 1960s at more th an 10 percent per year for many US utilities. The system in the Northeast blacked out one day in November 1965, prompting regional power pooling arrangements. To address concerns about the reliability of the entire network, the industry consorted to form the Electric Power Research Institute, which opened its doors in 1973 under the leadership of Chauncey Starr, for whom we name electricity’s second wave.9
Figure 4. Installed Electric Generating Capacity in the United States.Data Source: US Bureau of the Census, Historical Statistics of the United States (Washington, D.C.: US Bureau of the Census, 1978); and US Bureau of the Census, Statistical Abstract of the United States (Washington, D.C.: US Bureau of th e Census, 1978, 1981, 1984, 1986, 1989, 1991, 1992, 1994).
The current pulse of growth in US generating capacity reaches a ceiling around 765 gigawatts. The actual system growth has exceeded 90 percent of the niche, which in our view explains the recent slowdown in the building of power plants, nuclear or othe r, in the United States. The system anticipated the growth in demand that is tuned to economic development and technological diffusion, boxed into the long, roughly fifty-year economic cycles that have characterized the last two hundred years.10 At the end of the cycles, demand lags and overcapacity tends to appear.
Will the higher-and-higher game resume? In both line voltage and generating capacity, the growth in the second electrical wave exceeded the first by more than an order of magnitude. If the pattern repeats, the increase in electricity consumption will l ead to ultra-high voltage lines (for example, + 2 megavolts) with higher capacity (for example, 5 or 10 gigawatts) and continental range. The great advantage of continental and intercontinental connections is that standby reserves and peak capacity can be globalized. The worldwide load would be smoothed over the complete and immanent solar cycle. Generators could also become very large, with according economies of scale.
If the system evolves to continental scale, the much-discussed superconductivity at room temperature might not revolutionize transmission after all. Energy lost in transport and distribution is a stable 10 percent, a huge amount in absolute terms, but too small to change the basic economics if 2-megavolt lines cover the continents. Superconductivity could, however, bring about a revolutionary drop in the size of machinery, thereby permitting the construction of units of larger capacity.
Continental scale surely means increased international trade in electricity. All territory looks the same to electricity. If available technology is employed, electricity will stream across borders despite the political barriers that typically impede t he easy flow of goods and ideas. Today Europe exchanges electricity almost freely. Italy buys from France the equivalent production of six 1-gigawatt nuclear reactors either via direct high-voltage lines or through Switzerland. Electricity trade could for m a significant component of international payments over the next fifty to one hundred years, requiring reorganization and joint international ownership of the generating capacity. Electricity trade between Canada and the northeastern United States alread y elicits attention.
Utilization and Capacity
The utilization factor of generation plants counts heavily in the economy of the system and indicates the quality of its organization. The US electric industry searched successfully between 1910 and 1940 for efficient organization, notwithstanding the Great Crash of 1929, as the average annual utilization climbed from two thousand to above four thousand hours, a utilization rate of about 50 percent (Figure 5). The rise owed to spatial integration and the reduction of reserves conseq uent to the introduction of high-capacity transport lines with increasing operating voltage as well as the coordination of network dispatch to use plants more effectively.
Figure 5. The Rate of Utilization of US Electric Generating Plants.Data Source: US Bureau of the Census, Historical Statistics of the United States (Washington, D.C.: US Bureau of the Census, 1978); and US Bureau of the Census, Statistical Abstract of the United States (Washington, D.C.: US Bure au of the Census, 1978, 1981, 1984, 1986, 1989, 1991, 1992, 1994).
Since 1940 the system appears to have fluctuated around a utilization rate of 50 percent. Generators with low capital cost and high variable cost combine with base-loads plants with high capital cost and low variable cost to determine the current usage level. Although the utilization factor surely has a logical upper limit quite below 100 percent, even with high-voltage lines having continental reach, a 50-percent national average appears low, notwithstanding scorching August afternoons that demand ext ra peak capacity.
Breaking the 50-percent barrier must be a top priority for the next era of the industry. Otherwise, immense capital sits on its hands. One attractive way to make electric capital work around the clock would be to use plants at night. The mismatched tim ing of energy supply and demand existed when water power dominated. Pricing, automation, and other factors might encourage many power-consuming activities, such as electric steel-making, to go on the night shift. Nuclear heat, generating electricity by da y, could of course help to make hydrogen at night. The ability to store hydrogen would make the night shift productive.
The nearness of overcapacity in the electrical system also creates suspicion that forecasting within the sector has not been reliable. Analyses of projections of total electricity use made by the US Department of Energy and others fuel the suspicion. R eflecting a period when electricity consumption had doubled in spans of ten years, in 1978 federal officials projected an increase by 1990 from 2,124 terawatt hours to 4,142 terawatt hours.11 The actual level for 1990 was 2 ,807 terawatt hours.
Can we do better? Fitting the data for total utility electric use to our model with data through 1977 yields an estimated level of about 2,920 terawatt hours for the growth pulse now ending (Figure 6). Net generation in 1993 was 2,8 83 terawatt hours. Projecting electricity demand matters because it influences investments in capacity. Accurate projections might have lessened the pain for the utilities, which ordered and then canceled plants; the equipment suppliers, who lost the orde rs; and consumers, who ultimately pay for all the mistakes.
Figure 6. Total US Electric Consumption.Note: Here and in Figure 8 the empty circles indicate periods of overlap in the sequential growth waves. Assigning the exact values to each wave during the periods of overlap is somewhat arbitrary.Data Source: US Bureau of the Census, Historical Statistics of the United States (Washington, D.C.: US Bureau of the Census, 1978); and US Bureau of the Census, Statistical Abstract of the United States (Washington, D.C.: US Bureau of the Census, 1978, 1981, 1984, 1986, 1989, 1991, 1992, 1994).
Power for the Home
As suggested earlier, electricity is a spatial technology. Conquering a territory means connecting with potential users. We tend to think that almost everyone was connected soon after the first bulb was lit, but in fact the process extended gradually over fifty years and culminated even in the United States only in mid-century (Figure 7). Although slowed by the Great Depression, non-rural hookups reached 90 percent of the market by 1940. Rural areas joined the grid about one generat ion later than cities, reaching a midpoint of the process in 1943 versus 1920 for the townsfolk. This interval measures the clout of rural politicians, who secured subsidies for the costly extension of power lines to areas of low population density, as we ll as the conservatism of the countryside.
Figure 7. Percentage of US Homes with Electric Service.Data Source: US Bureau of the Census, Historical Statistics of the United States (Washington, D.C.: US Bureau of the Census, 1978).
The data further confirm that electricity’s first century has encompassed two eras. During the developmental spread of the system until about 1940, most electricity went for industry and light, substituting for other energy carriers in already existing market niches. In the second era, electricity powered new devices, many of which could not have performed without it, such as televisions and computers. Most of the new demand came in the residential and commercial sectors.
Average residential consumption has increased by a factor of ten since 1940 and appears in our analyses to saturate in the 1990s at about 10,000 kilowatt hours per year. One might say that the customer is the home, not the human. Home appliances have i ncreased by the tens and hundreds of millions: refrigerators, video-cassette recorders, vacuum cleaners, toasters and ovens, clothes washers and dryers, dishwashers, air conditioners, space heaters, and, more recently, personal computers, printers, and fa x machines.
We emphasize the residential because it is becoming the number-one consumer. Residential consumption has grown faster than other major sectors over the past decades and in 1993 overtook industrial consumption in the United States. The number of housing units has grown sevenfold in the United States since 1900, while the number of people has tripled, as residents per unit have declined and second homes increased. 12 As the second wave of electrification reaches its culmina tion, the residential share appears destined to plateau at about 35 percent of the total use of electricity, more than twice its share of the first wave. In a third wave of electricity, residential consumption may grow only at the same rate as overall con sumption, or, if life-styles continue to include more home space and reduced working time, at an even faster rate.13 Californians already spend more than 60 percent of all their time at home indoors.14 So do New Yorkers and Indians.
Cleaning the Human Environment
In the absence of electricity, we heat, light, and power our homes and workplaces with wood, coal, kerosene, oil, manufactured city gas, and lesser fuels. Electrification has thus meant a cleaner, safer, and healthier environment at the level of the en d-user, once protections against shock and other hazards were properly wired into the system. Dangers associated with open fires and smoke diminished. Better-ventilated homes and workplaces lessened exposure to influenza, pneumonia, tuberculosis, diphther ia, measles, whooping cough, scarlet fever, and other airborne threats. Modern refrigeration in homes, shops, trucks, and railroad boxcars reduced the numerous waterborne gastrointestinal threats.
Environmentally, electricity concentrates pollution at a few points. At these points we can deal with the problems or not. The main question then becomes: What is the primary energy source for the generation? The most wanted environmental culprit is ca rbon, and so the main environmental challenge for electricity may be summarized by the measure of the carbon intensity of electricity production, for example, the ratio of carbon by weight to kilowatt hours generated.15 In the United States, this ratio fell by half between 1920 and 1940, from about 500 metric tons of carbon per gigawatt hour produced to about 250. Since the 1940s, the US ratio has fallen below only about 200 metric tons per gigawatt hour and has remained ra ther flat in recent decades because coal has gained markets in electric power plants, offsetting efficiency gains in the operations of the plants as well as gains in terms of reductions that oil and especially gas would have contributed. Many other countr ies have continued to create more watts with fewer carbon molecules. The powerful underlying evolution of the energy system from coal to oil to natural gas to nuclear or other carbon-free primary sources will bring reductions.16 The world appears a bit past the middle point of a decarbonization process that will take another 150 years for completion. The United States will not long remain apart from the global movement.
Electricity production was originally based on coal alone. At present, it is the only outlet for coal. Even steel-making, which historically consumed a substantial fraction of coal (sometimes more than 10 percent), abandoned coal, dropping demand. Coal will fight hard to keep its last customer. Interestingly, electricity was never linked to oil, one of the other major transforming technologies of the twentieth century. Electricity and oil may now begin to compete seriously for the transport market, as we discuss later. Natural gas is already penetrating the electrical system thanks to the great flexibility, low capital cost, quick starts, and efficiency of gas turbines. At present, electricity remains the only product of the nuclear system. Approaching an energy system with zero emissions, about which all environmentalists dream, will require nuclear to diversify into the hydrogen-making business. The team of electricity and hydrogen can eventually solve all the problems of pollution at the level of th e end-user of energy.
Electrical systems can add visual pollution with their network of towers, wires, and poles. Militant Greens already dynamite pylons and will accept no new structures. New technologies can increase the capacity of the existing lines and diminish intrusi ons. In this regard, direct current, now ultra-high, may have a second life as a bulk carrier aided by relatively cheap electronics, such as thyristors, which are capable of transforming all types of units of electricity into all others. Burying power lin es might beautify the landscape, as well as lessen fears about the health effects of electromagnetic fields.
Feeding the Electrical System
A growing share of primary fuels generates electricity; again, two waves are evident (Figure 8). At the world level, the first centered in 1920 and the second in 1970. The present wave is saturating at close to 40 percent. For the U nited States, the current wave appears to have saturated at about the same level.
Figure 8. Percentage of World Primary Fuels Converted to Electricity.Data Source: Nebojsa Nakicenovic, personal communication, 1995.
Is there a limit to the fraction of fuels feeding into the electrical system? Many energy buffs postulate a ceiling at around 50 percent. A third era of electrical growth does seem likely to occur. Electricity is more flexible and fungible than hydroca rbon fuels. The innumerable devices of the information revolution require electrical power. The transport sector, which has remained largely reliant on oil, could accept more electricity. But the drawbacks are the inefficiencies and the costs of the trans formation.
Inefficiencies are eventually eaten up.17 A successful society is, after all, a learning system.18 In fact, perhaps the greatest contribution of the West during the past three hundred year s has been the zeal with which it has systematized the learning process itself through the invention and fostering of modern science, institutions for retention and transmission of knowledge, and diffusion of research and development throughout the econom ic system. But learning may still go slowly when problems are hard.
The Six-Hundred-Year War for Efficiency
The degree of difficulty for society to learn about power and light shows quantitatively in the duration of the process improvements illustrated in Figure 9. Technologists fought for three hundred years to bring the efficiency of s team power generation from 1 percent in 1700 to about 50 percent of its apparent limit today. Electrical energy is glorified as the purest form of free energy. In fact, the heat value of other fuels when they burn also corresponds to free energy. Thus, th e thermodynamic limit of electric generators is 100 percent. Of course, it can be very difficult to reduce losses in combustion. Still, we may muse that during the next three hundred years efficiency will go to 99 percent.19 This long trajectory suggests that the structure upstream for power generation does not leave much room for spectacular breakthroughs.
Figure 9. Improvement in the Efficiency of Motors and Lamps Analyzed as a Sigmoid (logistic) Growth Process. Note: Shown in a linear transform that normalizes the ceiling of each process to 100 percent. Main Sources of Data: for lamps, Encyclopaedia Britannica, 1964; for motors, Hans Thirring, Energy for Man (Bloomington, Ind.: Indiana University Press, 1958).
Still, 70-percent efficiency can be eyed as the next target, to be achieved over fifty years or so. Turbosteam plants with an efficiency of about 60 percent have been constructed. Although further gains in this regard appear limited, the massive diffus ion of highly efficient turbine technology is sure to be a lucrative and influential feature of the next fifty years or so. Fuel cells, avoiding the free energy loss almost inevitable in the combustion process on which turbines rely, may well lead to the even higher efficiencies. Electrochemistry promises such technology but mentally seems more or less still stuck in Edison’s time. Perhaps solid-state physics can produce the insights leading to the needed leap forward as specialists in this field become m ore interested in surfaces, where the breakthroughs need to occur.
At the 70-percent level of efficiency, an almost all-electric distribution of primary energy looks most appealing. The catch is the load curve, which seems likely to remain linked to our circadian rhythms. In Cole Porter’s song lyric, we hear “Night an d day, you are the one”; but in energy systems night still dims demand and means expensive machinery remains idle. Even in cities famous for their nightlife, nocturnal energy demand is only one-third of the daytime requirement. The ratio of day to night a ctivity does not seem to have changed much. The ancients actually spent considerable time awake at night, despite miserable illumination. The fine old word “elucubrate” means to work by the light of the midnight oil, according to the Oxford English Dic tionary.
Even if most humans continue to sleep at night, we have pointed out earlier that their energy-consuming machines can work nocturnally. In fact, remote control and the shrinking work force required to operate heavy industry ease the problem. So, too, wi ll linking parts of the globe in sun and shade, summer and winter.
Still, we should clearly look further for efficiency gains. Much large electrical machinery is already so efficient that little or no gain is to be expected there. But a discontinuous step could yet come in the progress of machinery. Superconductivity, when it permits high magnetic fields, can lead to compactly designed motors with broad applications and very low energy losses. The proliferation of numerous micro-machines will of course tend to raise electricity demand, partially offsetting the efficie ncy gains they offer. The miniaturization of circuits and other aspects of computing systems in the past two decades shows how powerfully reducing the size of objects can increase their applications and numbers.
The Splicer
In proposing a more general solution we need to introduce another consideration, namely, reliability. The main drawback of an electrical system is that it permeates the web of social services, so that a breakdown, even for a few hours, can bring traged y. A defense against this vulnerability, as well as a means of addressing cyclical loads, could come with the diffusion of multipurpose minigenerators at the level of individual consumers. In effect, we would delegate base load to the global system, leavi ng peaking and standby to a new multipurpose household appliance. Multipurpose means the device could produce heat, electricity, and cold on demand.
Such combined thermal, electric, and cooling systems, which we will call “splicers,” are under development. Attempts so far, such as the FIAT TOTEM, have been unsuccessful, in part because the marketed models lack the basic characteristic of zero ma intenance required by household gadgets. Still, the scheme is appealing, both functionally and economically. The Japanese are doing a sizable amount of research and development in what appears to be a promising direction: stirling engines with free-fl oating pistons and a power output of a few kilowatts. The machines are maintenance-free, silent, and can compress fluids for the heating and cooling cycles on top of producing electricity with linear oscillating generators. The models described in the lit erature are powered by natural gas.
In conjunction with a clean gas distribution system, the penetration of the splicer as a home appliance over the next fifty years could revolutionize the organization of the electrical system. The central control could become the switchboard of million s of tiny generators of perhaps 5 kilowatts. Electric utilities might initially abhor the technology that brings such functional change, but already some plan to use it. One attraction is that the final user immediately pays the capital cost.
In any case, the breakthroughs may come instead on the side of the consumers. A number of well-known machines and appliances need technological rejuvenation, as efficiencies are systematically low. And new machines need to be invented. At a high level of abstraction, human needs are invariant: food, clothing, shelter, social rank, mobility, and communication (a form of mobility where symbols move instead of persons or objects). Let us guess the shape of the new machines in the areas of vision and warmt h.
Efficient Vision
Illumination, the first brilliant success of electricity beyond powering the workshop, provides a good example. Breaking the rule of the night is an old magical dream. The traditional tools-oil lamps, torches, and candles-were based on a flame w ith relatively low temperature and small amounts of incandescent soot to emit the light. They performed the task poorly (see Figure 9).20 The typical power of a candle is 100 watts, but the light efficiency is less than 0.1 percent.
Electricity fulfilled the dream, almost from the beginning, with arc lights, whose emitting source was solid carbon at temperatures of thousands of degrees centigrade.21 The light was as white as the sun, and efficiency reached about 10 percent. The technical jump was enormous. Theaters, malls, and monuments were lavishly illuminated. People were seduced by the magic. Amusement parks such as Luna Park and Dreamland at Coney Island in New York drew millions of paying visi tors to admire the architectural sculptures of light.
Edison’s 1879 incandescent lamp was a trifle inferior to the arc in light quality and efficiency but was immensely more practical. Symbolically, in 1882 the New York Stock Exchange installed three large “electro-liers,” new chandeliers with sixty-six e lectric lamps each, above the main trading floor. The exhibition of the power to break the night came first and dramatically. Penetration of the technology came later and, as usual, slowly. US cities, as shown earlier, achieved full illumination only abou t 1940.
The period from 1940 to 1995 can be called a period of consolidated light. Lamps became brighter and efficiency rose. To the human eye, the quality of the light may actually have worsened with the spread of fluorescents. With laser light, which has ter rible visual quality now, we may approach theoretical efficiency, though actual lasers remain inefficient. Will that be the light at the end of the tunnel?
To return to basics, we illuminate in order to see in the dark. Illumination has no value if nobody looks. Arriving in a town at night, we always see the roads brightly lit and empty, so we know of waste. The marvels of the 1980s, electronic sensors an d computer chips, can already scan rooms and streets and switch the lights off if no one is present. The watt-watch can help, but we can go further.
Sophisticated weapons systems-those mounted in helicopters, for example-feel the thumb of the pilot, observe his eyes, and shoot where he looks. A camera-computer in a room can watch the eyes of people present and illuminate only what they watch. Phase d arrays, familiar in sonars and radars and developed now for infrared emitters, are certainly transportable into the visible range and can create sets of beams that are each directed to a chosen point or following a calculated track. The apparatus might now look baroque, but with miniaturization it could be concealed in a disk hanging from the ceiling of a room. Such a gadget appears to be the supreme fulfillment, illuminating an object only if a human gazes upon it.
But recall again that the objective is not to illuminate but to see. We illuminate because the eye has a lower limit of light sensitivity and, in any case, operating near such a limit is unpleasant. The military has developed complicated gadgets by whi ch scanty photons from a poorly illuminated target are multiplied electronically to produce an image of sufficient luminosity. The principle is good; the machine is primitive. If photons flowing in an energized medium (such as an excited laser crystal) mu ltiplied in a cascade along the way while keeping frequency and direction, we would have invented nightglasses, the mirror image of sunglasses.22 We could throw away all sorts of illuminating devices. A few milliwatt s of power would be enough to brighten the night.
Efficient Warmth
The largest part of energy consumed in the home is used for temperature control. Space heating accounts for 60 percent or more of total residential energy use in many developed countries. Heating a home is a notably inelegant process from a thermodynam ic point of view. We use pure free energy (electricity or fossil fuels) to compensate for a flow of energy from inside to outside having an efficiency according to the Second Law of Thermodynamics of about 3 percent if the difference in temperature is 10< SUP>oC. Heat pumps solve the problem conceptually, but they see temperatures inside their heat exchangers and consequently overwork.23 Moreover, operating on electricity generated upstream, they already invite inefficiency into the endeavor.
Consider a radically different proposal. Windows are the big leaks, even when the glazing is sophisticated and expensive. Why not use window panes as thermoelectric devices, not to carry heat uphill but to stop heat from sledding downhill, that is, as heat-flux stopping devices?
Thermoelectric generators are usually seen as machines to make electricity by using the principle of the thermocouple. However, the device is reversible: by passing electricity through the machine, heat can be moved uphill. Several decades ago refriger ators were proposed using this principle on the basis of its great simplicity, although efficiencies are low. The old scheme for refrigerators could be revised in view of new thermoelectric materials and given suitably competitive objectives.
The basic idea is that electrodes on the inner and outer surfaces of the windowpanes can be made of conductive, transparent glasses. Glass made of zinc oxide might be sufficiently conductive. Voltages across the glass would be very low-volts or fractio ns of volts. Holding a temperature differential with zero flux would be more efficient energetically than putting heat (electrically!) into a house to balance the outgoing flux.
Electric Motion
So far we have looked at examples where efficiency wins, and net demand for power grows, only if the human population and its use of devices increase faster than efficiency. Now let us look at one example where a large new market might emerge, matching the ultra-high voltage lines and continental connections.
Toward the end of the last century electric motors for vehicle engines attracted much inventive action. Edison and Ferdinand Porsche produced sophisticated prototypes. The idea flopped on the roads but succeeded on the rails. Electric trams clamored th rough American and European cities, helped create suburbs, and in some cases connected cities. After 1940 most of the system was rapidly dismantled, largely because the trams could not match buses and cars in flexibility or speed. The mean velocity of tra nsport keeps increasing through the progressive substitution of old technologies with new, faster ones. For France, the increase in the average speed of all machine transport has been about 3 percent per year during the last two centuries. Urban and subur ban railways have a mean speed of only about 25 kilometers per hour, including stops. Cars have a mean speed on short distance trips of about 40 kilometers per hour. The latest in the series are airplanes, with a mean speed of 600 kilometers per hour. Air planes will provide most of the increase in mean speed over the next fifty years.
Electric trains succeeded in Europe and Japan for the densely trafficked lines and still operate today. They have decent acceleration and speed compared with diesels. But most trains are not fast; the inclusive travel time on intercity rail journeys is only about 60 kilometers per hour. The fastest trains, the French trains à grande vitesse (TGVs), are electric. The question for trains is how to compete with cars on one side and with airplanes on the other. Electricity probably cannot com pete with hydrogen for propulsion of cars and other light vehicles.
The great market challenge for the current generation of fast trains, with top speeds of 400 kilometers per hour, is the short distances of less than 100 kilometers along which cars congest and airplanes cannot compete. The present configuration of air ports and airplanes are high-speed but low-flux machines. TGVs could prove extremely competitive in the intense shuffling of commuters and shoppers within these distances. A cursory review of Europe reveals about 5,000 kilometers of intercity links fittin g the constraints of a 100-kilometer distance and high potential passenger flux.
Fast trains consume more or less the same amount of primary energy per seat-kilometer as a turboprop plane24 or a compact car. From the power point of view, a running TGV absorbs about 10 kilowatts per seat. The mean pow er demand of the proposed 5,000-kilometer system of TGV trains for commuters and shoppers would be around 6 gigawatts, with a peak of probably 10 gigawatts. If the concept is successful, this form of transport will be an important consumer of electricity, but it will take at least fifty years to become fully implemented.
To go to very high passenger fluxes over longer distances, one would need to go to aerial configurations of which even the most daring air-transport planners do not chance to dream: flocks of airplanes of five thousand passengers each taking off and la nding together like migrating birds.
For intense connections linking large cities with peak fluxes around ten thousand passengers per hour, a solution is emerging that matches system requirements: the magnetically levitated (maglev) train operating in a partially evacuated tube or tunnel. In fact, Swiss engineers have developed the concept of a vacuum version of maglevs in part to reduce drastically the tunnel boring expenses, which in Switzerland would account for at least 90 percent of the cost in a conventional layout. 25 To handle the shock wave from a high-speed train, a tunnel normally needs a cross section about ten times that of the train. In addition to narrowing greatly the tunneling requirement, the partial vacuum greatly reduces friction, making speed cheap and thus expanding the operational range of the train.
When operated at constant acceleration-for example, 5 meters per second or 0.5 g (the force of gravity), about what one experiences in a Ferrari sports car-maglevs could link any pair of cities up to 2,000 kilometers apart in fewer than twenty minutes. Consequently, daily commuting and shopping become feasible. Such daily trips account for 90 percent of all travel and are controlled by the total human time budget for travel of about one hour per day. With fast, short trips cities can coalesce in functi onal clusters of continental size. City pairs spaced less than 500 kilometers or ten minutes apart by maglevs, such as Bonn-Berlin, Milan-Rome, Tokyo-Osaka, and New York-Washington, would especially benefit.
Part of the energy consumption of vacuum maglevs overcomes residual friction; an economic balance must be struck between the friction losses and the pumping power to keep the vacuum. Part regenerates the electromagnetic system that pushes and pulls the trains.26 The power per passenger could roughly correspond to that of a large car, although these trains may travel at a mean speed of 3,000 kilometers per hour.
The great advantage of the constant acceleration configuration for maglevs is that the energy required for each length of track is constant and could be stored, perhaps magnetically, in the track itself. Power demand is proportional to train speed and moves into the gigawatt range in the central section; however, with local storage (a few kilowatt hours per meter) the external electric power networks would see only the need to make up losses. Even assuming 90-percent efficiency, these would not be negl igible. One hundred trains per hour would demand 1 gigawatt for the single line on which they operated.27 The Swiss system has a final potential of five hundred trains per hour, which would require 5 gigawatts-about one-thi rd of current installed Swiss generating capacity.
The first long-distance maglev will probably run in about five to ten years. Berlin-Hamburg is under construction. The penetration of the technology will be gradual, as major infrastructural technologies always are. In fact, the next fifty years will p robably be used largely to establish the feasibility, chart the maglev map, and prepare for the big push in the second half of the twenty-first century. In the long run, maglevs may establish several thousand kilometers of lines and become one of the most important users of electricity. A maglev trip per day becomes a few thousand kilowatt hours per year per person. If India and Eastern China join life in this superfast lane, the picture of a globally integrated, high-capacity electrical system begins to cohere.
Conclusions
The long economic cycles that seem to affect all parts of social and economic life constitute a good frame of reference for the development of the electrical system in terms of technology, territorial penetration, birth and death of enterprises, and in tensity of use. Our examples suggest this is true for the United States and globally.
Two waves of electrification have passed through our societies. In the first, the United States attained system saturation in the 1930s at about 1,000 kilowatt hours annual consumption per residential customer, 200 gigawatt hours of total annual use, 4 0 gigawatts of installed capacity, and 20 percent of primary fuels producing electricity. In the second wave, we have reached 10,000 kilowatt hours per residential customer, 3,000 gigawatt hours of total use, 800 gigawatts of installed capacity, and about 40 percent of fuels producing electricity.
The fact that the patterns of temporal diffusion and growth are followed makes it possible to fit dynamic equations to the time series of facts and then compare them for consistency. This operation indicates that the 1990s are the season of saturation, which includes the experience of overcapacity or, alternately, underconsumption. Such phases are not uncommon for various branches of the industrial system, as managers tend to assume that growth characteristics of boom periods will extend into recession s, while consumers cut corners.
In the short term, total energy and electric energy consumption may continue to grow at a slower rate than overall economic activity. One interpretation is that during the expansion period of the long cycles the objective is growth, while during the re cessive period the objective is to compete, shaving costs here and there and streamlining production. The savings include energy. Meeting goals pertaining to environmental quality and safety further tighten the system.
A new cycle formally beginning in 1995 started the game again, although the effects of the restart will not be particularly visible for a few years. Minima are flat. Looking at the cycles from a distance to grasp the general features, one sees the peri ods around their ends as revolutionary, that is, periods of reorganization-political, social, industrial, and institutional. We are evidently at this conjunction, and the electrical system will not escape it.
When the electrical system served the village, a complete vertical integration was inevitable. Regional coverage, the preferred scale of the past fifty years, also favored such integration. With the expansion to continental dimensions, a shift in respo nsibilities may make the system more efficient, agile, and manageable. The typical division is production, trunk-line transport, and retailing, with different organizations taking care of the pieces and the market joining them. The experiments in this sen se now running in Great Britain, Australia, and other countries can be used as a test bed to develop the winning ideas.28
Apart from various economic advantages and organizational complications, the use of splicers on a large scale-untried to date-may bring an almost absolute resiliency, as every subset of the system may become self-sufficient, if temporarily. The electri cal system should also become cleaner, as it intertwines more closely with natural gas and probably nuclear energy, thus furthering decarbonization. A sequence of technical barriers will appear, and thus the process of systematic research and innovation w ill continue to be needed; it will produce timely results.
In fact, our analyses suggest that rates of growth of technology tend to be self-consistent more than bound to population dynamics. Population, however, defines the size of the niche in the final instance. Thus a key question is, how long will it take to diffuse Western electric gadgetry to the 90 percent of the world that is not already imbued with it? The gadgetry keeps increasing. Followers keep following, if more closely. Based on historical experience, diffusion to distant corners requires fifty t o one hundred years. Even within America or Europe, as we have seen, pervasive diffusion takes that long for major technologies. So most people may have to wait for most of the next century to experience nightglasses, splicers, and maglevs. These devices may be largely features of a fourth wave of electrification, while the spread of the profusion of information-handling devices dominates the third wave that is now beginning.
Considered over centuries and millennia, the electrical adventure is deeper than a quest for gadgets. In 1794 Volta demonstrated that the electric force observed by Luigi Galvani in twitching frog legs was not connected with living creatures, but could be obtained whenever two different metals are placed in a conducting fluid. Today we use electricity to dissolve the difference between inanimate and living objects and to control and inspire the inanimate with more delicacy than Dr. Frankenstein. Introd ucing electricity into production raised the rank of workers from sweating robots to robot controllers. The process can be generalized, with humanity-at leisure or at work-giving orders to its machines by voice or a wink of the eye.
This ancient aspiration for action at a distance and direct command over the inanimate will drive invention, innovation, and diffusion for hundreds of years more; we come full circle to the elektron of the ancient Hebrews and Greeks.
Acknowledgments
We thank Perrin Meyer, for research assistance and figure preparation, as well as Arnulf Grübler, John Helm, Eduard Loeser, Nebojsa Naki¬enovi¬, and Chauncey Starr.
Endnotes
1“Oh subtle fire, soul of the world, / beneficent electricity / You fill the air, the earth, the sea, / The sky and its immensity.” Quoted in Robert Darnton, Mesmerism and the End of the Enlightenment in France (Cambridge, Mass.: Harvard University Press, 1968), 29.
2Edgar Allan Poe, The Science Fiction of Edgar Allan Poe (New York: Penguin, 1976).
3For general histories of electrification, see Thomas P. Hughes, Networks of Power: Electrification in Western Society (Baltimore, Md.: Johns Hopkins University Press, 1983); Richard F. Hirsch, Technology and Transformation in the American Electric Utility Industry (Cambridge: Cambridge University Press, 1989); David Nye, Electrifying America (Cambridge, Mass.: MIT Press, 1990); Wolfgang Schivelbusch, Disenchanted Night: The Industrialization of Light in the Nineteenth Century (Berkeley, Calif.: University of California Press, 1988); and Sam H. Shurr, Calvin C. Burwell, Warren D. Devine, Jr., and Sidney Sonenblum, Electricity in the American Economy: Agent of Technological Progress (Westport, Conn.: Greenwood Press, 1990). For data and information on the early history of energy and electricity, see H. D. Schilling and R. Hildebrandt, Primarenergie-Elektrische Energie, Die Entwicklung des Verbrauchs an Primarenergietragern und an Elektrischer Energie in der Welt, in den USA und in Deutschland seit 1860 bzw. 1925 (Essen: Vertrag Gluckauf, 1977).
4Henry Adams, The Education of Henry Adams: An Autobiography (Boston, Mass.: Massachusetts Historical Society, 1918; reprinted Boston, Mass.: Houghton Mifflin, 1961).
5Such diffusive processes are well fit by the logistic equation, which represents simply and effectively the path of a population growing to a limit that is some function of the population itself. For discussion of applications of logistics, see Nebojsa Nakicenovic and Arnulf Grübler, eds., Diffusion of Technology and Social Behavior (Berlin: Springer, 1991). On the basic model, see S. Kingsland, “The Refractory Model: The Logistic Curve and the History of Population Ecology,” Quarterly Review of Biology 57 (1982) : 29-52.
6A kilowatt (kW) is 1,000 watts; a megawatt (MW) is 1,000,000 W; a gigawatt (GW) is 1,000 MW; a terawatt (TW) is 1,000 GW. US generating capacity was 735 GW in 1990.
7Power is equal to V2/R, where V is voltage and R is resistance.
8John Winthrop Hammond, Charles Proteus Steinmetz: A Biography (New York and London: The Century, 1924).
9Chauncey Starr, “A Personal History: Technology to Energy Strategy,” Annual Review of Energy and the Environment 29 (1995): 31-44.
10Cesare Marchetti, “Fifty-Year Pulsation in Human Affairs: Analysis of Some Physical Indicators,” Futures 17 (3) (1986): 376-388.
11For an analysis of electricity projections, see Charles R. Nelson, Stephen C. Peck, and Robert G. Uhler, “The NERC Fan in Retrospect and Prospect,” The Energy Journal 10 (2) (1989): 91-107.
12See Lee Schipper, “Life-Styles and the Environment: The Case of Energy,” Dædalus 125 (3) (Summer 1996).
13Jesse H. Ausubel and Arnulf Grübler, “Working Less and Living Longer: Long-Term Trends in Working Time and Time Budgets,” Technological Forecasting and Social Change 50 (3) (1995): 195-213.
14Peggy L. Jenkins, Thomas J. Phillips, Elliot J. Mulberg, and Steve P. Hui, “Activity Patterns of Californians: Use of and Proximity to Indoor Pollutant Sources,” Atmospheric Environment 26A (12) (1992): 2141-2148.
15Sulfur and other emissions from power plants also cause ills, but these have proven to be largely tractable. See Nebojsa Nakicenovic, “Freeing Energy from Carbon,” Dædalus 125 (3) (Summer 1996).
16Jesse H. Ausubel, “Energy and Environment: The Light Path,” Energy Systems and Policy 15 (3) (1991): 181-188.
17N. Nakicenovic, L. Bodda, A. Grübler, and P.-V. Gilli, Technological Progress, Structural Change and Efficient Energy Use: Trends Worldwide and in Austria, International Part (Laxenburg, Austria: International I nstitute for Applied Systems Analysis, 1990).
18Cesare Marchetti, “Society as a Learning System,” Technological Forecasting and Social Change 18 (1980): 267-282.
19While Carnot efficiency (now about 60 percent) limits heat cycles, fuel cells do not face such a limitation, as they are not based on heat cycles.
20Gaslight, with a mantle with rare-earth elements, was a superior source of bright light for a period.
21The plasma struck between the two carbon electrodes also emits.
22Sticking to monochromatic light, a ray proceeding in a resonantly excited medium stimulates emission and becomes amplified. Amplification is relatively small with present devices; hence the ray must travel up and down betwe en mirrors. But no physical law limits amplification to such low levels. Semiconductor lasers, pumped by electric voltage, might hold the solution. In a second stage, they should also operate for a number of colors.
23The equivalent free energy of heat flowing out of a building is measured through the temperatures inside (T1) and outside (T2) in kelvin and is (T1-T2)/T1. In the case of a heat pump, due to temperature drops in the heat exchanger, it pumps heat from a temperature lower than T2 into a temperature higher than T1.
24For example, airplanes of the type ATR-42 or Dash.
25R. Nieth, W. Benoit, F. Descoeudres, M. Jufer, and F.-L. Perret, “Transport interregional à grande vitesse-Le Project SWISSMETRO,” Ecole Polytechnic Federale de Lausanne, 1991.
26We can calculate the amount of energy circulating in the system for a maglev with constant acceleration operating over a distance of 500 kilometers. A train of 200 metric tons accelerating at 0.5 g has a pull force (drag) of 1,000 kilonewtons, which over a stretch of 500 kilometers corresponds to 5 x 10¹¹ joules, or approximately 140,000 kilowatt hours. A mean loss of 10 percent would require 14,000 kWh for one thousand seats, or 14 kWh per seat over 500 km. This would correspond to 84 kW per passenger at a typical trip time of 10 minutes (e.g., Bonn to Berlin).
27For example, fifty trains might operate in each direction, spaced one minute apart. They can start from different stations or lanes. One per minute would be the frequency in the neck of the tunnel.
28For discussions of models of organizational change in the electricity industry, see Judith B. Sack, research memorandum series on “Global Electricity Strategy” (New York: Morgan Stanley), especially “The Darwinian Theory of Distribution” (12 December 1995), and “An Interrelated World” (29 February 1996).
Jesse H. Ausubel is Director of the Program for the Human Environment at The Rockefeller University.
Cesare Marchetti is an Institute Scholar at the International Institute for Applied Systems Analysis in Laxenburg, Austria.
Technology and environment: An overview
Environmental trends
The Environment for Future Business
Efficiency will win
In this article, I would like to share some surprising insights into the long-term evolution of the human environment and technology that may help diverse industries to do their jobs better. Indeed, absorbing some of these insights may determine which firms survive.
My points are: Demand for many primary products, or natural resources, will drop, in the USA and other important markets. In other words, efficiency will win. Pollution will plummet. Many firms’ emissions already have. We are going to live on a green planet with abundant land for nature.
As will become evident, these developments are not discontinuities or revolutions. Rather, the wheels of history are rolling in the direction of prudent, clean use of resources. Those who understand the dynamics can make money from them, too.
Usually we hear from environmental scientists and activists about deforestation, loss of arable land, water scarcity, and exhaustion of hydrocarbon fuels. The trumpets blare that, a population grows from six to 10 billion over coming decades, humans will demand so much of everything that prices will rocket, squabbles over access to resources will turn to wars, and a bath of pollution will burn us all.
In contrast, I believe that society is a learning system – and that we have been learning to become much more efficient. Pollution and waste usually indicate inefficiency. In an economy of competing companies, inefficiency is for losers. So, over the long run, successful companies are going to be green and clean.
A tour of the major natural resources – energy, land, water, and materials – justifies my confidence. Accordingly, this article surveys the trends in the use of these resources over the last century or two, globally and in the United States.
Along the way, it is important to keep in mind three paramount facts about the economy:
- Evolution is a series of replacements. Products, performers (usually companies), and technologies substitute for one another in the market in a search for inclusive fitness.
- The struggle is bloody. Products, performers, and technologies, indeed whole systems of doing things, lose and die.
- The struggle is episodic or cyclical, in many instances. In particular, long cycles or pulses of about 50 years punctuate the evolution of the economy. We happen to be at the start of a new cycle now.
Energy
Gains in energy productivity and efficiency astonish. Consider the gains for motors and lamps, pictured in Exhibit 1 on a logarithmic scale as the fraction of the limit of efficiency they might obtain. In about 1700, the quest began to build efficient engines, starting with steam. Three-hundred years have increased the efficiency of the generators from one percent to about 50 percent of their apparent limit, the latter achieved by today’s best gas turbines, made by General Electric. Fuel cells, which will power our cars in 20 to 30 years, can advance apparent efficiency to about 70 percent.
The efficiency data for engines and lamps are plotted along a line fitted by a logistic equation. The scale used renders the conventional S-shaped curve of the logistic equation into a straight line. Source: Ausubel and Marchetti, Daedalus 125(3), 1996.
Lamps have brightened with each decade. At the outset of the 1990s, the Photonics Lab of the 3M Company announced an advance in short-wavelength solid-state light emitters in the blue and green spectral regions using zinc-selenium lasers. These could significantly advance efficiency, penetrating the market for displays and then reaching into other commercial applications.
Analyses of the evolving efficiency of the full energy system show that the United States has averaged about one percent less energy to produce a good or service each year since about 1800. However, our modern economies still probably run at only about five-percent efficiency for the full chain from extracting primary energy to delivery of the service to the final user. Fifty-percent efficiency at each of four links in a chain, after all, produces six-percent efficiency for the chain as a whole.
For the environment, efficiency with respect to use and leaks of carbon matters greatly. Carbon darkens the environmental outlook by threatening oily beaches, smoggy air, overheated climate, and black lungs. Happily, the most important single fact to emerge from 20 years of energy analyses is the gradual “decarbonization” of the energy system, the falling number of carbon molecules used to provide a unit of energy or economic product.
In 1860, globally, about 1.1 tons of carbon went into the primary energy produced by the energy equivalent of one ton of oil then in the fuel mix; the amount has decreased monotonically to about 0.7 tons in 1990. Exhibit 2 details the shrinking carbon used for final energy to the consumer in diverse countries in the last few decades. Efficiency is much higher in the richer countries, whose firms more readily discern inefficiency as a market opportunity and can parlay the expertise and capital to reduce it.
Source: Nakicenovic, Daedalus 125(3), 1996.
This decarbonization partly reflects that new motors and light bulbs get more out of the fuel they use. It also reflects the substitution of fuels that are progressively lighter in carbon. I noted above that evolution is a series of replacements. In fact, we can view the process of decarbonization as the replacement of carbon with hydrogen as the source of chemical energy (see Exhibit 3). Economizing on carbon, we are on a steady trajectory toward a methane, and eventually hydrogen, economy.
The ratio of H to C is plotted along a line fitted by a logistic equation. The scale used renders the conventional S-shaped curve of the logistic equation into a straight line.
Source: Ausubel, American Scientist, March-April 1996.
A grand substitution of leading energy sources has taken place over the past century and a half for the world: from wood and hay, to coal, to oil, and now to natural gas. “Oil” companies such as Shell and Mobil affirm it in the investments they now favor. The progression of fuels has sequentially supported a higher spatial density of consumption. Effectively, each new leading fuel is superior from an environmental point of view.
Wood and hay, prevalent at the start of the 19th century, were bulky and awkward. Consider if every high-rise resident needed to keep both a half-cord of wood at hand for heat and a loft of hay for the Honda. Think of the deforestation this would cause – directly for the fuelwood, and indirectly from the land needed for hay.
Coal had a long run at the top, notwithstanding its devastating effects on miners’ lungs and lives, urban air, and the land from which it came. Then, around 1900, the advantages of a system of fluids rather than solids became evident. Coal-powered autos never had much appeal. The weight and volume of the fuel were hard problems.
Oil has a higher energy density than coal, plus the advantage of a form that allows it to flow through pipelines and into tanks. Systems of tubes and tins can deliver carefully regulated quantities from the scale of the engine of a motor car to that of the Alaska Pipeline. But transfer between tins is imperfect, and the tubes and tins puncture. The spills make headlines.
In contrast, an inconspicuous, pervasive, and efficient system of pipes distribute natural gas. Its capillaries safely reach right to the kitchen. For gas, the next decades will be a time of relative and absolute growth. Gas is the penultimate fuel, the best until hydrogen, whose combustion product is water rather than carbon dioxide. Nuclear plants remain the best long-run candidate to manufacture the hydrogen, but perhaps solar will learn to compete.
Before making “neat” hydrogen, the next step is “zero emission power plants” with supercompact, superpowerful, superfast turbines that deliver what are now combustion products in a form appropriate for injection into aquifers where they can be sequestered forever. Very high pressure CO2 gas turbines in which combustion of the fuel with oxygen inside the gas flux provides the heat should do the trick.
Looking back, we see that growth of per capita energy consumption has been keyed to cleaner fuels (see Exhibit 4). Pulses of energy growth reach economic, social, technical, and environmental limits. In past pulses, per capita energy consumption tripled before the energy services desired outgrew the old fuels or portfolio of fuels. I postulate two new global pulses, one centered on gas and then a later one centered on hydrogen. Industrial, commercial, and residential end users have also enjoyed two neatly quantifiable pulses of penetration of electricity, and two more probably lie ahead, keyed to the information revolution and later to the electrification of travel.
Total world consumption is dissected into a succession of logistic curves, again plotted on a scale that renders each S-shaped pulse into a straight line.
Source: Ausubel et al., Climatic Change 12(3):245-263, 1988.
The growth pulses, lasting 40 to 45 years, are followed by lulls or depressions of a decade or two in energy consumption. These years between the pulses, when demand is rather flat, matter greatly for industry organization because they especially reward producers who are the most efficient and lowest cost – in short, the most competitive. They often witness a big restructuring of the industry, as is happening today to electric utilities.
Global triplings of demand need not mean triplings in the U.S. and other rich countries, where higher efficiencies throughout the chain can effectively supply the already amply, but still sloppily, provided end-users.
To return to the environmental aspect, recall that the transport system mirrors the energy system. In personal transport, oil substituted for hay (that is, cars for horses). America had more than 20 million non-farm horses in 1910 and has about 200 million motor vehicles today. Imagine the pollution had the fleet stayed equine. So the energy story is efficiency and cleanliness to meet the demands of larger, denser markets, driven by competition, occurring in long cycles.
Land
More blood spills over land than any other resource. Yields per hectare measure the productivity of land and the efficiency of land use. During the past half century, ratios of crops to land for the world’s major grains – corn, rice, soybeans, and wheat – have climbed, fast and globally.
A cluster of innovations, including tractors, seeds, chemicals, and irrigation – joined through timely information flows and better organized markets – raised yields to feed billions more without clearing new fields.
Per hectare, world grain yields rose 2.15 percent annually between 1960-1994. The productivity gains have stabilized global cropland since mid-century, mitigating pressure for deforestation in all nations and allowing forests to spread again in many. The Green Revolution that led to high-yield crops earned a Nobel Peace Prize. The alternative – extending farming onto hundreds of millions more hectares – would surely have evoked deadly strife.
Fortunately, as Exhibit 5 shows, the agricultural production frontier remains spacious. On the same area, the average world farmer grows only about 20 percent of the corn of the top Iowa farmer, and the average Iowa farmer lags more than 30 years behind the state-of-the-art of his most productive neighbor.
Source: Waggoner, Daedalus 125(3), 1996.
Will high-yield agriculture tarnish the land? Farmers do many things on each area of land that they crop. In general, higher yields require little more clearing, tilling, and cultivating than lower yields. Protecting a plot of lush foliage from insects or disease requires only a little more pesticide than does sparse foliage. Keeping weeds from growing in deep shade beneath a bumper crop may require less herbicide per field than keeping them from growing in thin shade. The amount of water consumed is more or less the same per area whether the crop is abundant or sparse. Growing higher yields distills away only a little more water and leaves only a little more salt than lower yields.
Seed is planted per plot; choosing a higher yielding variety does not affect the surroundings. If the improved variety resists pests, it lessens the external effects of pesticides compared to a sprayed crop. By minimally changing the external effects of things that farmers do per area, lifting yields will thus lower effects per unit of yield.
On the other hand, farmers use more of some things to raise the yield of their crops. For example, farmers apply more fertilizer, especially nitrogen, per plot to raise yields. But in fact the key issue is usually the sound, complementary use of fertilizer and water. We appear to have reached the point of diminishing returns for applications of fertilizer. In America, use has been level for 15 years. Globally, use has fallen since 1985, in part because of big drops in the former Soviet bloc, where it was wastefully applied.
Globally, the future lies with precision agriculture. This approach to farming relies on technology and information to help the grower use precise amounts of inputs – fertilizer, pesticides, seed, water – exactly where they are needed. Precision agriculture includes grid soil sampling, field mapping, variable rate application, and yield monitoring, tied to global positioning systems. It helps the grower lower costs and improve yields in an environmentally responsible manner. At a soybean seminar in Dayton covered by the Associated Press on February 10, 1997, Ohio farmers reported using one-third less lime after putting fields on square-foot satellite grids detailing which areas would benefit from fertilizer.
We have had two revolutions in agriculture in this century. The first came from mechanization. The second came from agricultural chemicals. The next agricultural revolution will come from information.
If during the next 60 to 70 years, the world farmer reaches the average yield of today’s U.S. corn grower, 10 billion people will need only half of today’s cropland while being able to consume the same number of calories as Americans eat today. This will happen if we maintain the yearly 2.15% worldwide yield growth of grains achieved during 1960-1994. Even if the rate falls by half, an area the size of India, globally, will revert from agriculture to woodland or other uses. The bottom line is that farm land should become more abundant in many countries. Land prices should show it.
Water
Will water become scarce? Not if we similarly squeeze more value from each drop. Since 1975, per capita water use in the United States has fallen at an annual rate of 1.4 percent. Even absolute water withdrawals peaked about 1980.
Industry, alert to technology as well as costs, exemplifies the progress, although it consumes a small fraction of total water. Total U.S. industrial water withdrawals plateaued about 1970, and have since dropped by one-third (see Exhibit 6). Also interesting is that industrial withdrawals per unit of GNP have dropped steadily since 1940. Then, 14 gallons of water flowed into each dollar of output. Now the flow is less than three gallons per dollar.
The steep decline taps many sectors, including chemicals, paper, petroleum refining, steel, and food processing, and also reflects changes in what forms the economy. After adjusting for production levels, not only intakes but discharges per unit of production are perhaps one-fifth of what they were 50 years ago in the United States.
Sources of Data: U.S. Historical Statistics, U.S. Statistical Abstract
Technology, law, and economics have all favored frugal water use. Better management of demand reduced water use in the Boston area from 320 million gallons per day in 1978 to 240 million gallons in 1992. Incidentally, more efficient use of water and energy usually go together, through better heat-exchangers and recirculation of cooling water. And, if land used for farming shrinks, water use will also tend to fall, although the fraction that is irrigated will rise.
Despite the gains, the United States is far from the most efficient practices. Water withdrawals for all users in the OECD countries range tenfold, with the United States and Canada the highest. Allowing for national differences in the major uses (irrigation, electrical cooling, industry, and public water supply), large opportunities for reductions remain. Like enterprises supplying energy or inputs to farmers, enterprises treating and supplying water will find the emphasis in their markets on quality, not quantity.
Materials
We can reliably project more energy from less carbon, more food from less land, and less thirst with less water. What about more goods and services with less material? Let us define such a “dematerialization” as the decline over time in the weight of materials used to perform a given economic function.
Dematerialization would matter enormously for the environment. Excluding water and oxygen, in 1990 on average each American mobilized more than 50kg of materials per day (see Exhibit 7). Lower materials intensity of the economy could preserve landscapes and natural resources, lessen garbage, and reduce human exposures to hazardous materials.
Source: Wernick and Ausubel, Ann. Rev. of Energy and Environment, 1995.
Over time, new materials substitute for old. Successful new materials usually show improved properties per ton, thus leading to a lower intensity of use for a given task. The idea is as old as the epochal succession from stone to bronze to iron. In the United States, the present century has witnessed the relative decline of lumber and the traditional metals and the rise of aluminum and especially plastics (see Exhibit 8).
The yearly U.S. consumption in mass of the materials is divided by the yearly constant dollar GDP and, to ease comparison, normalized to 1940 (that is, 1940 = 1 for every material).
Source: Wernick et al., Daedalus 125(3), 1996.
Modern examples of dematerialization abound. Since the early 19th century, the ratio of weight to power in industrial boilers has decreased almost 100 times. Within the steel industry, powder metallurgy, thin casting, ion beam implantation and directional solidification, as well as drop and cold forging, have allowed savings up to 50 percent of material inputs in a few decades.
In the 1970s, a mundane invention, the radial tire, directly lowered weight and material by one-quarter compared to the bias-ply tire it replaced. An unexpected and bigger gain in efficiency came from the doubling of tire life by radials – thus halving the use of material (and the piles of tire carcasses blighting landscapes and breeding mosquitoes).
Lightweight optical fibers – with 30 to 40 times the carrying capacity of conventional wiring, greater bandwidth, and invulnerability to electromagnetic interference – are ousting copper in many segments of the telecommunications infrastructure. Similarly, the development of high fructose corn syrup (HFCS) in the 1960s eliminated sugar from industrial uses in the United States. HFCS sweetens five times more than sugar on a unit weight basis, with a proportional impact on agricultural land use.
Certainly many products – for example, computers and containers – have become lighter and often smaller. A few compact discs weighing ounces and selling for less than $100 now contain 100 million phone numbers of Americans, equivalent to the content of telephone books formerly weighing tons and costing thousands. Or you can obtain the numbers from the Internet.
In containers, at mid-century, glass bottles dominated. In 1953 the first steel soft-drink can was marketed. Cans of aluminum, one-third the density of steel, entered the scene a decade later, and by 1986 garnered more than 90 percent of the beer and soft drink market. Between 1973 and 1992, the aluminum can itself lightened 25 percent. In 1976 polyethylene terephthalate (PET) resins began to win a large share of the market, especially for large containers previously made of glass. Once again, for businesses, efficiency meant opportunity, and substitutions meant life and death.
Recycling, of course, diminishes the demand for primary materials and may thus be considered a form of dematerialization. During the past 25 years, recycling and resource recovery have become generalized, albeit incipient, social practices. The basic idea is that wastes are wastes and should be eliminated.
Difficulties arise in the more complex “new materials society” in which the premium lies with sophisticated materials and their applications. Alloys and composites with attractive structural properties can be hard to separate and recycle. Popular materials can be lighter, but bulkier or more toxic. Reuse of plastics may be less economical than burning them (cleanly) for fuel or otherwise extracting their chemical energy.
Most important, economic and population growth have multiplied the volume of products and objects. Thus, total materials consumed and disposed have tended to increase, while declining per unit of economic activity.
Wood products provide an illuminating case. Does doubling the number of people or the amount of wealth double the use of products taken from the forest? We can shed light on this proportionality (or elasticity, as the economists might say) by dissecting historic growth in demand. This growth is the product of an identity: population multiplied times GDP per person multiplied times wood product per GDP.
Consider the U.S. consumption of timber products – lumber, plywood and veneer, pulp products, and fuel (Exhibit 9). Between 1900 and 1993, the national use of timber products grew 70 percent. Large features of these 93 years include the big growth of pulp – that is, paper and paperboard – while the consumption of lumber rose little. Fuel wood nearly disappeared, and then re-emerged. And plywood consumption emerged but remained small. The preeminent feature is that the consumption of timber products rose far less than the rises in population and wealth might suggest.
Source: Wernick et al., Journal of Industrial Ecology 1(3):125-145, 1997.
Near the end of the century, Americans numbered more than three and a half times as many as at the beginning, and an American’s average share of GDP had grown nearly five fold. Had a strict proportionality prevailed, Americans would have consumed 16 times as much timber in 1993 as in 1900, rather than 1.7 times.
The explanation for the difference lies in the third term of the identity mentioned above: the product consumed per unit of GDP (for example, pulp/GDP). Industrial ecologists call this parameter “intensity of use.” If intensity of use is constant, consumption will rise in unchanging proportion to the combined rise of population and wealth. If thicker paper replaces thinner paper and newspapers replace oral gossip, then intensity of use lifts consumption faster than population plus wealth. If thinner paper replaces thicker paper and television replaces newspapers, this lowers the intensity of pulp used per unit of GDP.
Five ten-year periods illustrate the power of intensity of use: the periods 1900-1909 and 1984-1993 bracket the century; in between, 1925-34 shows the decline into the Depression, 1936-45 the recovery and war, and 1973-82 the oil shock.
The segments of the bars in the upper panel of Exhibit 10 show the annual change of the components determining demand, and the unsegmented bars in the lower panel show their sum. For the timber product paper, represented by the consumption of the raw material pulp, the upper panel shows the growth of population gradually slowing from about 2% per year to less than 1% per year and the GDP per person fluctuating through business cycles. The pulp per GDP began the century rising several percent per year. The increase even continued into the Depression, countering the fall of GDP per person to maintain the national consumption of pulp unchanged. During the recovery, however, the consumption of pulp per unit of GDP fell, and it has generally fallen since. During the oil shock through the end period, falling pulp use per unit of GDP actually decreased the national pulp consumption slightly.
Relative changes in the three components of pulp consumption: population, GDP per person, and pulp IOU (upper panel). The changes of the components are shown by segments of bars for five exemplary ten-year periods. The solid bars in the lower panel show the change in the national consumption produced by the sum of the three components.
Source: Wernick et al., Journal of Industrial Ecology 1(3):125-145, 1997.
Mathematically, what can lower intensity of use (in this case, the ratio of timber products to GDP)? The answer: Anything that raises GDP more than timber use. Armament during the recovery from the depression ballooned production that used relatively little forest product. The war was fought more with bullets than with memos. During the period 1936-45, the divisor GDP rose faster than national consumption of pulp, lowering product per GDP at the same time national consumption went up.
Practically, what changes the amount of forest product used per unit of GDP? In the case of lumber, its replacement during the century by steel and concrete in applications from furniture and barrels to cross ties and lath lowered the intensity of use. Living in the stock of existing houses and prolonging the life of timber products by protecting them from decay and fire also lower it.
In the case of pulp, more widespread literacy and the shift to a service economy raised the intensity of use in the early 20th century. More recently, we might speculate that the onset of dematerialization, as telephones and magnetic files replace letters and manuscripts, is lowering it. Because both writing and packaging consume much pulp, both are opportunities for further improvements in intensity of use.
Overall, history shows that the extent of forests in the United States has changed little in the 20th century, and the volume of wood on American timberland has actually risen by 30% since 1950. While foresters grew more wood per hectare and millers learned to get more product from the same tree, the main reason for the lack of change in forested area is that the average American in 1993 consumed only half the timber for all uses as did a counterpart in 1900.
Overall, environmental trends with respect to materials are equivocal. Moreover, a kilogram of iron does not compare with one of arsenic. But the promise clearly exists to lessen the materials intensity of the economy, to reduce wastes, and to create “wastes” that become nutritious in new industrial food webs. Again, efficiency and substitution are toughening markets.
Conclusion
What then is the challenge for green technologists and managers? Suppose Americans wished to maintain current levels of environmental cleanliness with the 50-percent increase in population likely over the next century and with the current level and kind of economic activity now existing. In this case, emissions per unit of activity would need to drop by one-third. That is an easy target. One-and-a-half percent per year improvement reaches the target in 25 years, well before the population rises by half.
The challenge is much harder taking into account growing consumption. If per capita economic activity doubles roughly every 40 years, as it has since about 1800 in the industrialized countries, the result is a six-fold increase by 2100. Multiplied by population, the United States would have almost 10 times today’s emissions and demands on resources, other things being equal. To maintain or enhance environmental quality, this scenario requires extremely parsimonious use of inputs and micro emissions per unit of economic activity. In other words, Americans need to clean processes by an order of magnitude – to stand still. More reassuringly, the annual rate of cleaning need be only about two percent.
In Europe and Japan population is stable or even shrinking, easing the magnitude of their environmental challenges. The rest of the world, where most people live, faces the twin pressures of enlarging economies and growing populations. So in absolute terms, the performance gains must be enormous.
We have seen the outlines of how the gains can be made. In the long run, we need a smoke-free system of generating hydrogen and electricity that is highly efficient from generator to consumer, as well as food decoupled from acreage, carefully channeled water, and materials smartly designed and selected for their uses and then recycled. In short, we need a lean, dry, light economy.
In truth, I exaggerate the challenge. With respect to consumption, multiplying income will not cause an American to eat twice as much in 2040 or four times more in 2080. Moreover, with respect to production, history shows that the economy can grow from epoch to epoch only by adopting a new industrial paradigm, not by inflating the old. Hay and horses could not power Silicon Valley.
High environmental performance forms an integral part of the modern paradigm of total quality. The past 25 years signal the preferred directions: the changeover from oil to gas, the contraction of crops in favor of land for nature, diffusion of more efficient water use to farmers and residents as well as firms, and the development of a new ecology of materials use in industry.
Economists always worry about trading off benefits in one area for costs in another. Hearteningly, we have seen that, in general, efficiency in energy favors efficiency in materials; efficiency in materials favors efficiency in land; efficiency in land favors efficiency in water; and efficiency in water favors efficiency in energy. The technologies that will thrive, such as information, will concert higher resource productivity.
Some worry that the supply of a fifth major resource, ingenuity, will run short. But nowhere do averages appear near the frontier of current best practice. Simply diffusing what we know can bring gains for several decades. Overall, society hardly glimpses the theoretical limits of performance. More importantly, we forget the power of compounding our gradual technical progress, even at one or two percent per year.
Of course, societies could stop learning. Complex societies have collapsed before. To my eyes, the rejection of science would indicate the greatest danger.
If, however, learning continues as usual, the demand for natural resources will moderate, resource prices will stay low, and pollution will drop – the sustained and collective effect of innumerable actions for technical change and better practices by a multitude of competing firms operating with proper feedback.
Fluctuations, bottlenecks, and falls will make the wayside interesting. Whether they sell autos, carbon, chemicals, corn, electricity, land, paper, or zinc, companies had best take note. Though it will never be easy, the environment for future business will be green.
Bibliography
Ausubel, J.H., 1991, “Energy and Environment: The Light Path,” Energy Systems and Policy 15(3):181-188.
Ausubel, J.H., 1991, “Rat-Race Dynamics and Crazy Companies,” Technological Forecasting and Social Change 39:11-22.
Ausubel, J.H., A. Gruebler, and N. Nakicenovic, 1988, “Carbon Dioxide Emissions in a Methane Economy,” Climatic Change 12(3): 245-263.
Ausubel, J.H. and C. Marchetti, 1996, “Elektron: Electrical Systems in Retrospect and Prospect,” Daedalus 125(3):139-169.
Ayres, R.U., 1989, Energy Inefficiency in the US Economy: A New Case for Conservation, RR-89-12, International Institute for Applied Systems Analysis, Laxenburg, Austria.
Nakicenovic, N., 1996, “Freeing Energy from Carbon,” Daedalus 125(3):95-112.
Wernick, I.K. and J.H. Ausubel, 1995, “National Materials Flows and the Environment,” Annual Review of Energy and the Environment 20:463-492.
Wernick, I.K., P.E. Waggoner, and J.H. Ausubel, 1997, “Searching for Leverage to Conserve Forests: The Industrial Ecology of Wood Products in the U.S.,” Journal of Industrial Ecology 1(3):125-145.
Wernick, I.K., R. Herman, S. Govind, and J.H. Ausubel, 1996, “Materialization and Dematerialization: Measures and Trends,” Daedalus 125(3):171-198.
Five Worthy Ways to Spend Large Amounts of Money for Research on Environment and Resources
I envision a large, prosperous economy that treads lightly and emits little or nothing.
The first decade of my career I carried briefcases for William A. Nierenberg (NAE), Robert M. White (NAE), and other leaders in formulating such major research programs as the World Climate Program and the International Geosphere-Biosphere Program. An obscure fact is that in 1983 I was the scribe of Toward an International Geosphere-Biosphere Program: A Study of Global Change, the National Research Council (NRC) report that articulated and named the Global Change venture, one of the largest environmental programs of recent times. Working for the National Academies of Sciences and Engineering, I saw major efforts conceived, including the Human Genome Project, International Decade of Natural Disaster Reduction, and Superconducting SuperCollider. I learned what grand programs can and cannot do, how they are born, and what they cost. I learned that the sealing wax and string, the technical means to do research, open the new niches that we successfully explore.
Spurred by an invitation from the San Diego Science & Technology Council and hoping to rally my colleagues to glory on Earth, I here tell my top five Worthy Ways to spend large amounts of money for research on environment and resources. My top five span the oceans, land, human health, energy, and transport. All demand teams of engineers and scientists. Let’s
- count all the fish in the sea;
- verify that the extension of humans into the landscape has begun a Great Reversal and anticipate its extent and implications during the next century;
- assess national exposure of humans to bad things in the environment;
- build 5-gigawatt zero-emission power plants the size of an automobile; and
- get magnetically-levitated trains (Maglevs) shooting through evacuated tubes.
These Worthy Ways cohere in the vision of a large, prosperous economy that treads lightly and emits little or nothing.
1. Marine Census
In December 1998 for a week I sailed above the Arctic Circle in the Norwegian Sea, precisely counting herring in the dark. Over the decades of the Cold War, Norwegians honed their submarine acoustics, listening for Soviet vessels motoring out of Murmansk. This technology, integrated with others, makes possible the first-ever reliable worldwide Census of Marine Life. I prefer to say Census of the Fishes, conjuring beautiful images to Everyman. But, humanity needs to understand the diversity, distribution, and abundance of squids, jellies, and turtles, too, and so, deferring to accurate colleagues, I call this first Worthy Way the Census of Marine Life. But let me make the case primarily for fishes.
Many of the world’s leading icthyologists gathered at Scripps Institution of Oceanography in La Jolla, California, in March 1997 to consider what is known and knowable about the diversity of marine fishes.[1] The meeting attendees reported how many species are known in each region of the world’s oceans and debated how many might remain undiscovered. Known marine species total about 15,000. The meeting concluded that about 5,000 yet remain undiscovered. I find this prospect of discovering 5,000 fishes a siren call, a call to voyages of discovery in little explored regions of the Indian Ocean, along the deeper reaches of reefs, and in the mid-waters and great depths of the open oceans. The adventures of discovery of Cook, Darwin, and the explorers of Linnaeus’s century are open to our generation, too.
The urgency to cope with changes in abundance of fish amplifies the adventure of discovery. In August 1998 at the Oceanographic Institution in Woods Hole we advanced the concept of the Census at a workshop on the history of fished populations, some 100-200 of the 15-20 thousand species. From history, the assembled experts estimated that fish biomass in intensively exploited fisheries is about 1/10th the level pre-exploitation.[2] That is, the fish in seas where commercial fisherman do their best (or worst) to make a living now weigh only 10% of the fish they sought in those seas a few decades or hundred years ago.
Diverse observations support this estimate. For example, the diaries of early European settlers describe marvelous fish sizes and abundance off New England in the 1600s. From Scotland to Japan, commercial records document enormous catches with simple equipment during many centuries. Even now, when fishers discover and begin fishing new places, they record easy and abundant catches, for example, of orange roughy on Pacific sea mounts. Also scientific surveys of fish stocks indicate fewer and fewer spawning fish, mothers, compared to recruits, their offspring. The ratio of spawners to recruits has fallen to 20% and even 5% of its level when surveys began. A great marine mystery is what has happened to the energy in the ecosystem formerly embodied in the commercial fish.
The two dramatic numbers of the “missing,” the 5000 undiscovered fishes and the lost 90% of stocks, suggest the value of a much better and continuing description of life in the oceans. So, I propose a worldwide Census. The Census would describe and explain the diversity, distribution, and abundance of marine life, especially the upper trophic levels. Preoccupied by possible climatic change and the reservoirs of carbon that influence it, we have tended to assess life in the oceans in gigatons of carbon, neglecting whether the gigatons are in plankton, anchovies, or swordfish. I care what forms the carbon takes.
Three questions encapsulate the purpose of the Census. What did live in the oceans? What does live in the oceans? What will live in the oceans? The three questions mean the program would have three components. The first, probably not large or expensive, would be paleo and reconstruct the history of marine animal populations since human predation became important, say, the past 500 years.
The second and expensive part of the program would answer “What does live in the oceans?” and be observations lasting a few years, perhaps around the year 2005. We would observe the many parts of the oceans where we have so far barely glimpsed the biology, for example, the open oceans and mid-waters, together with strengthening efforts by national fisheries agencies that struggle with meager funds, personnel, and equipment to examine areas near shore where many species of commercial import concentrate.
As a maximalist, I hope to see integration and synchronization of technologies, platforms, and approaches. Acoustics are paramount, because every fish is a submarine, and acousticians can now interpret tiny noises 100 kilometers away. Optics also can detect much. For example, airborne lidars now range far, fast, and perhaps as deep as 50 meters. Lidars can also detect inexpensively if their planes are drones. And least expensive of all, smart and hungry, animals are themselves motivated samplers of their environments, and we know what they sampled if we tag them. The benefits of the technologies soar, if integrated. For example, acoustics, optics, and molecular and chemical methods can combine to identify species reliably from afar.
Answeringthe third question, “What will live in the oceans?” requires the integration and formalization that we call models. So, the Census would also have a component to advance marine ecosystem and other models to use the new data to explain and predict changes in populations and relations among them.
A major outcome of the Census would be an on-line three-dimensional geographical information system which would enable researchers or resource managers anywhere to click on a volume of water and bring up data on living marine resources reported in that area. Additionally, the observational system put in place for scientific purposes could serve as the prototype for a continuing diagnostic system observing living marine resources. A proper worldwide Census might cost a total of $1 billion over ten years. Costly, complicated observational programs prudently begin with pilot projects, to test both techniques and political will.
Not only technology and stressed fisheries but also an international treaty to protect biodiversity make the time ripe for this Worthy Way. Biodiversity now finds itself with many signatories to its Convention, but uncharted national obligations and resources. Acousticians, marine engineers, marine ecologists, taxonomists, statisticians, and others should join their talents to make the Census of Marine Life happen. In fact, some of us, supported by the Alfred P. Sloan Foundation, are trying.[3]
2. The Great Reversal
Humanity’s primitive hunting of the oceans has damaged marine habitats and populations. Fortunately on the land where humanity stands, engineering and science have infused farming and logging, so initiating the Great Reversal. The Great Reversal refers to human contraction in Nature, after millennia of extension. My measure is area, square kilometers or hectares. Simple area is the best single measure of human disturbance of environment.[4]
People transform land by building, logging, and farming.[5] First, let me speak briefly about the spread of the built environment, of “cities” broadly speaking. This includes land not only for roads, shopping centers, and dwellings, but also for lawns, town gardens, and parks. In the USA the covered land per capita ranges from about 2,000 m2 in states where travel is fast, like Nebraska, to less than a third as much in slower, more urban New York. The 30 million Californians, who epitomize sprawl, in fact average 628m2 of developed land each, about the same as New Yorkers.
The transport system and the number of people basically determine covered land. Greater wealth enables people to buy higher speed, and when transit quickens, cities spread. Average wealth and numbers will grow. So, cities will take more land.
What are the areas of land that may be built upon? The USA is a country with fast growing population, expecting about another 100 million people over the next 75 years, when the world is likely to have about 10 billion. At the New York and California rate of 600m2 each, the USA increase would consume only 6 million hectares, about the area of West Virginia or 15% of California. Globally, if everyone builds at the present California rate, 4 billion more people would cover about 240 million hectares, midway in size between Mexico and Argentina, 6 to7 Californias.
By enduring crowding, urbanites spare land for nature. Enduring more crowding, they could spare more. Still, cities will take more land. Can changes in logging and farming offset the urban sprawl?
Forests are cut to clear land for farms and settlements and also for fuel,
lumber, and pulp.[6] In America, from the time of European settlement until 1900 we chopped fervidly and made Paul Bunyan a hero. In the 20th century, however, America’s forested area has remained level, and since 1950 the volume of wood on American timberland has grown 30%. In the same interval, European forests have increased about 25% in volume. In the USA, the intensity of use of wood defined as the wood product consumed per dollar of GDP has declined about 2.5% annually since 1900. In 1998 an average American consumed half the timber for all uses as a counterpart in 1900.
In the USA, likely continuing fall in intensity of use of forest products should more than counter the effects of growing population and affluence, leading to an average annual decline of perhaps 0.5% in the amount of timber harvested for products. A conservative 1.0% annual improvement in forest growth would compound the benefits of steady or falling demand and could shrink the area affected by logging 1.5% annually. Compounded, the 1.5% would shrink the extent of logging by half in 50 years. If one half of this amount occurs by leaving areas now cut uncut, the area spared is 50 million hectares, 1/3rd more than the area of California. Changing technology, taste, and economics create similar timberland patterns in numerous countries. Since 1990 forests have increased in 44 of 46 temperate countries, excepting the Czech Republic and Azerbaijan.
Rising productivity of well-managed forests should comfortably allow 20% or less of today’s forest area of about 3 billion hectares to supply world commercial wood demand in the middle of the 21st century.[7] Unmanaged forests now yield yearly an average of 1-2 cubic meters (m3) of commercially valuable species per hectare. Potential in secondary temperate forests ranges between 5 and 10 m3. Many commercial plantation forests now reliably produce more than 20 m3 year, and experimental plots have yielded over 60 m3.
In poor regions of tropical countries such as Brazil, Indonesia, and Congo, the dominant force stressing forests remains the struggle to subsist. During the last couple of decades, the removal of tropical forests has been estimated at 1% per year. Until overcome by better livelihoods, cheap land, cheaper fuels, superior alternatives to wood in the marketplace, or taboos the one-time conversion of forests to money, cropland or fuel will continue. Nevertheless, global expansion of forests and rising incomes encourage. Indeed, about 165 million hectares once used for crops and pasture have reverted to secondary forest in Latin America alone, an area more than ¾ the size of Mexico, 4 Californias or 1 Alaska.[8]
This brings us to farms. For centuries, farmers expanded cropland faster than population grew, and thus cropland per person rose. Fifty years ago, farmers stopped plowing up more nature per capita, initiating the Great Reversal (Figure 1). Meanwhile, growth in calories in the world’s food supply has continued to outpace population, especially in poor countries. Per hectare, farmers have lifted world grain yields about 2 percent annually since 1960.
Frontiers for agricultural improvement remain wide open, as average practice moves steadily toward the present yield ceiling and the ceiling itself keeps rising. On the same area, the average world farmer consistently grows about 20% of the corn of the top Iowa farmer, and the average Iowa farmer advances in tandem about 30 years behind the yields of his or her most productive neighbor. While an average Iowa corn farmer now grows 8 tons per hectare, top producers grow more than 20 tons compared with a world average for all crops of about 2. On one hectare the most productive farmers now make the calories for a year for 80 people when their grandparents struggled to make the calories for 3.
High and rising yields are today the fruit of precision agriculture. Technology and information help the grower use precise amounts of inputs-fertilizer, pesticides, seed, water-exactly where and when they are needed. Precision agriculture includes grid soil sampling, field mapping, variable rate application, and yield monitoring-tied to global positioning. Precision agriculture is frugal with inputs, like other forms of lean production that now lead world manufacturing.
If during the next 60 to 70 years, the world farmer reaches the average yield of today’s USA corn grower (less than 40% of today’s ceiling), ten billion people eating on average as people now do will need only half of today’s cropland. The land spared exceeds the Amazonia. This sparing will happen if farmers maintain the yearly 2% worldwide growth of grains achieved since 1960. In other words, if innovation and diffusion continue as usual, feeding people will not stress habitat for Nature. Even if the rate of improvement falls to half, an area the size of India, globally, will revert from agriculture to woodland or other uses. A meaty USA diet of 6,000 primary calories/day doubles the difficulty or halves the land spared.
In summary, globally, if an additional 4 billion people pave and otherwise develop land at the present rate of Californians, cities will consume about 240 million hectares. This area appears likely to be offset by land spared from logging in the USA and other countries that now reduce their cutting of forests. The likely added land spared from crops globally over the time it takes to reach 10 billion people suggests a net worldwide return to Nature of lands equal to India or more than 6 Californias.
On land as in the oceans, anecdotes, affection for Nature, and the plight of the poor farmer and logger will impel nations to spend and prohibit. The goal of my second Worthy Way, verifying and forecasting the probable extent of the Great Reversal, is first guiding and then strengthening the actions so they will produce the hoped for conservation and restoration unalloyed by the disillusionment of failure. The distribution of lands spared will greatly affect the chances recreated for flora and fauna.
The research for the Great Reversal includes observations as well as experiments and analyses. In many parts of the world routine aerial surveying of land use confirmed by ground measurements remains far from complete or usefully periodic. Geographers, foresters, agronomists, ecologists, agricultural and civil engineers, and technologists need to agree on definitions, protocols, and priorities for building the world land information system. The long-term behavior and potential of intensively managed forests exemplify the need for experiment and analysis.
International frameworks for studying the Great Reversal exist in the Global Change program and in joint efforts of the World Bank and World Wildlife Fund for forest conservation. These programs hunger for a feasible, attractive technical vision. Excluding costs for satellites, which I believe have anyway already contributed the answers they are likely to contribute to this question, my guess is that for about $100 million we could verify the Great Reversal and forecast its probable extent. The information would chart a new sound and grand strategy for conserving the landscape and the other animals with which we share it.
3. Human Exposure Assessment
My first two Ways to spend have been Worthy because they would deepen our understanding of sea and land and create the context for protecting other life while we feed ourselves. My third Worthy Way to spendconcerns what we humans absorb from the environment. Recall our high fears and outlays for ionizing radiation, pesticides, and asbestos.
Like other animals, we take in water, food, air, and dust. Given our genes, we are what we eat in the broadest sense. Yet, little research chronicles actual human exposures. Exposure estimates often trace back to very indirect measures, such as chimney emissions. And our habits and habitats seem overlooked. Consider where Americans spend 24 hours (Figure 2). One wonders why so much exposure measurement and regulation have concentrated on traffic intersections when we are usually home sleeping. Moreover, exposures even to a single chemical may occur from contact with several media (air, water), via several pathways (hand-to-mouth transfers, food), and through several routes (inhalation, oral, dermal).
To gather information about the magnitude, extent, and causes of human exposures to specific pollutants and measure the total “dose” of selected pollutants that Americans receive, in 1994 the Environmental Protection Agency (EPA) launched a National Human Exposure Assessment Survey (NHEXAS).[9] Its ultimate goal is documenting the status and trends of national exposure to risky chemicals both to improve risk assessments and to evaluate whether risk management helps.
For pilot studies, EPA chose metals, volatile organic compounds, and pesticides and polynuclear aromatics, because of their toxicity, prevalence in the environment, and relative risk to humans—at least as EPA and perhaps the public believe. I never forget Bruce Ames’ work showing that 99.99% of the pesticides we ingest are natural.[10] In any case, EPA’s chosen classes of compounds and the expected combination of chemicals, exposure media, and routes of exposure would demonstrate and challenge currently available analytical techniques.
Phase I, demonstration and scoping projects, may already be the most ambitious study of total human exposure to multiple chemicals on a community and regional scale. It has focused on exposure of people to environmental pollutants during their daily lives. Survey participants wore “personal exposure monitors” to sample their microenvironments. Meanwhile, NHEXAS researchers measured levels of chemicals to which participants were exposed in their air, foods, water and other beverages, and in the soil and dust around their homes. They also measured chemicals or their metabolites in blood and urine provided by participants. Finally, participants completed time-activity questionnaires and food diaries to help identify sources of exposure to chemicals and to characterize major activity patterns and conditions of the home environment. Several hundred Arizonans, several hundred Midwesterners, and 60 Marylanders participated. Sample collection began in 1995 and went to early 1998. Publications are expected soon and databases in 2000.
The main purpose of the pilot study is to find the best way to conduct the full national human exposure assessment survey. Implementing representative monitoring projects to estimate the magnitude, duration, frequency, and the spatial and temporal distribution of human exposures for the USA will be a large task, involving chemists, biologists, statisticians, and survey researchers. I hope clever engineers can lighten, integrate, and automate the measurement and speed reporting.
I learned of NHEXAS while serving for three years on the executive committee of EPA’s Science Advisory Board. NHEXAS was an unpolished diamond in a lackluster research portfolio. Neither EPA’s leadership nor the Congress appreciated the Survey, so it has proceeded slowly and barely. I guess the cost to perform NHEXAS right might be $200 million over 6-7 years. I believe the USA should make a strong commitment to it, though not exactly as underway. It needs a less “toxic” bias. A national scientific conference to adjust and advance the concept might be timely.
The eventual outcomes of NHEXAS should include a comprehensive total human exposure database and models that accurately estimate and predict human exposures to environmental chemicals for both single and multiple pathways. The models would link environmental and biological data with information on human activity to estimate total human exposures to various chemicals and combinations and thus contribute to better risk assessments. We can establish proper baselines of normal range of exposure and identify groups likely to be more exposed.
We know surprisingly little about our exposures. For decades researchers have measured and tracked pollutants one at a time, often faddishly. This third Worthy Way can reduce the uncertainty about exposure and indeed make exposure a science. Understanding aggregate exposures, we may find surprisingly powerful levers to reduce ambient bads or increase goods.
4. ZEPPs
One way to finesse the question of exposure, whether for humans or green nature, is with industries that generate zero emissions. A growing gang of us has been promoting the concept of industrial ecology, in which waste tends toward zero, either because materials that would become waste never enter the system, or because one manufacturer’s wastes become food for another in a nutritious industrial food chain, or because the wastes are harmless. For this human, yours truly, I certainly want zero emissions of poisonous elements such as lead and cadmium.
For green nature exposed outdoors, however, the giga-emission is carbon, and I shall exemplify zero emission by tackling the giga-emission with my fourth Worthy Way to spend.
Today industries annually emit about 6 gigatons of carbon to the atmosphere, or a ton per each of the planet’s 6 billion people. The mounting worry is that these and more gigatons likely to be emitted will make a punishing climate for nature exposed outdoors.
Most of the carbon comes, of course, from fuel to energize our economies, and an increasing portion of the energy is in the form of electricity. Since Thomas Edison, the primary energy converted to electricity has grown in two sequential, long S-curves until it is now about 40% of all energy humanity uses. Although electric consumption leveled until recently at the top of its second S-curve, I believe it will maintain an average 2-3% annual growth through the 21st century. In the information era, consumers will surely convert even more of their primary energy to electricity. And, after all, two billion people still have no electricity. A hundred years at 2-3% growth per year would raise the world average per capita electricity consumption of 10 billion or so in the year 2100 only to today’s average USA per capita consumption.
Remembering that my fourth Worthy Way was to eliminate carbon emission, I ask what fuel generates the electricity. The evolving shares of primary energy sources, with more hydrogen per carbon atom, gradually and desirablydecarbonize the energy system from wood and hay to coal to oil to natural gas.[11] Nuclear, probably, or possibly some other non-carbon alternative will eventually close the hydrocarbon fuel era. In the interim, however, can we find technology consistent with the evolution of the energy system to economically and conveniently dispose the carbon from making kilowatts? This is my fourth Worthy Way: Finding a practical means to dispose the carbon from generating electricity consistent with the future context. The Way is what I and my associates call ZEPPs, Zero Emission Power Plants.
The first step on the road to ZEPPs is focusing on natural gas simply because it will be the dominant fuel, providing perhaps 70% of primary energy around the year 2030.[12] Although natural gas is far leaner in carbon than other fossil fuels, when natural gas does provide 70% of primary energy, CO2 emission from it will be about 75% of total CO2 emissions.
A criterion for ZEPPs is working on a big scale. A peak use of, say, 30 x 1012 m3 of natural gas in 2060, corresponds to 2 to 3 times today’s carbon emission to dispose annually. Even in 2020, we could already need to dispose carbon from gas alone equal to half today’s emission from all fuel.
Big total use means big individual ZEPPs because the size of generating plants grows even faster than use. Although the last wave of power station construction reached about 1.5 gigawatts (GW), growth of electricity use for the next 50 years can reasonably raise plant size to about 5 GW (Figure 3). For reference, the New York metropolitan area now draws above 12 GW on a peak summer day.
Plants grow because large is cheap if technology can cope. Crucial for controlling emission, one big plant emits no more than many small plants but emission from one is easier to collect. We cannot solve the carbon question if we need to collect emissions from millions of microturbines.
So far, I’ve specified my way to spend as a search for big ZEPPs fueled by natural gas. But bigger ZEPPs mean transmitting immense power from larger and larger generators through a large steel axis at a speed such as 3,000 revolutions per minute (RPM).
The way around the limits of mechanical power transmission may be shrinking the machinery. Begin with a very high pressure CO2 gas turbine where fuel burns with oxygen. Needed pressure ranges from 40 to 1000 Atm, where CO2 would be recirculated as a liquid. The liquid combustion products would be bled out.
Fortunately for transmitting power, the very high pressures shrink the machinery in a revolutionary way and permit very fast RPMs for the turbine. The generator could then also turn very fast, operating at high frequency, with appropriate power electronics to slow the output to 50 or 60 cycles. People have seen the attraction of higher RPMs for a while. High RPM generators are included in the last version of a gas turbine of the High Temperature Reactor of the General Atomics corporation.
Materials issues lurk and solutions are expensive to test. The envisioned hot temperature of 1500 degrees is what challenges engineers in aviation. Fortunately, Japanese have recently reported a tough, thermally conductive ceramic strong up to 1600o in air.[13] Problems of stress corrosion and cracking will arise.
Although combustion within CO2 does not appear a general problem, some may arise at the high temperatures and pressures. Also no one has yet made burners for such high pressures as we consider. Power electronics to slow the cycles of the alternating current raises big questions. So far, the cost of power electronics exceeds benefit. The largest systems for conversion between alternating and direct current are now 1.5 GW and can handle 50-60 cycles. Conversion costs are about $100 per kilowatt (kW), a big increment to the present $200 per kW for a simple turbine and $300-$400 for a combined cycle generator. Present limits of about 100 hertz are not fast enough to convert 30,000 RPMs to 3,600 RPM. What we envision is beyond the state of the art, but power electronics is still young, meaning expensive and unreliable, and we are thinking of the year 2020 and beyond when this Worthy Way could make it mature, cheap and reliable. Already engineers consider post-silicon power electronics with diamond plasma switches.
The requisite oxygen for the ZEPP, say, 1,000 tons/hr for a 5 GW plant, also exceeds present capacity, about 250 tons/hr by cryoseparation, but could be done. Moreover, the cryogenic plant may introduce a further benefit. The power equipment suppliers tend to think of very large and slow rotating machines for high unit power. The core of the problem is in mechanical resistance of materials. Here we might recur to superconductors that are more “in” with a cryogenic plant nearby.
With a ZEPP fueled by natural gas transmitting immense power at 60 cycles, the next step is sequestering the waste carbon. Because of the high pressure, the waste carbon is, of course, already easily-handled liquid carbon dioxide. In principle aquifers can store CO2 forever if their primary rocks are silicates, which with CO2 become stable carbonates and silica (SiO2). The process is the same as rocks weathering in air. The Dutch and Norwegians have done a lot on CO2 injection in aquifers, and the Norwegians have already started injecting.
Opportunity for storing CO2 will join access to customers and fuel in determining plant locations. Fortunately, access to fuel may become less restrictive. Most natural gas travels far through a few large pipelines, which makes these pipelines the logical sites for generators. The expanding demand will require a larger and wider network of pipelines, opening more sites for ZEPPs.
Another criterion is overall projected plant efficiency. Colleagues at Tokyo Electric Power calculate the efficiency of the envisioned ZEPP could be 70%.
In short, the fourth Worthy Way is a supercompact (1-2 m diameter), superpowerful (potentially 10 GW or double the expected maximum demand), superfast (30,000 RPM) turbine putting out electricity at 60 cycles plus CO2 that can be sequestered. ZEPPs the size of an automobile, attached to gas pipelines, might replace the fleet of carbon emitting non-nuclear monsters now cluttering our landscape.
We propose starting introduction of ZEPPS in 2020, leading to a fleet of 500 5 GW ZEPPs by 2050. This does not seem an impossible feat for a world that built today’s worldwide fleet of some 430 nuclear power plants in about 30 years. Combined with the oceans safely absorbing 2-3 Gt C yearly, ZEPPs, together with another generation of nuclear power plants in various configurations, can stop CO2 increase in the atmosphere near 2050 AD and 450-500 ppm without sacrificing energy consumption.
Research on ZEPPs could occupy legions of academic researchers, and restore an authentic mission to the DOE’s National Laboratories, working on development in conjunction with companies such as General Electric, Air Products, and General Atomics. The fourth Worthy Way to spend merits tens of billions in R&D, because the plants will form a profitable industry worth much more to those who can capture the expertise to design, build, and operate ZEPPs. Like all my Worthy Ways, ZEPPs need champions.
To summarize, we have searched for technologies that handle the separation and sequestration of amounts of carbon matching future fuel use. Like the 747 jumbojets that carry about 80% of passenger kilometers, compact ultrapowerful ZEPPs could be the workhorses of the energy system in the middle of the next century.
5. Maglevs
Cutting emissions and the footprints of farming, logging, and power, we naturally also wonder about transport. Transport now covers Earth with asphalt ribbons and roars through the air leaving contrails that could prove harmful. With cars shifting to fuel cells fed with hydrogen over the next few decades, the air transport system and its jet fuel can become emissive enemy #1. Fortunately the time is right for innovation in mobility, my fifth Worthy Way.
Since 1880, including walking, USA per capita mobility has increased 2.7%/yr and the French about the same. Europeans currently travel at about 35 km per hour and per day, because people travel about 1 hour per day. Of this, Europeans fly only about 20 seconds or 3 km per day. A continuing rise in mobility of 2.7% per year means a doubling in 25 years, and an additional 35 km per day or about 3 minutes on a plane. Three minutes per day equal about one round-trip per month per passenger. Americans already fly 70 seconds daily, so 3 minutes certainly seems plausible for the average European a generation from now. The jetset in business and society already flies a yearly average of 30 minutes per day. However, for the European air system, the projected level requires a 14-fold increase in 25 years, or about 12% per year. The USA would need a 20-fold increase in 50 years. A single route that carries one million passengers per year per direction would require 60 take-offs and landings of jumbojets. The jumbos would need to take off like flocks of birds. Unlikely. We need a basic rethinking of planes and airport logistics.
The history of transport can be seen as a striving to bring extra speed to the progressively expanding level of income within the fixed amount of time we are willing to expose ourselves to travel.[14] According to a rhythmic historical pattern (Figure 4), a new, fast transport mode should enter about 2000. The steam locomotive went commercial in 1824, gasoline engine in 1886, and jet in 1941. In fact, in 1991, the German Railway Central Office gave the magnetic levitation (maglev) system a certificate of operational readiness and a Hamburg-Berlin line is now under construction.[15],[16] The essence of the maglev is that magnets lift the vehicle off the track, thus eliminating friction, and that activation of a linear sequence of magnets propels the vehicle.
Maglevs have many advantages: not only high mean speed but acceleration, precision of control, and absence of noise and vibration. They can be fully passive to forces generated by electrical equipment and need no engine on board. Maglevs also provide the great opportunity for electricity to penetrate transport, the end-use sector from which it has been most successfully excluded.
The induction motors that propel maglevs can produce speeds in excess of 800 km per hour and in low pressure tunnels thousands of km per hr. In fact, electromagnetic linear motors have the capacity to exert pull on a train independent of speed. A traditional electric or internal combustion engine cannot deliver power proportional to speed. In contrast, the new motors allow constant acceleration. Constant acceleration maglevs (CAMs) could accelerate for the first half of the ride and brake for the second and thus offer a very smooth ride with high accelerations.
High speed does entrain problems: aerodynamic and acoustic as well as energetic. In tunnels, high speed requires large cross sections. The neat solution is partially evacuated tubes, which must be straight to accommodate high speeds. Low pressure means a partial vacuum comparable to an altitude of 15 thousand meters. Reduced air pressure helps because above about 100 km per hour the main energy expense to propel a vehicle is air resistance. Low pressure directly reduces resistance and opens the door to high speed with limited energy consumption. Tunnels also solve the problem of landscape disturbance. CAMs operating in evacuated tubes are my fifth Worthy Way.
For a subsurface network of such maglevs, the cost of tunneling will dominate. The Swiss are actually considering a 700 km system.[17] For normal high-speed tunnels, the cross-section ratio of tunnel to train is about 10-1 to handle the shock wave. With a vacuum, however, even CAMs could operate in small tunnels, fitting the size of the train. In either case the high fixed cost of infrastructures will require the system to run where traffic is intense–or huge currents can be created, that is, trunk lines. Because the vehicles will be quite small, they would run very often. In principle, they could fly almost head-to-tail, ten seconds apart.
Initially, maglevs will likely serve groups of airports, a few hundred passengers at a time, every few minutes. They might become profitable at present air tariffs at 50,000 passengers per day. In essence maglevs will be the choice for future Metros, at several scales: urban, possibly suburban, intercity, and continental.
The vision is small vehicles, rushing from point to point. Think of the smart optimizing elevators in new skyscrapers. Alternately, the physical embodiment resembles, conceptually, that of particle accelerators, where “buckets” of potential fields carry bunches of charged particles. Maglevs may come to be seen as spin-offs of the physics of the 1970s and 1980s, as transistors are seen as realizations of the quantum mechanics of the 1920s and 1930s.
With maglevs, the issue is not the distance between stations, but waiting time and mode changes, which must be minimized. Stations need to be numerous and trips personalized, that is, zero stops or perhaps one.
Technically, among several competing designs the side-wall suspension system with null-flux centering, developed in the United States by the Foster-Miller company, seems especially attractive: simple, easy access for repair, and compact.[18] Critically, it allows vertical displacement and therefore switches with no moving parts. Vertical displacement can be precious for stations, where trains would pop up and line up, without pushing other trains around. It also permits a single network, with trains crossing above or below. Alternatively, a hub-and-spoke system might work. This design favors straight tubes and one change.
The suspension system evokes a comparison with air. Magnetic forces achieve low-cost hovering. Planes propel by pushing air back. Momentum corresponds to the speed of the air pushed back, that is, energy lost. Maglevs do not push air back, but in a sense push Earth, a large mass, which can provide momentum at negligible energy cost. The use of magnetic forces for both suspension and propulsion appears to create great potential for low travel-energy cost, conceptually reduced by 1-2 orders of magnitude with respect to energy consumption by airplanes with similar performance.
Because maglevs carry neither engines nor fuel, the weight of the vehicle can be light and total payload mass high. Airplanes at takeoff, cars, and trains all now weigh about 1 ton per passenger transported. A horse was not much lighter. Thus, the cost of transport has mainly owed to the vehicle itself. Maglevs might be 200 kg per passenger.
At intercity and continental scale, maglevs could provide supersonic speeds where supersonic planes cannot fly. For example, a maglev could fuse all of mountainous Switzerland into one functional city in ways that planes never could, with 10 minute travel times between major present city pairs.
Traveling in a CAM for 20 minutes, enjoying the gravitational pull of a sports car, a woman in Miami could go to work in Boston and return to cook dinner for her children in the evening. Bostonians could symmetrically savor Florida, daily. Marrakech and Paris would work, too. With appropriate interfaces, the new trains could carry hundreds of thousands of people per day, saving cultural roots without impeding work and business in the most suitable places.
Seismic activity could be a catch. In areas of high seismic activity, such as California, safe tubes (like highways) might not be a simple matter to design and operate.
Although other catches surely will appear, maglevs should displace the competition. Intrinsically, in the CAM format they have higher speed and lower energy costs and could accommodate density much greater than air. They could open new passenger flows on a grand scale during the 21st century with zero emissions and minimal surface structures.
We need to prepare a transport system that can handle huge fluxes of traffic. A 2.7% per year growth in passenger kilometers traveled means not only doubling of mobility in 25 years but 16 times in a century, which is the rational time for conceiving a transport system. The infrastructures last for centuries. They take 50-100 years to build, in part because they also require complementary infrastructures. Moreover, the new systems take 100 years to penetrate fully at the level of the consumer. Railroads began in the 1820s and peaked with consumers in the 1920s.
It is time for my fifth Worthy Way, to conceive in detail maglevs for America. And to develop the required skills, such as tunnelling. Universities should be producing the needed engineers, operations researchers, and physicists, and government should partner with industry on the prototypes.
Like ZEPPs, maglevs will bring huge revenues to those who can design, build, and operate them, anywhere in the world.
Closing Remarks
A worldwide Census of Marine Life can reawaken the adventure of the Age of Discovery and teach us how to spare marine habitats. A study of the Great Reversal of human extension into the landscape can inspire us to lift yields and spare land for Nature. The National Human Exposure Assessment Survey can show what we absorb and how to spare exposures. ZEPPs can generate many gigawatts without harmful emissions, sparing the climate. And maglevs can multiply our mobility while sparing air and land. These Worthy Ways to spend on environment and resources cohere in the vision of a large prosperous human economy that treads lightly and emits little or nothing.
Research is a vision or dream in which we, like Leonardo da Vinci, simulate a machine first in our mind. Leonardo’s powers of visualization, one might say experiment, were so great, that the machines work, even if the letting of contracts and construction is delayed 500 years. Building machines is often costly. Dreaming is cheap. Let us start now with these Five Worthy Ways to Spend that can make dreams of improving the human condition and environment so irresistibly beautiful and true that societies, especially America, hasten to let the contracts and build the machines that can spare planet Earth–soon instead of after a delay of 500 years.
Acknowledgements: This essay was initially prepared as an address to the San Diego Science & Technology Council, La Jolla, California, 9 December 1998. Thanks to Edward Frieman and William A. Nierenberg (NAE) for hosting the visit. I am grateful to Cesare Marchetti, Perrin Meyer, and Paul Waggoner for helping develop these Worthy Ways over many years.
Figure Captions
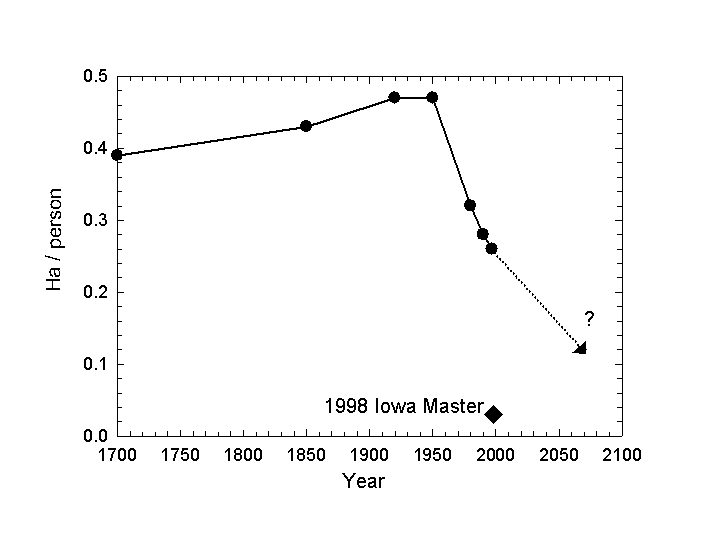
Figure 1. The Great Reversal. After gradually increasing for centuries, the worldwide area of cropland per person began dropping steeply in about 1950, when yields per hectare began to climb. The diamond shows the area needed by the Iowa Master Corn Grower of 1998 to supply one person a year’s worth of calories. The dotted line shows how sustaining the lifting of average yields 2%/yr extends the Reversal. Sources of data: FAO Yearbooks, Food and Agriculture Organization of the United Nations, various years; Wallace’s Farmer, March 1999; J. F. Richards, “Land Transformation,” in The Earth as Transformed by Human Action, B. L. Turner et al., eds., Cambridge University, Cambridge, England, 1990.
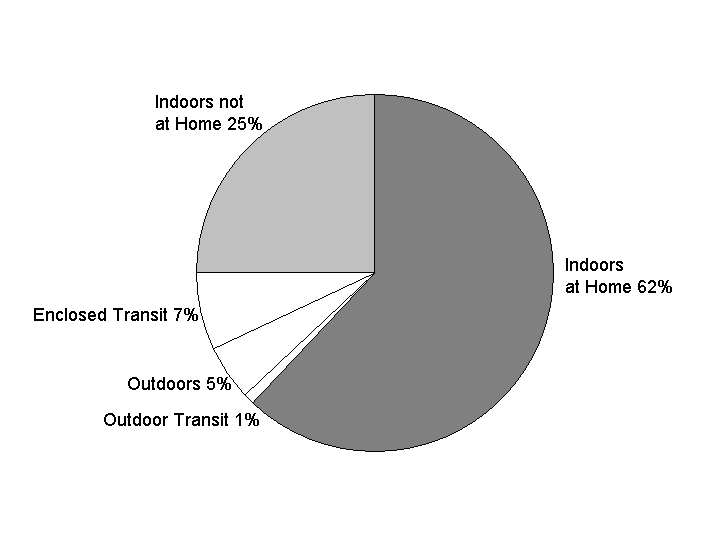
Figure 2. Percentage of time spent in major locations by Californians. Source: J. A. Wiley, J. P. Robinson, T. Piazza, K. Garrett, K. Cirksena, Y. T. Cheng, and G. Martin, Activity Patterns of California Residents, California Survey Research Center, U. of California, Berkeley, 1991.
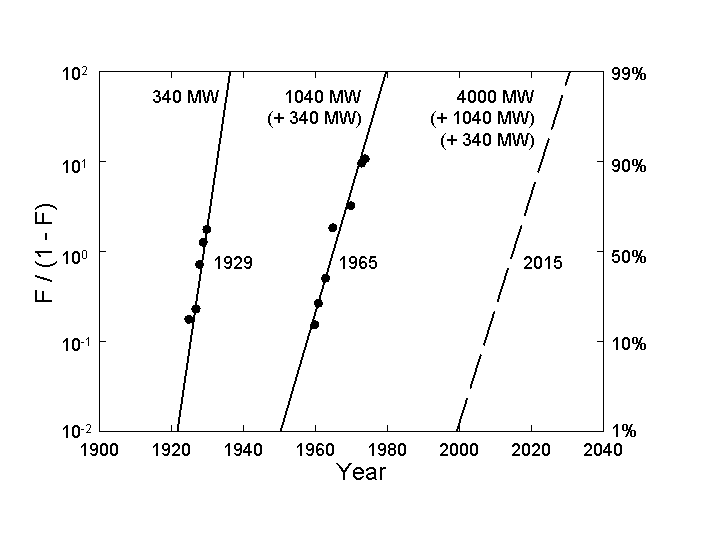
Figure 3. The maximum size of power plants, USA. Each line represents an S-shaped (logistic) curve normalized to 100 percent, with estimates for the midpoint of the process and saturation level indicated. So, the pulse centered in 1929 quickly expanded power plants from a few tens of megawatts (MW) to about 340. After a period in which plant size stagnated, the pulse centered in 1965 quadrupled maximum plant size to almost 1400 MW. The patterns for the world and a dozen other countries we have analyzed closely resemble the USA. We project another spurt in plant size centered around the year 2015, quadrupling the maximum again, to more than 5 GW. F is fraction of the process completed. Source of data: World Electric Power Data CDROM UDI-2454, Utility Data Institute, Washington DC, https://www.udidata.com/
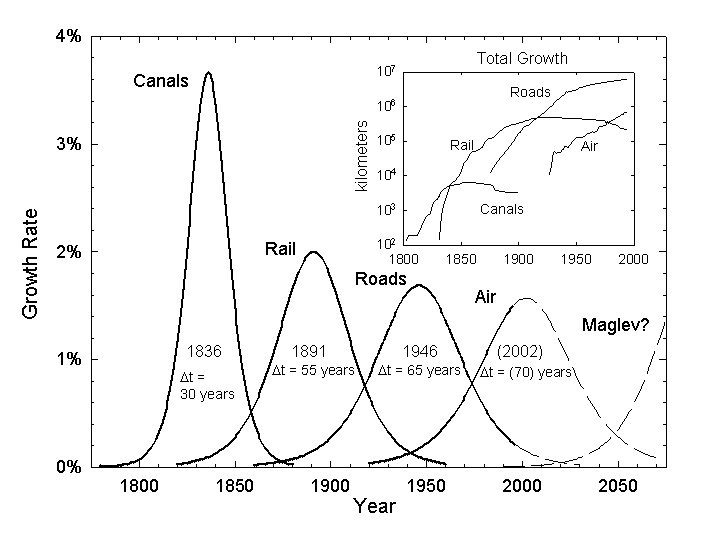
Figure 4. Smoothed historic rates of growth (solid lines) of the major components of the USA transport infrastructure and conjectures (dashed lines) based on constant dynamics. The years are the midpoints of the processes, and delta t is the time for the system to grow from 10% to 90% of its extent. The inset shows the actual growth, which eventually became negative for canals and rail as routes were closed. Source: Jesse H. Ausubel, C. Marchetti, and P.S. Meyer, Toward Green Mobility: The Evolution of Transport, European Review 6(2):137-156, 1998.
References
[1] William A. Nierenberg, The Diversity of Fishes: The Known and Unknown, Oceanography 12(3):6-7, 1999.
[2] John H. Steele and Mary Schumacher,On the History of Marine Fisheries, Oceanography 12(3):28-29, 1999.
[3] https://phe.rockefeller.edu/fish
[4] “Thus, in spite of all the interest in fragmented populations, the primary aim in conservation should be simply to preserve as much habitat as possible.” (p. 47) Ilkka Hanksi, Metapopulation Dynamics, Nature 396:41-49, 1998.
[5] Paul E. Waggoner, Jesse H. Ausubel, Iddo K. Wernick, Lightening the Tread of Population on the Land: American Examples, Population and Development Review 22(3):531-545, 1996.
[6] Iddo K. Wernick, Paul E. Waggoner, and Jesse H. Ausubel, Searching for Leverage to Conserve Forests: The Industrial Ecology of Wood Products in the U.S. , Journal of Industrial Ecology 1(3):125-145, 1997.
[7] Roger A. Sedjo and Daniel Botkin, Using Forest Plantations to Spare Natural Forests, Environment 39(10): 14-20 & 20 & 30, 1997.
[8] Joyotee Smith, Can Secondary Forests Mitigate Primary Forest Depletion? Implications from Small-Scale Farms in the Peruvian Amazon, International Center for Tropical Agriculture (e.smith@cgnet.com).
[9] Special Issue on NHEXAS, Journal of Exposure Analysis and Environmental Epidemiology 5(3): 1995.
[10] Ames, B.N., Profet, M. and Gold, L.S., Dietary Pesticides (99.99% All Natural). Proceedings National Academy of Sciences USA 87:7777-7781, 1990.
[11] Jesse H. Ausubel, Energy and Environment: The Light Path, Energy Systems and Policy 15:181-188, 1991.
[12] Jesse H. Ausubel, Arnulf Gruebler, and Nebojsa Nakicenovic, Carbon Dioxide Emissions in a Methane Economy, Climatic Change 12:245-263, 1988.
[13] Toshihiro Ishikawa et al., A Tough Thermally Conductive Silicon Carbide Composite with High Strength up to 1600o C in Air, Science 282: 1295, 1998.
[14] Jesse H. Ausubel, C. Marchetti, and P.S. Meyer, Toward Green Mobility: The Evolution of Transport, European Review 6(2):137-156, 1998.
[15] MVP (Versuchs- und Planungsgesellschaft für Magnetbahnsysteme m.b.H), Die offizielle Transrapid Homepage, URL https://www.mvp.de/, Munich, Germany, 1997.
[16] MIKA, J., Transrapid Informations Resourcen Homepage, URL https://transrapid.simplenet.com/, Germany, 1997.
[17] Jufer, M., Swissmetro: Wissenschaftliche Taetigkeit der ETH-Lausanne und Zuerich, Hauptstudie-Zwischenbericht Juli 1994-Juni 1996, ETH-Lausanne, Switzerland, 30 August 1996. URL https://sentenext1.epfl.ch/swissmetro.
[18] U.S. Department of Transportation, Compendium of Executive Summaries from the Maglev System Concept Definition Final Reports, DOT/FRA/NMI-93/02, pp. 49-81, March 1993. On-line at https://www.bts.gov/smart/cat/CES.html
The Environment Since 1970
[NOTE This is a draft of a paper that has recently appeared (slightly modified) in the journal Consequences: The Nature and Implications of Environmental Change 1(3):2-15, 1995]
A generation marks the average timespan between the birth of parents and that of their offspring. In the minds of many 1970 marked the birth of the modern environmental movement, symbolized by the first observance of “Earth Day” in April of that year. As the second green generation begins, it seems wise to measure the environmental changes since 1970.
In this paper we consider green change in three ways. First, we examine the underlying forces of economic and population growth. Second, we look at indicators of the environment per se. Third, we check changes in management and institutions. In all cases, we seek quantifiable, objective measures. We observe what people have done rather than what they say.
We recognize the great interest in changes in moods and attitudes with respect to the environment. These may determine the actions on which we report. However, we limit ourselves here to phenomena that can be recognized and counted in a relatively impartial way. We intend this paper to serve those seeking a factual survey in essay form. At the conclusion we list the main sources of data.
Underlying forces of growth and development
In 1970 global population was estimated at 3.7 billion. In 1995 it is believed to have reached 5.7 billion. Some 90 percent of the growth took place in developing regions. Population growth slowed in the last two and a half decades, but only to a rate that leads demographers to hope that global population may eventually stabilize between double and triple current levels. While in 1970 about 65 percent of world population remained rural, by 1995 45 percent were concentrated in towns and cities. Urbanization has been fastest in developing countries, where the cities grew by almost one billion people. The continuing heavy toll from “natural” disasters is Bly associated with large and growing populations in risk-prone areas, such as flood plains and low-lying coastal regions.
Total world commercial energy consumption grew at the same rate as population, from the equivalent of a little over 5 billion tons of oil in 1970 to just under 8 annually now. Thus, global per capita commercial energy consumption has stayed level. Per capita commercial energy consumption in low-income countries more than doubled. Absolute consumption remains centered in the wealthy industrialized nations, where 15 percent of the world’s population consume over half its energy.
Not only has energy use increased, but the estimates of energy resources that might eventually be tapped have grown. Contrary to expectations that the world would begin to exhaust its so-called fossil (hydrocarbon) fuels, proven reserves of oil have increased from 600 billion barrels in 1970 to 1,000 at present, even though over 500 billion barrels of oil have been pumped from the ground in that time. Proven reserves of natural gas have tripled over the last twenty-five years. The possibility that some environmental issues would diminish because of depletion of exhaustible resources has thus become more remote.
In some respects, the global energy system has evolved in a cleaner direction. While many were predicting increased reliance on “dirty” fossil fuels such as coal and oil shale, the reverse is occurring. The share of world primary energy served by natural gas, the cleanest fossil fuel, has increased by over a quarter. Compared with coal and oil, burning natural gas releases lower quantities of carbon dioxide as well as pollutants such as sulfur dioxide and particulates.
Between the early 1970s and 1990, the energy intensity, measured in energy used per dollar of gross domestic product, decreased in 19 of 24 advanced industrialized nations belonging to the Organization for Economic Cooperation and Development (OECD). Energy efficiency has increased. The average rate of improvement that has persisted in the OECD nations doubles efficiency in about 30 years. However, overall efficiency remains extremely low, with more than 90 percent of energy lost or wasted in the complete process of conversion from the raw material such as coal to the final energy service such as the light to read a book. Further large increases in energy efficiency are clearly attainable through diffusion of existing best practices and technological progress.
Much of the expanded consumption of energy has been channeled into electrification. World production of electricity increased one and a half times since 1970. Electricity consumption increased more rapidly than non- electric energy in both industrialized and developing countries. As with growth in primary energy consumption, electrification has been more rapid in developing countries. In Africa, for example, increases in electrification have nearly doubled the world rate. In contrast to the experience of industrialized countries, most electricity in Africa has come through expanded use of fossil fuels.
Generally, with electrification has also come a trend away from fossil fuels, primarily through expanded use of nuclear power, especially in industrialized countries. Although the future of nuclear power remains uncertain and national experiences with nuclear programs differ, in one generation the capacity of operating nuclear plants has increased more than twentyfold. The world of the 1990s is much more nuclear than 1970, with 420 nuclear power plants providing 7 percent of the world’s primary energy, and about a quarter of the electric power in the industrialized nations. Over six nuclear reactors operate today for every one in 1970. Globally, 55 nuclear plants were under construction in 1994. Chernobyl and other nuclear accidents have heightened nuclear fears that were less apparent in 1970. The shift from carbon-heavy fuels such as coal and oil to carbon-light gas and the growth of nuclear power contribute to the gradual “decarbonization” that is the central tendency of the world energy system.
With more people and more energy has come more travel. Global affluence has vastly increased mobility. The number of motor vehicles in use worldwide has more than doubled to the imposing figure of about 600 million. Automobility in countries with rapid economic growth such as Japan has increased fastest. North America had slower but substantial absolute growth, expanding its fleet from about 120 million motor vehicles in 1970 to about 220 million in the early 1990s. Car population in developing countries has increased steeply, but it remains unclear whether cars will pervade these societies as they do the North. Since the first 747 began passenger service in 1970, global air travel grew by a factor of five, much faster than car travel.
With larger and wealthier populations have also come important changes in agriculture that affect the environment. Most change has come through intensified production, as the global area of arable and permanent cropland has changed little since 1970. World fertilizer consumption nearly doubled from 1970 to the mid-1980s and has remained about level since. As with growth of energy consumption, the largest percentage increases were in low income countries. Currently, low income countries apply fertilizer at about 90 percent of the rate in high income countries; in 1970 the ratio was only 17 percent. Globally, increased mechanization, irrigation, and other changes yielded two-thirds more grain from the same hectare of land in 1994 than 1970. The use of pesticides does not appear to have expanded in industrialized nations, and in some it has decreased, while in Asia it has more than doubled. Few data exist for pesticide and herbicide trends in developing countries, but use has almost certainly increased substantially.
Several cycles of more productive seeds have been bred and put into use for many crops since 1970, and the number of gene banks, the source of raw materials out of which better crops grow, has multiplied tenfold. Yields for staple crops such as wheat and rice have grown faster than human population. Overall, food production has kept pace with population, even in sub-Saharan Africa, where many of the world’s poorest countries are located. Still, perhaps one-fifth of the world population remains hungry. Trade in agricultural products has expanded dramatically. Present cereal imports to Asia are almost double those of 1970. The direction of dietary behavior, toward higher meat consumption (including fish and poultry) with higher income, has not changed.
The reported world catch of fish has risen at one and half times the rate of world population growth. Accurate knowledge of the conditions of stocks remains inadequate, but commercial harvesting has definitely caused significant changes in the catch and species composition. The makeup of the catch has moved down the food chain as the stock of higher species, such as tuna, decrease. With wild stocks under pressure, aquaculture is beginning to play a significant role in seafood production. Fish farms produce about one- seventh of world seafood by weight and one-third by value.
More energy, travel, and food indicate some success in social facets of development. For example, since 1970 infant mortality in developing countries has dropped by 40 percent, and life expectancy at birth expanded by 5-10 years. Rates of adult literacy in the developing countries have grown substantially, especially in low income countries. Access to safe drinking water in developing countries has grown at double the rate of population.
By conventional monetary measures the absolute economic gap between rich and poor countries has widened in the last decades. The rate of growth of per capita income in the wealthier nations doubled that in the low and middle income countries between 1974 and 1991. As a result, the industrialized nations increased their share of global GDP from three quarters to almost four-fifths even as their share of global population declined.Differences in “human development,” a combination of indicators of literacy, life expectancy, and other societal measures have narrowed overall. Some developing countries with higher than average measures of economic growth have not achieved particularly high measures in other facets of development. Educational indices measured as overall school enrollments and mean years of schooling show a continuing discrepancy between the industrialized North and the developing South. While the relative incidence of poverty, illiteracy, and hunger has declined or remained constant, absolute numbers of deprived people have in almost every case increased. Moreover, in major areas of the world, notably Sub-Saharan Africa, indices of welfare have declined.
Since 1970 the composition of economic activity has continued to shift from agriculture via manufacturing to services. In some nations, the share of the workforce engaged in agriculture and in manufacturing has dropped steeply. Some service industries such as information processing, exemplified by the personal computer, have reached levels unanticipated twenty-five years ago. The environmental issues of the information and services age, such as tourism and solid waste disposal, have fully joined those of manufacturing and agriculture.
Environmental protection, which has been directed primarily at reducing health effects of environmental degradation, is taking place in the context of increased worldwide spending on health. This is evident in developing and industrialized countries alike. The doubling of world spending on health as share of GNP since 1970 indicates changing preferences that come with economic development. Environment and health are linked through channels ranging from irrigation waters that can harbor disease-carrying snails to the ventilating systems of office buildings and homes. Remarkably little is known in any country about actual or cumulative human exposures to environmental pollutants in air, water, soil, and food and how these may be changing.
In sum, production, consumption, and population have grown tremendously since 1970. The gross world domestic product increased to about $24 trillion in 1994, over twice the value in 1970 after accounting for inflation. Globally and on average economic and human development appears to have outpaced population growth.
Direct indicators of the environment
Indicators for environmental issues may be grouped by geographical scale, namely those associated with large areal or global issues; those primarily significant at a regional level; and those at a local level. Of course, many threads connect.
Globally, much attention has focused on projected climatic change because of the fears of the potentially far-reaching consequences of a drastic warming and associated sea level rise. To date, human-induced global climatic change is associated principally with emissions of carbon dioxide (CO2) from burning of fossil fuels in developed countries. The 1980s were an unusually warm decade, following the cool period that culminated in the early 1970s, suggesting for many that anthropogenic global warming is now evident. From 1970 to the early 1990s, fossil fuel emissions of CO2 grew 50 percent, about as much as population, so that per capita emissions have remained level. Meanwhile, atmospheric concentrations of CO2 have increased 10 percent. In some economies, including France and the United States, per capita emissions decreased due to improved energy efficiency and decarbonization. The United States remains far the largest emitter of greenhouse gases. The abundance of other greenhouse gases has also continued to rise. Atmospheric methane increased an average of 1 percent annually until 1992, when its growth slowed. Greenhouse gas emissions from developing countries have risen steeply. The developmental choices of these countries appear most fateful for the future composition of the atmosphere.
The second truly global environmental concern is depletion of the stratospheric ozone layer by chlorofluorocarbons (CFCs) which could lead to increased exposures to ultraviolet light harmful to human health and affecting the productivity of ocean plankton and land plants. Production and use of CFCs concentrate in the industrialized countries. Production grew steadily in the early 1970s and leveled later in the decade, when the United States and a few other industrial countries banned particular uses of CFCs. International protocols on substances that deplete the ozone layer, signed in 1987 and amended in 1990 and 1992, phase out fifteen CFCs by 1996. Phase out of halons, another ozone-depleting substance, was completed in 1993. Developing countries have a 10-year delay in implementing commitments. The sudden detection in the mid-1980s of a “hole” in the ozone layer in the spring over Antarctica catalyzed signature of agreements. Measurements from the past few years suggest that ozone depletion continues at a rate more rapid than predicted, spreading in area, and appearing in the Arctic and mid-latitudes as well. Documentation of increased consequent ultraviolet radiation at the surface of the Earth remains elusive.
A third global issue is preservation of biological diversity, much of which resides in tropical forests. Estimates of the total number of species range from three to more than eighty million; the number named stands at around 1.5 to 1.8 million, and cataloging new species progresses slowly. As vegetation is reduced in many parts of the world, as many as half the species may be at risk. However, data on species loss are poor; much of what is lost is unrecorded, associated with the destruction of ecosystems in areas that have been largely unstudied. The rate of worldwide species extinction may be known only within a factor of 10. Even in the United States, statistical problems are considerable, as evident in the government list of endangered and threatened species. Since 1970 the number has doubled, but inclusion is limited to well-described plants and animals. Fluctuations in the listing result partially from procedural, administrative, and political forces and do not necessarily reflect changes in the natural environment. Declines in numbers of prominent species such as the African elephant, panda bears, and sea turtles are well-documented.
Loss of habitat, particularly wetlands, is well-documented for many countries. Coastal marine regions remain under great pressure, the effect of coastal population growth and development, associated changes in water quality, increased marine debris and pollution, and destruction of habitat, including mangrove forests, sea grasses, and coral reefs. The rise of interest in biodiversity stems not only from anthropocentric concern about the potential practical value of species but from ethics that emphasize the intrinsic value of all species and ecosystems.
Integral to the issue of biological diversity is the question of deforestation, in particular in tropical regions. Globally, forest cover today appears to be about 80% of what it was 3,000 years ago, when agriculture began to expand. In the past twenty-five years, according to data reported by governments, global wooded areas have diminished slightly. In the temperate zone, forests have generally increased during recent decades, a signal development. While cutting threatens stands of older and rarer trees, the majority of tree-harvesting in this zone is done on a sustainable basis. Removal of tropical forests has progressed at rates estimated at 1 percent per year and higher, as forests are cleared for fuelwood, crops, and pastures. Asian and South American wood production since the 1970s was 70% higher than the global average, further suggesting deforestation. The proportion of the world’s land surface used for farms and pastures has remained constant at about 35 percent since mid-century. Though much of the land surface has been altered by human action, human artifacts actually cover less than 1 percent.
On a regional scale, acid deposition, mainly caused by emissions of sulfur dioxide (SO2) and nitrogen oxides (NOx), emerged in the 1970s as a major issue in North America and Europe, and to a lesser extent in East Asia. In the United States, SO2 emissions are primarily from electric power plants and have dropped a third since 1970, though pressure for reductions probably came more from concerns about the local effects of SO2 on air quality and health than from acid rain. NOx emissions, from automobiles as well as power plants, remain steady with some annual fluctuations. Decreased emissions of SO2 are evident in lower rainwater sulfate, but the acidity of rainwater has still generally increased in prone regions. Red spruce trees, among the vegetation apparently most susceptible to acid rain, show diminished growth, although the extent to which acid precipitation is the cause is uncertain.
Transboundary acid deposition also occurs in Japan from Chinese and Korean emissions, but we lack long-term records of the extent of this problem. Emission, transport, and deposition of acid-causing emissions occur elsewhere, especially where fossil fuels are heavily used, but sparse data and knowledge of regional meteorological conditions clouds assessment of the problem. The numerous other natural and anthropogenic changes pressing upon ecosystems make hard the attribution of effects to acid rain.
Another issue with regional (as well as international and local) implications is storage and disposal of nuclear wastes. With the rise of nuclear electrification, the volume of spent fuel and other wastes has risen substantially but is still small. In the United States, the volume from commercial power plants is lower than expected twenty-five years ago because the number of plants actually constructed has not reached projected levels. Defense nuclear wastes are large contributors to the total waste volume. In the United States the environmental problems of defense nuclear operations are now public, and considerable government resources have been allocated for site remediation. Little reliable information exists on nuclear waste in the former Soviet Union, but anecdotes suggest a severe problem. Earlier disposal practices, such as dumping of low-level nuclear waste at sea, have been completely stopped by formal treaty because of environment-related concerns. Improved regimes for transport, storage, and disposal of nuclear wastes have been designed but not fully tested.
On a local scale, many trends in environmental quality are well- documented, because environmental policy began by addressing such issues as urban air pollution.
In the United States, the number of persons living in areas violating the National Ambient Air Quality Standards (NAAQS) for ozone in the lower atmosphere fell by over 10 percent from 1984 to the early 1990s. National ambient concentrations of ozone, as well as carbon monoxide, have dropped by over 40 percent since 1970. The reduction was achieved through technological changes that yielded lower emissions of pollutants from transportation. The nearly complete elimination of leaded gasoline largely accounts for reduction in airborne lead levels by a factor of 20. However, with growth of vehicle fleets and accompanying gridlock, chronic pollution of urban air has not much lessened in the United States and in some areas worsened. In the Los Angeles area, strategies to prevent further deterioration of air quality have roughly compensated for population growth. The serious problems of urban ozone pollution in that area have not changed much since the late 1970s. In Japanese cities conditions have also roughly tracked urban population growth.
The record for other air pollutants is similarly mixed. SO2 pollution has generally lessened considerably in the cities of the industrialized world. Trends in nitrogen dioxide are mixed; in many cases concentrations have become markedly higher. Particulate concentrations have improved in many cases, but not by much. In France a dramatic drop occurred due to the shift from fossil fuels to nuclear power. Possible health effects of air pollutants provide the main basis for air quality standards. Yet, relatively little is known about the collective and cumulative effects of atmospheric pollutants on human health, particularly members of sensitive groups.
In developing countries, many of the largest cities suffer acute air pollution problems. During the 1980s, major Chinese cities such as Beijing and Shanghai exceeded World Health Organization (WHO) standards for particulate levels an average of 272 and 133 days per year respectively. The average in New Delhi over the same period was 295 days. Since the mid 1970s, SO2 levels exceeded the standard an average of 100 days per year in Teheran. In 1991 in Mexico City air quality standards were seriously violated over 300 days. Indoor air pollution is a sometimes severe problem that has been recognized and measured only recently. Asian households using wood- and dung- fueled ovens experience indoor particulate concentrations greater than one hundred times the WHO standards.
Another problem of intense local concern is disposal of wastes. Rates of municipal waste production have increased linearly with time in the United States in the 1970s and 1980s, but have not grown as fast as GDP. In many areas the limited capacity of landfills has led to rising costs for waste disposal and attempts to export wastes to more distant locations, sometimes in other nations. Consumption of specialized materials such as aluminum and plastics continue to grow. Global steel production grew at half the rate of population and a quarter the rate of GDP. The amount produced in electric arc furnaces, which rely almost exclusively on scrap, has more than doubled. The number of enabling technologies and markets for recycled materials continues to increase, but the gains have not fully offset growth in primary consumption. Overall, evidence of global “dematerialization” or decreasing intensity of materials use is inconclusive.
No single overall trend summarizes marine and water pollution. Since 1970 the amount of oil spilled annually has fluctuated with sporadic large departures from the mean, as in 1991 due to the Valdez oil spill in Prince William Sound. The number of tanker accidents was lower in the 1980s and early 1990s than the 1970s. The decreases probably owe to improved technical standards for petroleum transportation over the last two and a half decades. Although commanding less public attention than spills, “normal” operational discharges of oil into the sea, primarily from washing tanks and discharging ballast water, form the largest source of marine oil pollution and remain hard to assess. Inland water bodies, such as the Aral Sea in Central Asia, groundwaters, and many rivers in both developing and industrialized regions have continued to experience major problems as a result of combinations of imprudent irrigation, diffuse pollution sources such as urban runoff, fertilizer and pesticide use, and contamination from both active and inactive industrial sites. Some water bodies have been reclaimed. For example, on average the availability of dissolved oxygen in the rivers of the OECD nations improved over the past twenty-five years, though much remains to achieve high levels of water quality.
The prevalence of several environmentally hazardous materials has diminished considerably. Strontium-90 has dropped sharply worldwide since the 1960s when atmospheric testing of nuclear weapons was banned. In the United States, levels of PCBs (used as coolants in power transformers) and lead (used in various forms in gasoline, cables, pipes, paint, and industrial chemical processes) have declined dramatically in the last decades as adverse health and environmental consequences have been identified and policy responses formulated and implemented. Despite being banned, their persistence in the environment has kept them a leading topic of toxicological research. Previous disposal of these and other hazardous wastes has contaminated many locations around the world, and the catalogue of these sites has grown. In the United States, documentation and remediation predominantly concern previously contaminated sites, with few new sites created.
Changes in management and decision-making
The source of some of the successes in decreasing environmental risks shows in indicators of environmental management and institutions. Among such indicators are the number of laws and regulations governing environmental matters, the level of expenditure on environment, application of technology to environmental problems, and the creation of institutions to deal with environmental issues.
In the United States, the number of federal laws for environmental protection has more than doubled since 1970. Compliance with laws also reportedly increased, though data are sparse. The number of acts and regulations relating to environment in the United Kingdom increased from 6 in 1885, to 21 in 1945, to about 100 in 1970, and has tripled since then to about 300. The environmental directives and decisions of the European Community were initiated about 1970 and grew to almost 200 by 1990. The number of multilateral agreements on environment, which totaled about 50 in 1970, now nears 200. The point of maximum activity in the process of making rules for environment appears to have occurred about 1980.
Spending is a second indicator of response to environmental issues. In the United States, real spending on pollution abatement doubled since 1970 and currently exceeds $90 billion annually. Industry spends most. U.S federal outlays for natural resources and environment more than doubled in real term from 1970 to over $22 billion in 1994. U.S. federal environmental R&D now totals about $5 billion, likely more than doubling the comparable 1970 sum.
Pollution control commonly mandates abatement technologies, whose diffusion provides another indicator of trends in environmental protection. One example is flue gas desulfurization (FGD), which removes SO2 before release to the atmosphere. In Japan, capacity for FGD has increased nearly thirty-fold since 1970. Germany has imposed strict FGD requirements as a result of concern over dying forests. Another example is catalytic converters for automobile exhausts. In the United States these were introduced in the mid-1970s and are now found on more than 90 percent of the vehicle fleet. Many countries do not yet require or enforce auto emission controls. Technological solutions can also help reduce threats to water quality. In the United States, the fraction of the population served by wastewater treatment plants has doubled since 1970 to 75 percent of the population, typical of the OECD as a whole.
To curb pollution, many government regulators, especially in the industrialized world, have recently turned to voluntary agreements that are flexible to allow for innovation by the private sector. In Japan more than forty thousand such agreements have been concluded since the early 1970s. Within firms, innovative practice is becoming more preemptive, as the trend is towards pollution prevention. Successful instances of pollution prevention must now be numerous, but non-releases are hard to quantify.
Increased governmental spending and oversight has led to the creation of institutions, governmental and non-governmental, devoted to environmental protection. Globally, the number of ministerial-level departments of environment has increased from fewer than 10 in 1970 to over 100. Green political parties have formed in many countries. In 1992 the United Nations convened an ‘Earth Summit’ on environment and development that was attended by over 100 heads of state. The summit responded to and encouraged global environmental awareness and urged individual countries to set coherent priorities through national plans which most countries prepared in advance and many are updating. Tangible products were treaties on biodiversity, climate, and tropical deforestation as well as the establishment of an ongoing Commission on Sustainable Development to monitor progress in implementing international environmental commitments and the ideals of “sustainable development”. Formed in 1972, the United Nations Environment Programme (UNEP) has grown to be a substantial organization engaged in information exchange, monitoring, and coordination of national programs for environmental protection. The World Bank, UNEP, and the United Nations Development Programme created a Global Environment Facility (1991), as the main multilateral mechanism to provide funds to developing countries for complying with environmental commitments.
Non-governmental environmental organizations (NGOs) have multiplied, roughly tripling in the United States between 1970-1990. Increasingly, NGOs provide services previously reserved by governments, and distribute funds from international organizations and national governments. The NGO liaison unit with UNEP had 726 member organizations in 1993, a figure which has risen steadily since 1972. The non-governmental Scientific Committee on Problems of the Environment (SCOPE), the premiere international scientific network of environmental scientists, has published more than 40 authoritative reviews since its founding in 1969 by the International Council of Scientific Unions. New domestic institutions that bridge the public and private sectors to address particular issues such as clean up of hazardous waste sites have also been created. Numerous proposals have appeared for new international organizations, including regional networks and centers.
One of the most important strategies for environmental protection has been through zoning and reservation of lands. National forests, nature parks, and similar areas represent resources set aside, with various levels of restrictions, to conserve the environment. In most countries the area of protected lands has continued to increase. Internationally, since the mid 1980s the amount of land protected rose almost 90 percent. Because of a few large acquisitions, the area of the national park system in the United States has more than tripled since 1970.
Conclusions
Our review of the past 25 years suggests the following:
The record of recent change in environmental quality is uneven. The common view that the environment is deteriorating in almost all respects is not justified. Several important trends are moving favorably as a result of applications of science and technology as well as behavioral and policy shifts in both developing and industrialized countries. For example, energy intensity, the source of major environmental problems when fuels are dirty, is decreasing, and the fuel mix is decarbonizing, signifying a shift to cleaner sources. Moreover, societies have mobilized to a remarkable extent to address environmental issues.
Keeping pace with environmental considerations may become harder. Consumption and population growth continue to offset efficiency gains so that in many cases and places environmental burdens become heavier. Humans have to be ever smarter, if we are more numerous and if each one of us on average is processing more materials. Pressure on the environment seems bound to increase in many urban and coastal areas. The need for innovation and diffusion of environmentally more benign technology is enormous and growing.
People are demanding higher environmental quality. The lengthening list of issues and policy responses reflects not only changing conditions and the discovery of new problems, but also changes in what human societies define as problems and needs. On the one hand, survival requires environmental protection. On the other, with higher income preference rises for environmental amenities. Where development succeeds, the preference for environmental goods will grow. Where development fails, environmental deterioration may become worse and bear blame for impoverishment.
Environmental issues are increasingly shared and international. Pollutants cross borders, effects cross borders, and world markets link the sources and consequences of the problems. The issues are also international because key technologies are selected on a global basis, so that a nation desiring an alternative style of development can hardly maintain an island of independence from the international system. Driving forces, such as the energy system, are fundamentally global.
Developing countries are most at risk from environmental problems. Connected to industrialization and urbanization, environmental issues on the agenda in industrialized nations now manifest themselves intensely in the developing world before these countries solve earlier environmental problems associated with population growth and poverty, such as deforestation. Moreover, in some respects vulnerability of developing countries to environmental hazards may be increasing, for example, through population growth in low-lying coastal areas prone to flooding.
Knowledge of environmental issues has progressed rapidly but remains tentative, partial, and insufficiently widespread. Reliable foresight of environmental changes has improved, as has our ability to detect change. Yet, many environmental changes are still poorly documented, especially in developing countries. Human exposures to environmental risks are not well- documented. Surprises, such as the Antarctic ozone hole, have occurred. While our understanding of individual issues has advanced, potential interactions and cumulative effects of problems merit much more study.
We have prepared ourselves to solve the environmental problem. Even with the gaps in knowledge, society at all levels has articulated the environmental problem over the past twenty-five years and recognized many ways to address its sources and manifestations. The burdens humans place on the environment and the resources of knowledge and money at our disposal to modify and adjust these burdens will contest endlessly. But we can surely gain green ground over the next 25 years.
Data note
Numerous sources provided the data for this text. Several which stand out for general utility are referenced below. The biennial World Resources offers the widest range of environment-related data with continental and global aggregates; the United Nations Development Programme’s annual Human Development Report groups countries by income level and is the best source for data for social indicators; the World Bank’s annual World Development Report similarly groups countries by income and is the leading source for global and national economic data; British Petroleum’s annual Statistical Review of World Energy is an authoritative source on world energy consumption classified by individual countries and major energy sources; the annual Statistical Abstract of the United States and Environmental Quality report are rich sources for detailed U.S. data and include some global information as well. For more specific information on references to these and other sources, please contact the authors.
World Resources. 1987, 1990-1, 1992-3, 1994-5. World Resources Institute. New York: Oxford University Press.
Human Development Report. 1990-4. United Nations Development Programme. New York: Oxford University Press.
World Development Report. 1992-4. World Bank. New York: Oxford University Press.
BP Statistical Review of World Energy. 1994. The British Petroleum Company, Employee Communications & Services. London, UK: Dix Motive Press Ltd.
Statistical Abstract of the United States, 114th edition. 1994. U.S. Department of Commerce.
Environmental Quality, 23rd Annual Report. 1991-3. Council on Environmental Quality. Washington, D.C.: U.S. Government Printing Office.
Acknowledgment: We thank Peter Elias for research assistance.
Note: An antecedent of this paper by Ausubel and Victor appeared in “International Environmental Research and Assessment,” pp 55-70. New York: Carnegie Commission on Science, Technology, and Government, 1992.
Appendix
Data Sources for “The Environment Since 1970”
Data on world population by geographical region are collected by the United Nations and presented in the annual United Nations Statistical Yearbook (New York: UN), as well as World Resources Institute’s biennial World Resources (New York: Oxford University Press). Population divided along lines of economic development is reported by the World Bank in, the annual World Development Report, (New York: Oxford University Press). Urban and rural populations are disaggregated in the United Nations Development Programme’s annual editon of the Human Development Report (New York: Oxford University Press). A complete survey of world commercial energy, including data on reserves, is found in British Petroleum’s annual BP Statistical Review of World Energy (London: BP); the World Development Report conveniently aggregates energy consumption according to level of economic development. Energy intensity for the United States and other member countries of the Organisation for Economic Co-operation and Development (OECD) is reported annually in OECD: The State of the Environment (Paris: OECD). On efficiency, see R.U. Ayres, 1989, “Energy efficiency in the US economy: A new case for conservation” (Laxenburg, Austria: International Institute for Applied Systems Analysis, RR-89-12). Data on electrification (including nuclear energy) are compiled in World Resources, as well as OECD, 1994, Electricity Information 1993 (Paris: OECD). Information on the number of operating nuclear power reactors is available from the International Atomic Energy Agency, 1994, Nuclear Power Reactors in the World (Vienna: IAEA). On decarbonization see, J.H. Ausubel, 1992, “Industrial ecology: Reflections on a colloquium,” Proc. Natl. Acad. Sci. USA 89(3):879-884. Global and continental vehicle data are from the Motor Vehicle Manufacturers Association (MVMA), Motor Vehicle Facts and Figures ’93 (Detroit, MI: MVMA), and earlier editions; air travel data are from the United Nations’ Statistical Yearbook.
The annual United Nations’ Food and Agriculture Organization Production Yearbook (NY: UNFAO) compiles data from many sources on arable and permanent cropland and includes data on global fertilizer use. Data on crop yields are from B.R. Mitchell, 1988, European Historical Statistics 1750-1975 (NY: Facts on File), the UNFAO, and the U.S. Department of Agriculture’s PS&D View database; fertilizer usage and total caloric intake are from the World Bank’s World Development Report. Trends in the mechanization of agriculture are reported in the U.N. Statistical Yearbook; World Resources contains partial global data on pesticide use; comprehensive data for the U.S. are reported by the Council on Environmental Quality annual publication Environmental Quality (Washington: U.S. Government Printing Office). Trade in agricultural products is from the U.N. Food and Agriculture Organization, and selected data are printed in the U.N. Statistical Yearbook; see also U.N. Conference on Trade and Development, 1990, UNCTAD Commodity Yearbook (New York: United Nations). Growing use of gene banks is discussed in D.L. Plucknett et al., 1983, “Crop germplasm conservation and developing countries,” Science 220, 163-169. Production and yield of rice are from the International Rice Research Institute annual World Rice Statistics. Dietary data are available in the U.N. Statistical Yearbook; detail on the changing diet of the U.S. population is compiled in the U.S. Department of Commerce annual Statistical Abstract of the United States (Washington: Government Printing Office). Data on the world catch of fish and aquaculture statistics are from The State of the Environment, see also D. Pauly and V. Christensen, 1995, “Primary production required to sustain global fisheries,” Nature 374, 255-257.
Data on per capita income are taken from the World Bank’s, World Tables 93, (Baltimore: Johns Hopkins University Press). Infant mortality, life expectancy, access to safe drinking water, and adult literacy data are found in the UNDP’s Human Development Report, which also describes the “human development index”, a combination of economic and social indicators of development. Trends in the distribution of economic activity in agriculture, manufacturing, and services are from the World Development Report; data on the number of personal computers sold and in use are reported in Statistical Abstract. Spending on health as a percentage of GNP is reported in the Human Development Report. Gross World Product data are from the World Development Report.
Data on CO2 emissions from fossil fuels and cement, and methane emissions are from World Resources. Concentrations of greenhouse gases are from the Mauna Loa station (CO2) and other measuring stations and are reproduced in Environmental Quality and in World Resources. These two publications also reproduce data on production of CFCs from company reports to the Chemical Manufacturer’s Association. Methane data are in R.J. Cicerone and R.S. Oremland, 1988, “Biogeochemical aspects of atmospheric methane,” Global Biogeochemical Cycles 2:299-327. Decreases in the early 1990’s in the growth rate of atmospheric methane are reported in E.J. Dlugokencky et al., 1994, “A dramatic decrease in the growth rate of atmospheric in the northern hemisphere during 1992,” Geophysical Research Letters 21, 45-48. A summary of statistics on the loss of ozone over Antarctica and at high latitudes is found in R.T. Watson et al., 1988, Present State of Knowledge of the Upper Atmosphere 1988: An Assessment Report, NASA Ref. Publ. 1208. Worldwide ozone- loss is discussed in R.S. Stolarski et al., 1991, “Total ozone trends deduced from Nimbus 7 TOMS data,” Geophysical Research Letters 18, 1015-1018. Data on species are found in K. J. Gaston and R. M. May, 1992, “Taxonomy of taxonomists,” Nature 356, 281-282. The number of endangered and threatened species on the U.S. list is from the U.S. Department of the Interior, Fish and Wildlife Service, Office of Endangered Species and is also reported in Environmental Quality. Wetlands data for the U.S. are from Environmental Quality. Wooded areas data are from the United Nations’ Statistical Yearbook. World Resources reports information on the global wood trade; the OECD Environmental Data: Compendium 1989 (Paris: OECD) contains data on the export of wood products such as panels from all countries. Some data on changes in forest cover and resulting estimated CO2 emissions are reported in World Resources 1990-91, but these are controversial. One estimate of the increase in pastures (and decrease in forests) in Costa Rica is found in N. Myers, 1984, The Primary Source: Tropical Forests and Our Future (New York: Norton), p.132. Global land use data are in A. Gruebler, 1992, “Technology and global change: land-use, past and present” (Laxenburg, Austria: International Institute for Applied Systems Analysis).
Emissions of sulphur dioxide and nitrogen oxides in the U.S. are from Environmental Quality. Sulphate concentration and acidity of rainwater can be found in the OECD Compendium. Trends in the growth of red spruce trees are for the period 1970 to 1980 and are reported in National Research Council, 1983, Acid deposition: Long-term Trends (Washington: National Academy Press). The volume and radioactivity of nuclear wastes are from Environmental Quality; ocean dumping of nuclear wastes is discussed in OECD’s Compendium.
Data on the number of violations of the ozone standard from the National Ambient Air Quality Standards are from Environmental Quality . Emissions and average daily maximum concentrations are reported in Environmental Protection Agency, 1990, National Air Quality and Emissions Trends Report, EPA-450/4- 90- 002, as well as Environmental Quality. Similar (but less extensive) data on the Japanese environment are found in Environment Agency of the Government of Japan, 1988, Quality of the Environment in Japan. Data on particulate and SO2 levels in large cities in the developing world exceeding WHO standards are from World Resources. Municipal waste production in the U.S. is from the United States Environmental Protection Agency’s Characterization of Municipal Solid Waste in the United States: 1992 Update, Final Report. EPA Report No. 530-R-92-019. (Washington: Government Printing Office). On dematerialization, see I.K. Wernick, R. Herman, S. Govind, and J.H. Ausubel, “Materialization and dematerialization: Measures and trends,” in Technological Trajectories and the Human Environment, eds. J.H. Ausubel & H.D. Langford (Washington DC: National Academy) in press. Trends in recycling for some countries are published in the OECD Compendium. Data on global steel production broken by method of production are from the Statistical Abstract which includes world data on the volume and number of oil spills. Other marine and water data are in the OECD Compendium. Environmental Quality contains sample data on the levels of PCBs, Sr-90, and lead in the environment.
The number of environmental protection laws in the U.S. is reported by R.E. Balzhiser in J.L. Helm (ed.), 1990, Energy: Production, Consumption, and Consequences (Washington: National Academy Press). Multilateral agreements on the environment, as well as domestic spending for air and water environmental protection, are summarized in the U.S. Council on Environmental Quality’s Environmental Quality. Further information on multilateral agreements and organizations is found in L.K. Caldwell, 1990, International Environmental Policy: Emergence and Dimensions (Durham: Duke University Press), P. Brackley ed.; 1990, World Guide to Environmental Issues and Organizations (Harlow, Essex: Longman); and the 1987 European Environmental Yearbook (Washington DC: BNA). Data on U.S. expenditures on pollution abatement are from the Statistical Abstract. For a detailed account of U.S. federal environmental R&D funding see K.M. Gramp et al., 1992, “Federal funding for environmental R&D,” (Washington, DC: American Association for the Advancement of Science). Flue gas desulfurization capacity in Japan is from the Quality of the Environment in Japan report. The U.S. population served by waste water treatment plants is summarized in the U.S. Department of Commerce’s Statistical Abstract. Data on the number of environmental NGOs are from T. Princen and M. Finger, 1994, Environmental NGOs in World Politics, (London: Routledge). Data on protected areas are found in World Resources and refer to categories I-V established by the International Union for Conservation of Nature and Natural Resources (IUCN). Acreage of the U.S. national park system is from the Statistical Abstract.
Jesse Ausubel directs the Program for the Human Environment at The Rockefeller University in New York City, where Iddo Wernick is a research associate. Ausubel drafted the 1983 National Research Council report, “Toward an International Geosphere-Biosphere Program: A Study of Global Change,” the document which originated the IGBP and first employed the term “global change” in reference to environment. David Victor leads the program on compliance with international environmental commitments at the International Institute for Applied Systems Analysis (IIASA) in Laxenburg, Austria.