Area of Research: Forests, Farms and Materials
Comparative LCA of concrete with natural and recycled coarse aggregate in the New York City area
Lightening the Tread of Population on the Land: American Examples
Dematerialization and secondary materials recovery in the U.S.
Returning forests analyzed with forest identity
Dematerialization: variety, caution, and persistence
Searching for Leverage to Conserve Forests: The Industrial Ecology of Wood Products in the United States
Introduction
Belief that environmentally responsible consumers and industries will benefit the natural environment comes easily. Establishing how much is elusive. Here we examine the technical and economic components of consumption, processing, and forestry as they affect U.S. timber harvest. So far as we can, we put numbers on them to identify opportunities where change can lever the greatest environmental improvement. We draw our confidence for doing so from the straightforward flows of forest materials and their highly visible and measurable source: the forest.
Forests provide a bounty to humanity. They yield wood to make shelters and furnish them, paper to store information and wrap products, and fuel to heat living rooms and generate electricity. In the United States the timber removed annually from the forest weighs more than twice the annual consumption of all metals combined (Wernick and Ausubel 1995). Forests also provide natural services. They retain soil and water, essential for terrestrial ecosystems, and sequester atmospheric carbon in trees, understory, litter, and soil. From 1952 to 1993 the carbon stored in U.S forests grew one-third, adding close to 9 billion metric tons, equal to more than six years’ present U.S. emissions of carbon from burning fossil fuels (Birdsey et al. 1993). Forests also shelter animals, not the least of which are human beings enjoying the beauty of the forest and the gratification of conserving it (Clawson 1985).
Harvesting, processing, and using timber products can kill the golden goose. Logging roads slice through ecosystems. Aggressive overlogging lays waste landscapes and deprives species of habitat. Although paper mills have improved, they have polluted streams and still use notable amounts of water. Discarded paper and wood comprise 40% of the annual additions to municipal landfills (U.S. EPA 1994).
Humans, however, moderate these environmental impacts, good and bad alike. Projections of the effect of humans harvesting timber on forests in the future must reflect changes in the components that connect consumers, millers, and foresters to nature. Consumers encompass a cast of carpenters, publishers, and homeowners warmed by wood fires and guided by styles, prices, and rules; millers encompass saw and paper mills responding to customers, stockholders, and regulations; and foresters encompass landowners as well as people in foresters’ green uniforms responding to interest rates, prices, and restrictions. We begin our analysis by sketching the record of U.S. forest cover to identify the salient factors affecting the demand for wood and the extent of the forest. We agree with William Hyde (19971) that for measuring the environmental impact of timber products, “a simple area measure of land actively used for timber management and harvest is sufficient and that, generally speaking, the smaller the total land area in commercial wood production the more environmentally friendly the forest practice.”
Each phase of activity from consumption and disposal back to processing and forestry contributes to the human impact on the forest and the general environment. Shifts in construction and manufacturing that use forest products, changes in consumer practice, and availability influence what will be harvested and where (Ince 1995). The decision whether discarded forest products are burned, buried, or bought as raw material modifies how much new wood must come from the forest and whether the products burden society or constitute a resource. While the manner in which saw and paper mills convert incoming timber into products may pollute, the ability to squeeze more product from each log certainly diminishes the need to fell more trees. Foresters help determine the short-term impact of logging and the long-term adequacy of timber supplies.
We assess the changing forces or components that affect timber consumption, processing, and growth and harvest, and thus the forest. The principles of industrial ecology guide our assessment both in seeking to reveal opportunities or leverage for greater material efficiency in the use of timber and in relating timber consumption in the human economy to its impact on the natural environment. Our aim beyond minimizing waste is to locate the greatest leverage for conserving forests and their benefits.
Definitions and Trends
In 1992 forest land, defined as land at least 10% stocked by trees, covered 32% of the United States. Since 1900 the expanse of forest land has remained relatively constant, while cropland grew and grazing land shrank. The residual “other” land grew; it includes military and other federal and state areas, primarily for recreation and wildlife, land in built-up urban areas, and rural transportation (Fedkiw 1989; U.S. Bureau of the Census 1996).
Timberland, which can produce an annual minimum of 1.4 m3 of industrial wood per hectare (ha), comprises about two-thirds of U.S. forestland. (A hectare covers 2.47 acres, and the standard for timberland is 20 cubic feet per acre.) Most of the remaining forestland falls short of the productivity of timberland, but some is excluded from timberland by government reservation. The ownership of timberland affects its management. For example, the forest industry may quickly replant what it cuts on the land it owns, whereas other private owners may lack incentives to do so (Colberg 1996).
U.S. timber consists of softwoods, such as loblolly and ponderosa pine, which are valued for pulp and construction, and hardwoods such as sugar maple and oak, which are valued in furniture. The harvest of trees of both types total to form the removals of “roundwood.” Roundwood can become the solid products lumber, composites, and plywood and veneer for construction and furniture. It can become pulp and fuel.
Well before Europeans arrived, indigenous North Americans cleared and burned forests to encourage game, establish settlements, and grow crops. Then settlers from across the ocean harvested wood for homes and cities and accelerated the conversion of forests to farms. Nevertheless, until the middle of the nineteenth century, the clearing and use disturbed only a tenth of the vast American forest of over 400 106 ha (Figure 1). Then, from about 1850 until 1910 fires, loggers, and farmers cleared forests at an unprecedented rate. Railroads, westward expansion, need for cropland, surging demand for fuel and lumber, and better methods for cutting trees and clearing land shrank American forests 80 106 ha (Sedjo 1995), about the combined area of Washington, Oregon, and California, or Mozambique.
Then clearing subsided. Near the beginning of the twentieth century, concern about the rapid depletion of U.S. forests found voices in such leaders as Theodore Roosevelt and Gifford Pinchot, who saw to the firm establishment of the National forests and enshrined “conservation.” Other measures and policies begun at this time bolstered fire protection, discouraged losses to insects and disease, and protected wildlife (MacCleery 1992). Both conservationist sentiments and owners’ wish to protect an investment until it yielded timber motivated these measures. The nation also began establishing a domestic scientific base for forestry and trained the first cohort of professional American foresters.
Other pressures on forest land subsided as well. Substituting oil for oats reduced demand for cropland, as internal combustion replaced horses pulling plows and buggies and lessened the need for land to grow feed. Near mid-century the yield of food from a given plot of land began to rise, further lowering the pressure to clear land for crops. So, like forestland, since 1940 the extent of American cropland has been about level despite doubling population. Concurrently, many farms initially cleared in the eastern parts of the country reverted back to woodland. The greater agricultural productivity combined with the protection and replanting of forest to help stabilize the area of U.S. forests, even with the rising timber and grain harvests and the active reserving of forestlands from timber harvest (Waggoner et al. 1996).
Where timber is harvested changes as years pass. The area available for logging in the Pacific Northwest, much of it in National forest in the past, fell a full quarter (~2.8 106 ha) in the 1990s while conservationists sought to protect the spotted owl. As a percentage of the total U.S. harvest in the year, the Pacific Coastal region declined from 30% in 1970 to only 23% in 1992, almost entirely softwood. In the same period, the Southern softwood removals rose from 26% to 36% while Southern hardwoods remained near 20% of all U.S. removals. The North continued to contribute about 5% as softwood and 12% as hardwood. The Rocky Mountain region contributed 4% to 6%, all softwood. In volume, imports (mostly finished goods) and exports (largely raw materials) form only about 10% of U.S. wood commerce and roughly balance.
Since the middle of the twentieth century, U.S. forests, despite increasing harvests, have been reborn (Clawson 1979). The periodic inventories of timber volume conducted by the U.S. Forest Service confirm their rebirth (figure 2). The 29% growth of total volume from 1952 to 1992 was comprised of an 80% growth of hardwood plus only 4% of growth of softwood (Powell et al. 1993). Furthermore, the volume of hardwood trees larger than 48 centimeters in diameter doubled, while the volume of large softwood trees fell 30%.
Demand for softwood, slowly growing supply, and even shrinking supply of large softwood trees have encouraged the intensive management of plantations of valuable softwoods, which are expected to raise supplies as plantations mature in the first decades of the next century (Haynes et al. 1995). The plantations are most prevalent in the South, which contains more than half of U.S. forest industry land. In 1990 plantations occupied one-eighth of Southern timberland, and by 2030 are projected to occupy two-thirds of the area and contribute three-fourths of the Southern softwood harvest (Environmental Defense Fund 1995). Although the forest industry occupies only about one-seventh of total U.S. timberland, its land produces a full fifth of national timber growth, a quarter of the growth of softwoods, and about a third of the annual timber harvest. Also, in 1995 the industry did more than 40% of the planting and 70% of the stand improvement (Moulton et al. 1996).
European colonists nibbled at the American forests, and then the Industrial Revolution and expansion across the continent accelerated the cutting. By the early twentieth century, however, conservationist sentiment and action, substitutes for timber, and management slowed the shrinkage of the forest and allowed its rebirth. Despite an overall rise in timber removals, the last half of the twentieth century shows rising inventories in U.S. forests, although hardwoods have grown more than softwoods. How have increasing population and wealth and the practices of millers and foresters contributed to this outcome?
The Forest Product Flow
When people write letters, saw boards, or throw logs on the fire, they draw on a material flow that reaches from their use or consumption through more or less processing all the way to the cutting down of a tree. To understand how consumption of forest products affects the forest, we must inspect the efficiency of the entire flow and where the leverage lies for improving materials efficiency and reducing environmental disturbance. Beginning at the consumption or demand end, we can follow the flow and analyze the reasons for the draw on forests.
To analyze national consumption, we rely on an identity evident in the dimensions of its units, according to the three actors: For paper, for example,

In other words, the number of people times their share of (GDP) times the sheets of paper per GDP times the amount of wood a miller uses to make a sheet of paper times the area a forester uses to grow that amount of wood determines the forest affected. Our framework falls within the family of attempts to measure the contributions of population, money, and technology as they affect the environment. Some of these go under the rubric of the “IPAT” equation, for Impact = Population x Affluence x Technology. However, our evidence shows, more technology does not simply multiply impact. For reviews, see (Wexler 1996) and (Dietz and Rosa 1994).
Most of the components of this identity can easily and reliably be expressed in numbers. We know, for example, the numbers of Americans, the dollars of GDP, and the tons of paper consumed or produced in the United States. The third component, however, the expanse of forest affected to harvest a particular quantity of wood is, as will be shown, less definitely expressed as a number. Nevertheless, the equation identifies the components and orders them logically, and thus it can help reveal the leverage of diverse actions for changing our impact on the forest.
Charting flows of materials is fundamental to industrial ecology because it reveals the most strategic and practical levers for minimizing waste, reducing the exploitation of virgin resources, and lessening harmful emissions (Wernick and Ausubel 1997). Drawing on Ince (1995) and others, figure 3 presents our summary of the flows of wood by volume of the U.S. wood products industry. A flowchart could also describe weight, taking into account as well the changing moisture in wood and the mineral fillers in manufacture, which may comprise 3% to 5% by weight of the U.S. paper consumption (Barsotti 1994). Nevertheless, this flowchart suffices for the analyses to follow.
The left side of figure 3 shows that 646 106m3 of wood entered the U.S. economy in 1993, the most recent year for which data adequate for the chart are available. Trees furnished 78%, recycling 10%, and imports 12%. The right side of figure 3 shows that 26% was consumed as solid wood, 26% as paper, 36% as fuel, and 10% exported. In between, figure 3 diagrams the millers’ processing of wood. For example, sawmills received 200 106m3 for lumber. The dotted lines indicate the considerable residues from making sawn lumber and composite materials that found their way into other mill processes, especially papermaking and fueling the mills themselves. As explained in the caption to figure 3, we assume that paper mills converted into fuel fully 100 106m3 of wood not used as fiber.
Along the way, some wood was lost. The categories of Other Removals (timber removed to thin stands or clear land) and Logging Residues (wood left on the forest floor) never enter our commercial flow, although their relative quantity is shown by the height of the rectangles in figure 3. Only 1% of the wood reaching millers is later unaccounted, the difference between the amounts entering and leaving the Miscellaneous and Unused box in figure 3. Once wood enters the flow through processing to consumption, very little goes unused, as we shall discuss later.
Consumers
For consumers, we ask how their draw on the forest changed during this century. The bottom line is that U.S. consumption of all timber products grew 70% between 1900 and 1993 (figure 4). The largest feature of the 93 years is the big growth of pulp—that is, paper and paperboard—toward parity with the consumption of lumber, which rose little. Fuelwood nearly disappeared and then reemerged; plywood and veneer consumption emerged but remained small.
As suggested in the identity in the preceding section, the consumers’ levers on the flow of forest products are their numbers (Population), wealth (GDP per person), and the amount of product consumed per dollar GDP. We now examine each of these component variables.
We choose five ten-year periods to illustrate the story. The periods 1900–1909 and 1984–1993 bracket the century. In between, 1925–1934 shows the decline into the Great Depression, 1936–1945 the recovery and World War II, and 1973–1982 the shock of high oil prices. The relative or percentage rates of change were estimated for all ten-year periods 1900–1993 by regressing the natural logarithm of population, GDP per person, and product per GDP on year. We exemplified the periods we dubbed Depression, Recovery and War, and Oil Shock by the ten years with the most extreme rate of change of GDP within the general periods justifying the three names. The segments of the bars in the upper panels of figures 5–7 show the annual change of components during the five periods, and their sum, which is the annual change in national use, is shown by the solid bars in the lower panel. The values of the segments of the bars for annual changes of population and GDP per person are of course the same in the three figures.
Americans now number more than three times as many as in 1900. Averaging a 1.3% yearly rise, the American population grew fairly steadily during this century from the combination of natural increase and immigration. Recently, the population has been growing at about 1% per year, half the rate early in the century. So the segments for the annual change in population gradually shrink in height moving from left to right in figures 5–7.
The growth of GDP per American also ended the studied interval of the twentieth century somewhat slower than it began. Averaging a 1.7% yearly growth, it fluctuated between annual extremes of a 4% fall entering the Depression and a faster than 8% rise during the Recovery and War, as the segments in figures 5–7 show. After nearly a century of fluctuations, an American’s average share of GDP had grown nearly fivefold.
The combination of growing numbers and GDP per person raised GDP 16 times while timber consumption failed to double. To understand the difference, we must examine the third component of our identity, timber product per GDP.
This component is the parameter industrial ecologists call “intensity of use” (IOU) (Malenbaum 1978). It is the product, usually measured in weight or volume, consumed per unit GDP, illustrated in the identity in the preceding section by paper per GDP. If IOU is constant, the identity specifies that consumption will rise in unchanging proportion to the combined rise of population and wealth per person. Further, if they rise only a few percent per year, consumption will rise as the sum of their percentages. Two percent more people and 2% more GDP per person will always raise consumption 2 + 2 + 0, or 4%. If newspapers replace gossip and thus raise paper’s intensity of use 2%, then its consumption will rise 2 + 2 + 2, or 6% per year. If thinner replaces thicker paper and television replaces newspapers and thus lowers the intensity of paper per GDP 2% per year, then consumption will rise only 2 + 2 – 2, or 2% per year. Thus style, ethics, and technology, sometimes acting through markets and prices, modify the effects of population and wealth. The change in absolute national consumption of a product is simply the sum of the three components of the identity.
The national statistics that we use to calculate IOU (USDA 1993, table 645 and predecessors) have the virtue of consistency from 1900–1993 and will show trends in consumption broadly. Precisely, however, they are the consumption of “industrial roundwood used for lumber, etc.” In the equation above we nicely separated product per GDP from wood per product. Because the statistics we use are not precisely the product but the industrial roundwood used for the product, the nice separation of product per GDP from wood per product in the equation is therefore blurred. We admit that the statistical series we use incorporates some of the millers’ success in getting more product per wood and thus affects the calculated IOU. We discuss the millers’ contribution in a separate section.
The 70% rise in consumption of all the timber products depicted in figure 4 corresponds to an annual rise of about 0.5%. During the same period GDP was rising about 3% per year. The difference of about 2.5% between them is the decline in the intensity of use of the total products. Americans became more efficient in terms of timber products, annually making their GDP with 2.5% less wood. How did the changes in the solid material, paper and fuel combine to make this change of the total?
For solid material, which includes lumber, and plywood and veneer, an examination of all ten-year periods within 1900–1993 reveals a few periods when the IOU rose. Generally, however, the intensity of use of solid wood product fell, as illustrated by the five periods in figure 5. The general decline of intensity of use compensated for the rise of population and wealth and tempered the growth of national consumption of solid wood.
For paper, represented by the consumption of the raw material pulp, IOU began the century by rising several percent per year (figure 6). The increase continued even in the Depression, countering the fall of GDP per person to maintain national consumption of pulp nearly unchanged. During the Recovery and War, however, pulp consumption per GDP fell, and it has always fallen since the mid-1950s. During the recent End period, the falling IOU of pulp actually decreased national consumption of pulpwood for paper slightly.
Unlike the persistent decline in the IOU of solid wood and the rise and then fall of pulp, fuelwood per GDP fluctuated dramatically, requiring a doubling of the vertical scale in figure 7. These figures do not consider the use of wood residues for fuel discussed in the next section. During the Begin and End periods, the IOU of fuel declined enough to lessen the national consumption shown in the lower panel. Fuelwood IOU soared high during the Depression, but plummeted even deeper during Recovery and War. The explosive rise in both fuel per GDP and its national consumption during the Oil Shock should be no surprise.
An examination of the consumers’ role in forest products logically begins with the worry that, for example, twice as much wealth or twice as many people drawing on the forest will double humanity’s impact. We test this assumed proportionality by dissecting the components Population, GDP per person, and Product per GDP from the national consumption of products. We find the proportionality wanting.
The ratio of forest products to GDP changes. Sometimes a product per GDP rises, amplifying the effect of population and affluence on the national consumption. The growth of fuelwood per GDP in the Oil Shock and of pulp during the early decades of the century provide examples. On the other hand, products per GDP can also fall, tempering the effect of population and affluence on the national consumption. The general decline throughout the century of solid wood products per GDP and the decline since the mid-1950s of pulp per GDP illustrate the absence of a constant proportionality between national consumption and population plus affluence.
Mathematically, what can lower the intensity of use, the ratio of timber to GDP? First, anything that raises GDP more than timber use. Armament during the Recovery and War ballooned production that used relatively little forest product. During this period, the divisor GDP rose faster than national consumption of solid material and pulp, lowering product per GDP at the same time that national consumption went up. Sometimes, however, as with solid material during the Depression, the intensity of use falls because the numerator of national consumption falls even more rapidly than does GDP.
Practically, what changes product per GDP? In the case of solid material, its replacement during the century by steel and concrete in applications from furniture and barrels to cross ties and lath lowered the intensity of use. Living in the stock of existing houses, using wood economically to support loads, and prolonging the life of timber products by protecting them from decay and fire lower it. Because sawn lumber still dominates the consumption of solid wood, its shrinkage by technology and substitution seems the opportunity for further lowering by lesser intensity of use.
In the case of paper, more widespread literacy and the shift to a service economy raised the intensity of use in the early twentieth century. Then recently, as figure 6 shows, we might speculate the onset of dematerialization (Wernick et al. 1996), as telephones and magnetic files replace letters and manuscripts. Because writing and packaging consume much pulp, both offer opportunities for further lightening in IOU.
Generally during the twentieth century, the use of fuelwood per GDP declined as coal and oil displaced it. Entering the Depression and the petroleum crisis, however, people burned the fuel at hand—wood—even though it is bulky and inconvenient, propelling upward its consumption per GDP. We see that in America as in many developing countries poverty and costly oil cut forests.
Entering the Depression, American families still burned much wood to heat homes. Now, as evident in the fuel box in the right-hand column of figure 3, industry consumes more. Insofar as that consumption is smart industrial ecology, that is, using wood that would otherwise be wasted in harvest or milling, lowering its intensity of use may or may not help the forest.
The falls in intensity of use for all three forest products at the end of our histories show accomplishments for technology and substitution of other materials or ways of fulfilling wants (figure 8). Americans have lowered the timber product to house a family, send a message, and power a steam engine by 2.5% per year during the century, offsetting the 3.0% growth of population and GDP per person. Even prolific memo writers have not kept U.S. per capita consumption of timber products from falling to half its 1900 level. The preeminent feature is that while growing population and wealth multiplied GDP 16-fold, the consumption of timber products less than doubled. The opportunities of letters in mailboxes still to be displaced by e-mail and telephone poles still to be displaced by cell phones illustrate that consumers have leverage to lower intensity of use still more.
Millers
Chicago meatpackers used to boast that they learned to sell everything but the squeal of the pig. How efficiently do millers mill? A perfect miller would transform 100% of the wood received into the highest valued products with no pollution. By their evolving practices, have millers raised or lessened their demand on forests? The data keep our calculations to the last three to four decades.
First, we touch on some environmental effects of mills beside their demand for trees. To reduce their emissions and effluents, paper mills have responded to environmental mandates with technologies such as electrostatic precipitators, scrubbers, and advanced water treatment systems (Armstrong et al. 1994). Requiring oxygen for its decay, the high organic content of paper mill effluents can asphyxiate organisms in streams. Since 1959, U.S. paper mills reduced biological oxygen demand per ton of paper by over 90% and releases of total suspended solids by about three-quarters. Pressure to lower emissions of certain chlorinated compounds has spurred research into substitutes for elemental chlorine such as chlorine dioxide (ClO2), which reduces dioxin formation, and alternatives to sodium chlorite (NaClO) to reduce chloroform generation. Peroxide processes can obviate the need for chlorine in bleaching paper.
In 1994 the 15 manufacturing sectors that make up the Lumber and Wood Products Sector of the U.S. economy (Standard Industry Code (SIC 24) generated about 19 103 metric tons of total production-related waste reported in the U.S. Environmental Protection Agency annual Toxics Release Inventory (TRI), less than 0.2% of the national total. A price of longer-lasting products, preservatives such as creosote and toluene used for wood preservation form the largest volume of toxic wastes (Inform 1995). More important, the Paper Sector (SIC 26) released about 150 103 metric tons in 1994, down from 190 in 1988. Much of the TRI reduction comes from more efficient water use. In advanced water treatment, the average mill recycles process water up to six times.
So, millers have been doing better at sparing harmful exposures. Have they also been sparing forest? The value of sawmill products declines from solid lumber, to plywood and composite products made from glued chips, strands, and particles, and finally to chips and dust for paper or fuel. We look at these in turn.
Solid wood products
Prime strategies for sparing forests are to get more of the valuable lumber from logs and to find uses for irregular shapes, waste, and unused species of trees. Industrial research and collaborations with government bodies such as the U.S. Forest Product Laboratory have yielded useful innovations. Best Open Face technology optimizes the initial line for sawing, and the Edge-Glue & Rip method reduces the wood lost in edging. The Saw-Dry-Rip method increases the defect-free lumber available from hardwoods (U.S. Congress Office of Technology Assessment 1984). Sharper and more stable blades can increase lumber recovery from logs by 5% to10% (USD. Forest Service 1982). The various improvements have caused the ratio of lumber to roundwood to rise from 33% in 1970 to 42% in 1993 (Grantham and Howard 1980; Ince 1994). Had efficiency remained at the 1970 level of 33%, meeting actual 1993 consumption of the 84 106m3 lumber shown in figure 3 would have required 84/0.33 or 252 106m3. So, by improved practice in this area alone, millers have spared the forest the need to yield that 252 less the 200 flowing into lumber in figure 3, a substantial saving of 52 106m3. The need to obtain rectangular boards from round logs finally limits the yield of sawn lumber, at least until geneticists engineer square trees.
The amount of plywood obtained per log has stayed relatively stable since 1970. However, new technologies peel smaller diameter logs and peel all logs to smaller-diameters. Again, sharper and more stable blades have made a difference (USDA Forest Service 1982).
The greater efficiency with inputs is matched in lower unused residue rates (figure 9). Since the 1950s the amount of unused residues dropped by about 30 106m3, and some of this has surely lessened the demand to fell other trees. From more than 26% of the roundwood required for lumber in 1970, millers lost less than 2% of the residues from lumber manufacture in 1993 (Grantham and Howard 1980; Ince 1994).
Former wastes or discards have become new products. Mills have expanded the number and quality of composite products from wood chips and sawdust that compete with and complement solid lumber in construction and industry. The expanding niche for composites relies on the clever use of wood residues and organic adhesives. Composites like parallel laminated veneer, medium-density fiberboard, and insulation board form points on a continuum from solid lumber to paper that use wood and fiber to make products (Maloney 1996). Particleboard made from residues as well as Oriented Strand Board (OSB) made from strands of previously unused aspen and other species were largely absent from the inventory of wood products in 1970. From almost zero production in mid-century, composites (including plywood) totaled about 32 106m3 in 1993, requiring input materials of 53 106m3, for a ratio of 60%. Had lumber met this market with its present 42% efficiency, roundwood input of 76 106m3 would have been required. Thus one might say the development of composites has spared 23 106m3 in addition to the amount of former waste they incorporate, now about 9 106m3.
By 1993 the composites plus plywood comprised 28% of solid products, up from the 19% comprised of plywood alone in 1970. In these products, adhesive makes small pieces of wood more valuable. Several of the products can also use some of the tens of millions of m3 of discarded wood and wastepaper in municipal solid waste and incorporate synthetics, again sparing forest (English 1994; Skog et al. 1995).
Paper
Paper mills use pulpwood harvested from the forest, wood residues, and wastepaper. Moreover, the use of abundant hardwoods to make pulp rose, from about a quarter of all pulp in 1976 to a third in 1990 (USDA Forest Service 1982; Haynes et al. 1995). Within the forest products industry, paper and paperboard mills receive far the largest share of recycled products and residual wood (as shown in figure 3). Despite a 64% increase in U.S. paper and paperboard production between 1970 to 1993, the amount of wood from forests entering paper mills rose only about 16%, while residue input rose over 70% and recovery of wastepaper for recycling rose 150% (American Forest & Paper Association 1995; U.S. Bureau of the Census 1996). Together, consumers and millers raised residual and waste inputs each about 30 106m3. In 1970, 185 106m3 inputs made 102 106m3 paper and board, while in 1993, 268 became 167. Had the efficiency of the papermakers not increased from 55% to 62% and had other things not changed, millers would have required another 34 106m3 of material input to meet the market.
Fuel
Wood burns. The forest products industry takes advantage of it. Including the mass of fuelwood, burned residues, and pulping liquors, 47% of the U.S. timber harvest in 1993 became useful energy.
In addition to the 48 106m3 of residues and 100 of paper mill waste, 88 were harvested from forests for fuel in 1993 (figure 3). After rising fourfold since 1970 to about 15% of the total harvest during the Oil Shock, the percentage of timber harvested for fuel has remained relatively stable since the beginning of the 1980s (Grantham and Howard 1980; Powell et al. 1993). Currently, about three-quarters of the wood harvested for fuel comes from trees considered unsuitable for other products (USDA 1993). Although the removal of any trees can adversely affect the ecosystem services that forests provide, judiciously harvesting trees for fuelwood can have salutary effects on the forests by yielding space, sunlight, and nutrients to more desired species. In addition to these considerations, from the perspective of environmental preference, burning harvested wood, as opposed to residues, for energy must be compared with the use of a cleaner burning fuel, such as natural gas.
Because wood used for fuel has no dimensional requirements, modern mills can approach 100% use of wood by collecting and burning residues. Using fuelwood from the forest and wood residues from manufacturing, U.S. lumber and plywood mills generated over 72% of their energy internally by 1991 (Energy Information Administration 1994). Paper mills use wood bark and process liquors for fuel. By the early 1990s paper mills captured essentially all their waste as fuel and generated more than half their energy from these by-products (Energy Information Administration 1994).
So what?
Like any industry converting raw materials into products, timber mills have maximized the value from raw materials and found profitable uses for material otherwise wasted. They stanched large flows of emissions and effluents. “Lost” material was found and used. Whereas about 64 106m3, or 14% of material, was unaccounted in 1970, and much of this may have gone down river, in 1993 this amount shrank to 9 106 m3, or 1.5%. Our estimates fit with an independent estimate that by 1980 over 96% of the wood harvested for roundwood products became products or fuel (U.S. Congress Office of Technology Assessment 1984).
The increased efficiency of materials processing showed itself in more product from comparable inputs and in new products. A larger fraction of reused materials went to composites and paper and less to fuel, even as self-reliance for energy rose. From about 45% in 1970, about 50% of the materials the millers handled in 1993 became the more valued solid and paper products. Had the practices and product mix of 1970 continued to 1993, American mills would have needed about 120 106m3 of additional roundwood for solid and paper products, that is, almost a quarter of the actual 1993 removals, or more than all 1993 removals from Alaska, California, Oregon, and Washington combined.
So millers are close to selling everything but the squeal. No doubt millers can add more synthetics to their products. They can produce more valuable products from the material reaching mills. Nevertheless despite Haynes’s (1997) hopes, millers success at reducing residues to near zero limits the future savings of sheer forest material. Seeing this limitation on the millers’ opportunity or leverage, we now look at the source of new logs they receive: the forest.
Foresters
Introduction
Up the stream from the pull of consumers using more or less forest products on through mills that squeeze more of the products from wood they receive, we at last reach foresters. Their parameter in the flow is the hectares of forest affected per m3 of wood, and their task is harvesting, say, 500 106m3 wood per year for the mills on a minimum of America’s 200 106 hectares of timberland, minimizing the disturbance, improving the forest health, and leaving more forest for nature. Because a yield of wood per hectare can be grasped more easily than its reciprocal of hectares per unit yield of wood, we examine maximizing yield rather than minimizing its reciprocal.
A forester can maximize yield by harvesting more of each tree, cutting more of the trees on a hectare, and increasing the annual growth of trees.
Harvesting More or Less of the Tree
The percentage of dry matter by weight in the trunks of trees generally sets the upper limit on the fraction of each tree harvested for timber products. In 11 forests across the United States, stems comprised about two-thirds of the dry matter above the stump (Mann et al. 1988). In a survey from Russia to New Zealand, the percentage ranged from 91% in birch to 60% in oak (Elliott 1984). Generally, merchantable wood comprises 60%, other wood in branches and so forth 36%, and foliage 4% of a tree above ground (Birdsey et al. 1993).
An idealized stem fraction of two-thirds neglects the diverse suitability of the trees on a hectare for making, say, clear, wide boards. Because of this actual diversity, a forester can increase the harvested fraction by improving the quality of the stems. Or the miller can allow a higher harvest by lowering the standard of quality. Thus the harvested fraction for pulp or composite building material and especially for fuel can be higher than for clear, wide boards. Even dead wood can become fuel.
National statistics on the removal of growing stock show a small rise of fraction harvested (Haynes et al. 1995). Growing stock refers to trees of commercial species and quality larger than 13 cm diameter breast high. Calculated as harvest divided by harvest plus logging residues, the fraction of softwood harvested rose little, from 91% to 93% between 1952 and 1991. For hardwoods the same fraction rose more substantially, from a low 82% in 1952 to 93% by 1991. The obvious limit of 100% keeps the possible leverage from such improvements small.
If foresters remove trees that are not up to the standards of growing stock, they improve the harvested fraction for the hectare even though they inevitably leave behind more logging residues from these inferior trees and deliver more of them for fuel.
Logically, because removing vegetation also removes plant nutrients and because other parts of the tree are richer in nutrients than stems, harvesting more than the stem could harm the site. In 11 forests, harvesting whole trees for fuel rather than just logs did increase the removal of nutrients disproportionately; the removal of nutrients increased roughly one-quarter more than the harvest of dry matter (Mann et al. 1988). Added to the high and steady fraction of removed growing stock already flowing to millers, the disproportional removal of nutrients hints that foresters have little opportunity for raising the harvested fraction.
Harvesting More or Fewer Trees per Hectare
As well as harvesting a higher fraction of each tree, a forester can also harvest a higher fraction of the trees on a hectare. In the extreme, loggers can clear-cut a site, either natural stands with sufficient volume to justify clear-cutting or plantations planted to be harvested at a rotation period. In the 1980s clear-cutting accounted for almost two-fifths of the 4 106 hectares affected by harvest nationally. Selective cutting accounted for the other three -fifths of the area affected by timber harvest (estimates by W. Brad Smith, USDA Forest Service 1997). Selective harvests can leave more or less tree volume on a site, with the prospects for healthy regeneration strongly influenced by the foresters choice of which trees to cut.
Because 1991 roundwood removals were about 500 106m3, loggers obtained an average of roughly 125 m3 of timber for roundwood products for every hectare of timberland harvested. Clear versus partial cuts, which now stand at a ratio of 40 to 60, vary the removals per hectare. The national average for standing timber volume on all timberland was 122 m3 per hectare, ranging from an average of 226 m3 per hectare in the Pacific Coast region to a low of under 100 in the South (Smith et al. 1994). The clear versus partial-cut choice and the actual diversity of timber stands across and within regions emphasizes that the 125 average harvest per hectare is only a useful abstraction.
Concentrating the wood harvest on fewer hectares by harvesting more trees per hectare shrinks the area disturbed for timber harvest nationally. If plantations are part of the scheme for concentrating, one can fear that the advantage of a smaller area disturbed may be countered because their homogeneity makes plantations susceptible to disastrous attacks of pests. The attack by fungi and insects in Connecticut plantations of red pine brought from Europe can be cited as an example. But the epidemics that removed chestnut, elm, and hemlock from the heterogeneous forests in the same state show that heterogeneity is no guarantee against disaster. Some might also fear that plantations would exclude an attractive understory. Experience in northeastern Minnesota, however, proved that the feared outcome would not be universal; in 53 conifer plantations that had evolved for 30 years, the overstory produced the intended timber while the understory resembled that beneath naturally regenerated forests and mature conifer forests (Ohmann 1984). While a timber company looking ahead to furnish its mills with wood may replant clear-cut stands regularly, other landowners may cash in by clearing a stand and forgo replanting for promised benefits on the distant horizon.
If foresters cut only a portion of the trees on a hectare instead of harvesting uniform plantations of trees as crops, they must affect a broader area and use more roads. Whether foresters harvest plantations or natural forests, the need for diverse ages of the perennial crop within a practical distance of a fixed, expensive mill means foresters must organize, plant, and protect for decades. So, practicality will rule whether to harvest more or fewer trees on a hectare.
Parenthetically, we recur to our remark that removing trees that are not up to the standards of growing stock—as when an oil shock makes cull trees valuable for fuel—removes more trees per hectare. Similarly, finding new uses like Oriented Strand Board for formerly unused aspen or chips from small trees also allows profitable removal of more trees per hectare, sometimes to the advantage of the remaining, more valuable trees.
Using a 125 m3 per hectare average, foresters cut trees on 4 106 hectares of American timberland to fill the American order for 500 106m3. If we were dealing with a resource that did not renew itself, the examination might end here, with a simple estimate that 125 m3 of timber delivered to a mill requires a hectare of forest to be disturbed, some clear-cut and some partially cut, and the 198 106 hectares of American forest would be gone, or at least partially cut, in 50 years.
Instead, forests renew themselves, especially managed ones. With proper attention, new trees will grow on clear-cut tracts and tree volume will fill in the spaces opened on partially cut land. The volume of cubic meters standing on timberland results from the annual growth per hectare integrated over time, sometimes a few decades, sometimes centuries for wide boards.
Growing trees faster
With the fraction of each tree and the fraction of the trees harvested per acre already high, increasing the annual growth of cubic meters per hectare remains for decreasing the land harvested to match the annual 500 106m3 the U.S. takes. At the present annual average growth of 3 m3 per hectare on American timberland, the 500 taken matches the growth on most of the 200 106 hectares.
Can foresters speed the growth of volume per hectare and allow more frequent harvest on fewer hectares? Although growth has not speeded up recently, from 1952 to 1987 softwoods annually grew 1.7% faster and hardwoods 1.4% faster; growth per area on forests owned by industry exceeds by half that on national forests and land owned by other private owners (Haynes 1990; Powell et al. 1993). Most forests grow more slowly than their potential average annual increment at culmination in fully stocked natural stands. A straightforward method for lessening disturbance would therefore be using standard management to approach the so-called potential yield on the most productive sites, leaving the rest undisturbed. A standard table (Smith et al. 1994) places the hectares of American timberland in productivity classes of 0–1.4, 1.4–3.5, . . . and over 8.4 potential m3 growth per hectare. Using this table we find that foresters could grow the annual 500 106m3 on the sites with potentials over 5.9 m3 per hectare per year. Foresters would of course have to have the will and money to manage the potential yields. Nevertheless, foresters have estimated that the sites have the requisite potential, and because these sites comprise only 23% of the timberland, growing the required 500 on them alone would leave 77% for other uses or nature.
The next step is to ask whether novel methods could shrink even more the area needed to grow the wood in demand. Drainage, simply throwing up ridges to plant trees in wet soils, increases growth. Allen and coworkers reported treatment of Southern pines at planting time increased their height after 25 years about a tenth for bedding and weed control, a third for water control, and a full half for phosphate fertilization (Allen et al. 1990).
To satisfy the need for wood to be used for pulp or fuel (i.e., wood products without dimensional requirements) or to maximize the amount of atmospheric carbon absorbed, foresters can exploit several fast-growing species. Grier and coworkers tabulated many examples of net primary productivity, largely of above ground biomass, and found growth as fast in deciduous trees as 26 tons per hectare per year in red alder and 24 in yellow poplar (Grier et al. 1989). In evergreens they found rates as fast as 38 in Western hemlock. Five-year-old poplar yielded 42 tons per hectare of biomass, including 32 of wood and barky wood (Isebrands et al. 1979). From experiments, Rowell and coworkers projected intensive management would yield biomass from 11 tons per hectare per year for loblolly pine to 27 for eucalyptus (Rowell et al. 1982). These rates far exceed the average 3 m3 (or 1.5 tons) per year on American timberland. Judging by these examples, foresters have ample scope for raising yields per area and so shrinking the forest disturbed to harvest the wood that consumers and mills demand.
Short of intensive management, great opportunity lies open for extensive, commonsense forestry to raise the 3 m3 per hectare average. “It is hard to assign high priority to [intensive tree farming] when there are millions of acres of underutilized forest land that await even rudimentary management. . . . In this context the term “underutilized” refers to the practice of minimum management of privately owned forest for many millions of acres. (This is not to imply that minimum management is not rational given current economic conditions.) Some significant fraction of this area is never harvested, and mature trees, both merchantable and cull, topple and decay. For a larger fraction of the acreage, merchantable stemwood is periodically harvested but not replanted, the woody residues and dead stemwood are not removed, and growing cull trees are left to expand their area of coverage” (Burwell 1978, 1046). With encouraging economic conditions, Burwell implies, even rudimentary management could grow much more wood.
So What?
The foresters’ parameter in the flow of forest products is hectares of forest and thus nature affected per cubic meter of wood. Among the three levers of harvesting more of each tree, cutting more trees on each hectare, and increasing the annual growth of trees, opportunity lies mostly in growing more wood per hectare.
Challenge and Leverage
Challenge
From jobs for lumberjacks and houses for suburbanites to the worship of nature and preservation of species, a multitude of forces affect the forest. Among these economic and emotional forces, industrial ecology searches for leverage in the flow of forest products reaching consumption through processing and along the stream to the forest. By “leverage” we mean the practical change that can impart the greatest environmental benefit to that exemplar of nature: the forest. The extent of forests in the United States has scarcely changed in the twentieth century, and the average American in 1993 consumed only half the timber as a counterpart in 1900. These facts testify that the stream can be affected and the forest conserved.
During the twentieth century consumers, millers, and foresters decoupled the growth of population and wealth from logging in the United States. Ahead, multiplying population and desired growth of wealth challenge the same actors to keep matching those forces with declines in the other components influencing the forest product flow.
The ratios of 1995 to 1985 U.S. population and GDP correspond to annual increases of 1.0% population, 2.3% GDP, and 1.3% GDP per person. From 1996 to 2050 the middle series of the U.S. Census projects population will multiply 0.7% per year (U.S. Bureau of the Census 1996). Another projection shows U.S. population rising to 400 106 in the year 2100, or 0.3% per year (Marchetti et al. 1996). Historically, the annual rise of GDP per person in the United States has averaged 1.7% since 1900. So the combined, average, long-term challenge of population and GDP per person can reasonably be projected to be about 2.0% per year. Where can industrial ecology find the leverage among the behavior and IOU of consumers, the efficiency of millers, and the green thumb of foresters to counter the 2.0% rise?
Consumers’ Leverage
Recycling is often what comes to mind when people think of consumers conserving forests. In 1993 paper accounted for 38% of U.S. municipal solid waste, occupying a stable fraction since 1960 while more than doubling in absolute terms. During this period, wastepaper recovery doubled to 34% and provides about 20% of material input to paper and paperboard. Raising to half the wastepaper share of pulp going to paper mills would require almost 80% recycling of paper and board and displace 15% of the present demand for U.S. wood. A similar calculation for Western Europe cuts timber harvest there about one-quarter (Virtanen and Nilsson 1992). Although accepting wastepaper benefits materials conservation, using wastepaper for fiber generally increases both external energy reliance at mills and some atmospheric emissions, as wastepaper provides pulp, but yields no combustible material for use as fuel. Ince (1994) emphasized that lower prices caused by the reduced demand for pulpwood attending recycling could increase other uses of timber products, tempering the sparing of trees by recycling. Still, aggressive recycling might stabilize roundwood removals for a decade, assuming fungible inputs for lumber and paper.
What about changing IOU? Before extrapolating the recent changes of IOU we have found for consumers, we consider the mechanisms of change. In its projection of the consumption of timber products, the U.S. Forest Service (Haynes et al. 1995, table 24) considered the number and size of housing starts, other types of construction, manufacturing and shipping, and competition by substitutes for wood. For pulp, their projection of demand incorporated the effects of the competition of plastics and electronic communication, and especially, recycling. The U.S. Forest Service projected that absolute national consumption of all timber products would increase from 2000 to 2040 at an average near 0.6% per year, somewhat faster in pulp, about the same in fuel, and slower in lumber.
Combined with our challenge of 2.0% by population plus wealth, the U.S. Forest Service projections of 0.6% growth of consumption implicitly corresponds to a decline of 1.4% per year in IOU, the consumption per dollar of GDP. In fact, for solid products for the most recent decade analyzed, IOU did fall 1.4%. But for fuel the fall was 1.8% and for pulp 2.3%. For all roundwood products the average annual change in the 1984–93 decade was 1.8%. Gloomy reports of publicly traded paper and lumbering corporations in 1997 make the continuing decline in IOU believable and perhaps even optimistic for the corporations. We should remember that for the period 1900–-1993 the decline in IOU for all roundwood products was 2.5% per year. Also, the projections by the international consultants Jaako Pöyry correspond to a 2.5% decline in global IOU to the year 2010 (Jacques 1996). Should the tumble of 2.5% continue, consumers’ changing style, ethics, and technology can turn the 2.0% rise of population and wealth into a 0.5% fall, helping regrow America’s forests.
Conservatively for nature, however, we ask whether millers and foresters can also help moderate the effect of national consumption.
Millers’ Leverage
Millers’ rising efficiency now annually spares about 120 106 of roundwood compared to three decades ago, but their nearly complete use of the wood that reaches them limits their opportunity to do better. Because this efficiency rests heavily on the use of residues for fuel, they may curtail their need for wood by using more residues for composites and paper and finding other fuel. The use of nonforest products such as mineral fillers and polymers continues to offer the millers a way to stretch product output without more forest harvest. Aside from millers making more valuable products from what might have been fuel and stretching output with fillers and polymers, however, the leverage for sparing forests must be sought elsewhere.
Foresters’ Leverage
In contrast, foresters have means to affect forest extent dramatically. Harvesting a bigger fraction of trees and even cutting more of the trees per hectare seems an unlikely and unattractive means. Growth is the lever. Given the neglect of American timberland and thus the slow present average growth of 3 m3 per hectare and given the plantations already started and the opportunity to plant still more, the chance to produce more wood while sparing more forest is excellent. A 1% per year rise in growth that would double average yields in 70 years is plausible.
Conclusion
During the nineteenth century, burgeoning population and wealth, the industrial revolution, and expanding agriculture did shrink the expanse of U.S. forests about 30%. Although population and wealth have continued to multiply, the conservation movement and technological developments beginning early in the twentieth century combined to arrest the clearing of forests, ushering in a century of forest rebirth. Many areas initially cleared have since regenerated, as evidenced by today’s extensive wooded areas in New England and the upper Great Lakes states.
While the future extent of U.S. forests will be affected by the covering of land for cities plus the race to lift yields to match growing demand for food, which we have examined elsewhere (Waggoner et al. 1996), logging for timber will surely disturb forests, too. Using the history of the twentieth century, we have examined the leverage of consumers, millers, and foresters for lessening the extent of that disturbance and continuing the rebirth of the forest despite more and wealthier people. This style of analysis could shed light on the prospects for forests in many countries.
The American history hints that the efficient industrial ecology of mills for timber products has approached a ceiling. On the other hand, no limits seem near for declining IOU for timber products. And great opportunities seem open for forestry to raise yields and so decouple need for land from demand for timber (figure 10).
The plausible anticipation of a falling IOU for forest products to more than eliminate the effects of growing population and affluence would lead to an average annual decline of 0.5% in the amount of timber harvested for products. Added to that, a 1.0% annual improvement in forest growth would compound the benefits of steady or falling demand by shrinking the area affected by logging by 1.5% annually. Compounded, the 1.5% would shrink the extent of logging by half in fifty years. The environmental benefits of such sustained diligence include preserving a national treasure, sparing land for undisturbed nature to provide services to humanity and its fellow creatures, and sequestering carbon from the rich supply of CO2 in the atmosphere.
Note
We would like to thank David R. Darr, Peter J. Ince, and W. Brad Smith, USDA Forest Service; Roger A. Sedjo, Resources for the Future; Jeffrey S. Ward, Connecticut Agricultural Experiment Station; David M. Smith and Herbert I. Winer, Yale School of Forestry and Environmental Studies; Sten Nilsson, International Institute for Applied Systems Analysis; and Lance Roberts, American Forest and Paper Association.
References
Allen, H. L., P. M. Dougherty, and R. G. Campbell. 1990. Manipulation of water and nutrients—Practice and opportunity in Southern U.S. pine forests. Forest Ecology and Management 30: 437–453.
American Forest and Paper Association. 1995. 1995 Statistics: Paper, paperboard, and woodpulp. Washington, DC: American Forest and Paper Association.
Armstrong A. D., K. M. Bentley, S. F. Galeano, R. J. Olszewski, G. A. Smith, and J. R. Smith. 1994. The pulp and paper industry and industrial ecology. Paper presented at the International Conference on Industrial Ecology, Irvine, California, 9-13 May, 1994. National Academy of Engineering.
Barsotti, Aldo F. 1994. Industrial minerals and sustainable development. U.S. Bureau of Mines, Division of Minerals Commodities, Branch of Industrial Minerals report. Washington, DC.
Birdsey, Richard A., A. J. Plantinga, and L. S. Heath. 1993. Past and perspective carbon storage in United States forests. Forest Ecology and Management. 58: 33–40.
Burwell, C. C. 1978. Solar biomass energy: An overview of U.S. potential. Science 1991041–1048.
Clawson, M. 1979. Forest in the long sweep of American history. Science 204:1168–1174.
Clawson, M. 1985. Outdoor recreation: Twenty-five years of history, twenty-five years of projection. Leisure Sciences. 7(1): 73–99.
Colberg, R. E. 1996. Emerging trends in southern timber supply and demand relationships. Paper presented at the International Wood Fiber Conference, Atlanta, Georgia. Available from Decisions Support, Columbus, Georgia: May 1996.
Dietz, T. and E. A. Rosa. 1994. Rethinking the environmental impacts of population, affluence, and technology. Human Ecology Review Summer/Autumn 1, 277–300.
Elliott, G. K. 1984. “Forests.” Encyclopedia Britannica, 15th ed. 7: 542.
Energy Information Administration. 1994. Manufacturing consumption of energy. U.S. Department of Energy Report DOE/EIA-0512(91). Washington, DC: U.S. Government Printing Office (U.S. GPO).
English, B. 1994. Wastes into wood: Composites are a promising new resource. Environmental Health Perspectives 102(2): 168–170.
Environmental Defense Fund Paper Task Force. 1995. Economic considerations in forest management. White paper no. 11. Washington, DC: Environmental Defense Fund.
Fedkiw, J. 1989. The evolving use and management of the nation’s forests, grasslands, croplands, and related resources. U.S. Department of Agriculture (USDA). Forest Service Report GTR-RM-175. Washington, DC.
Grantham, J. B. and J. O. Howard. 1980. Logging residue as an energy source. In Progress in biomass conversion, edited by K. V. Sarken and D. A. Tillman. New York: Academic Press.
Grier, C. C., K. M. Lee, N. M. Nadakarni, G. O. Klock, and P. J. Edgerton. 1989. Productivity of forests of the United States and its relation to soil and site factors and management practices: A review. USDA Forest Service Report PNW-GTR-222.
Haynes, W. 1990. An analysis of the timber situation in the United States: 1989–2040. USDA Forest Service General Technical Report RM-GTR-199.
Haynes, R. W., D. M. Adams, and J. R. Mills. 1995. The 1993 RPA timber assessment update. USDA Forest Service Report RM-GTR-259.
Hyde, W. F. 1997. Policies today and for the future. In National Research Council: Wood in our future, p. 95. Washington, DC: National Academy Press.
Ince, P. J. 1994. Recycling of wood and paper products in the United States. A report for the UN Economic Commission for Europe Timber Committee Team of Specialists on New Products, Recycling, Markets, and Applications for Forest Products. Madison, WI: USDA Forest Products Laboratory.
Ince, P. J. 1995. What won’t get harvested where and when: The effects of increased paper recycling on timber harvest. Working paper no. 3, School of Forestry and Environmental Studies, Yale University.
INFORM. 1995. Toxics watch 1995. New York.
Isebrands, J. G., J. A. Sturos, and J. B. Crist. 1979. Alternatives for integrated utilization of short-rotation intensively cultured Populus raw material. Journal of the Technical Association of the Pulp and Paper Industry 62(7): 67–70.
Jacques, R. 1996. Global demand for forest products to the year 2010. Natural Resources Canada. Economic Studies Research Note 47e.
MacCleery, D. W. 1992. American forests: A history of resiliency and recovery. USDA Forest Service Report FS-540.
Malenbaum, W. 1978. World demand for raw materials in 1985 and 2000. New York: McGraw-Hill.
Maloney, T. M. 1996. The family of wood composite materials. Forest Products Journal 46(2): 19–26.
Mann, L. K., D. W. Johnson, D. C. West, D. W. Cole, J. W. Hornbeck, C. W. Martin, H. Ricker, C. T. Smith, N. T. Swank, L. M. TriHun, and D. H. Van Lear 1988. Effects of whole-tree and stem-only clearcutting on postharvest hydrologic losses, nutrient capital, and regrowth. Forest Science 34: 412–428.
Marchetti, C., P. S. Meyer, and J. H. Ausubel. 1996. Human population dynamics revisited with the logistic model: How much can be modeled and predicted? Technological Forecasting and Social Change 52: 1–30.
Moulton, R. J., F. Lockhart, and J. D. Snellgrove. 1996. Tree planting in the United States 1995. USDA Forest Service report. Cooperative Forestry Staff. Washington, DC.
Ohmann, L. F. 1984. Biomass in conifer plantations of northeastern Minnesota. USDA Forest Service Research Paper NC-247.
Powell, D. S., J. L. Faulkner, D. R. Darr, Z. Zhu, and D. W. MacCleery. 1993. Forest resources of the United States, 1992. USD. Forest Service Report RM-GTR-234.
Rowell, R. M., G. J. Hajny, and R. A. Young. 1982. Energy and chemicals from wood. In Introduction to forest science, edited by R. A. Young. New York: Wiley.
Sedjo, R. A. 1995. Forests: Conflicting signals. In The True State of the Planet, edited by R. Bailey. New York: Free Press.
Skog, K. E., P. J. Ince, D. J. S. Dietzman, and C. D. Ingram. 1995. Wood products technology trends. Journal of Forestry 93(12): 30–33.
Smith, W. B., J. L. Faulkner, and D. S. Powell. 1994. Forest statistics of the United States, 1992. USDA Forest Service Report GTR-NC-168.
U.S. Bureau of the Census. 1975. Historical statistics of the United States, colonial times to 1970. Washington, DC: U.S. GPO.
U.S. Bureau of the Census. 1996. Statistical abstract of the United States, 116th ed. Washington, D.C.: U.S. GPO.
U.S. Congress Office of Technology Assessment. 1984. Wood use—U.S. competitiveness and technology, volume 2: Technical Report. Office of Technology Assessment Report OTA-M-224. Washington, DC.
USDA (U.S. Department of Agriculture). 1993. Agricultural Statistics 1993. Washington, DC: U.S GPO.
USDA Forest Service. 1958. Timber resources for America’s future. USDA Forest Service Forest Resource Report 14.
USDA Forest Service. 1965. Timber trends in the United States. USDA Forest Service Forest Resource Report 17.
USDA Forest Service. 1973. The outlook for timber in the United States. USDA Forest Service Forest Resource Report 20.
USDA Forest Service. 1982 Analyses of the timber situation in the U.S., 1952–2030, USDA Forest Service Forest Resource Report 23, pp. 264–272 and table 3.68.
U.S. EPA (U.S. Environmental Protection Agency). 1994. Characterization of municipal solid waste in the United States: 1994 update, final report. EPA report no. 530-R-94-042.
Virtanen, Y. and S. Nilsson. 1992. Some environmental policy implications of recycling paper products in Western Europe. Executive Report 22. Laxenburg, Austria: International Institute for Applied Systems Analysis.
Waddell, K. S., D. D. Oswald, and D. S. Powell. 1989. Forest statistics of the United States, 1987. USDA Forest Service Report PNW-RB-168.
Waggoner, Paul E., J. H. Ausubel, and I. K. Wernick. 1996. Lightening the tread of population on the land: American examples. Population Development and Review 22(3): 531–545.
Wernick, I. K. and J. H. Ausubel. 1997 Industrial Ecology: Some Directions for Research. Office of Energy and Environmental Systems, Lawrence Livermore National Laboratory. On-line: https://phe.rockefeller.edu.
Wernick, I. K. and J. H. Ausubel. 1995. National materials flows and the environment. Annual Review of Energy and Environment 20: 462–492.
Wernick, I. K., R. Herman, S. Govind, and J. H. Ausubel. 1996. Materialization and dematerialization: Measures and trends. Daedalus 125(3): 171–198.
Wexler, L. 1996. Decomposing models of demographic impact on the environment. WP-96-085. Laxenburg, Austria: International Institute for Applied Systems Analysis.
Figures
Figure 1 U.S. Forest land area 1630–1991. Sources: Sedjo (1995); Powell et al. (1993).
Figure 2 U.S. Forest volume, hardwoods and softwoods, 1952–1991. Source: Smith et al. (1994).
Figure 3 Material flows in the U.S. forest products industry, 1993. Box heights are to scale. All values in 106m3. For paper we consider 1 metric ton to be equivalent to 2 m3.
Note: a Based on the ratio of logging residues (15.1%) and “Other Removals” (6.6%) to all removals for 1991.
b The dashed line entering paper represents the inputs from “recycled.” We estimate that 100 106m3 of the woody mass entering paper mills undergoes combustion for energy. In 1991 the paper industry (SIC 26) generated over 1.2 quadrillion British thermal units (Btu) from pulping liquors, chips, and bark.
c Construction includes millwork such as cabinetry and moldings. “Other” includes industrial uses such as materials handling, furniture, and transport.
d The ratio of end uses relies on Btu data from the U.S. Department of Energy, Energy Information Administration. The category “Residential and Commercial” includes Electric Utilities. Sources: Ince (1994); Energy Information Administration (1994); USDA (1993); U.S. Bureau of the Census (1996); Amer. Forest and Paper Association (1995); Smith et al. (1994); and data from the Engineered Wood Products Association in Tacoma, Washington, and the Western Wood Products Association in Portland, Oregon.
Figure 4 U.S. consumption of industrial roundwood for lumber, plywood and veneer, pulp products, and fuel, 1900–-1993. Because these four categories omit other industrial products, exported logs, pulpwood chip exports, and recycled materials, their sum is smaller than the total consumption shown on the right in Figure 3. Rather, these correspond to the inputs of roundwood to millers in the middle column of Figure 3. Sources: U.S. Bureau of the Census (1975, 1996); USDA (various years).
Figure 5 Relative annual changes in the three components of solid-material consumption: population, GDP per person, and the intensity of use (IOU) for solid wood (upper panel). The change of the components are shown by segments of bars for five exemplary, ten-year periods. The solid bars in the lower panel show the change in the national consumption produced by the sum of the three components. For example, in the Begin period of 1900–1909, the annual rises of 1.9% in population and 2.1% in GDP per person combined with a fall of 1.7% in solid material per GDP for a 2.3% rise in national use of solid material. Sources: U.S. Bureau of the Census (1975, 1996).
Figure 6 Relative changes in the three components of pulp consumption (upper panel). The change of the components are shown by segments of bars for five exemplary, ten-year periods. The solid bars in the lower panel show the change in the national consumption produced by the sum of the three components. Sources: U.S. Bureau of the Census (1975, 1996).
Figure 7 Relative changes in the three components of fuelwood consumption (upper panel). The change of the components are shown by segments of bars for five exemplary, ten-year periods. The solid bars in the lower panel show the change in the national consumption produced by the sum of the three components. Sources: U.S. Bureau of the Census (1975, 1996).
Figure 8 The changing intensity of use of solid, pulp, and fuelwood in the United States, 1900–1993. The changes calculated for ten-year periods appear above the fifth year of the ten. For example, during the Depression period of 1925–1934, the use per GDP of solid wood fell 9%, pulp rose 3%; and fuel rose 9% annually. Sources: U.S. Bureau of the Census (1975, 1996).
Figure 9 Volume of unused residues at primary manufacturing plants: United States, 1952–1991. Sources: USDA Forest Service (1958, 1965, 1973, 1982); Waddell et al. (1989); Smith et al. (1994).
Figure 10 Leverage for further raising environmental quality in the U.S. forest products sector.
Foresters and DNA
The Forester’s Lever: Industrial Ecology and Wood Products
Consumers
The past century. In the United States, absolute timber consumption for products and fuel grew 70 percent between 1900 and 1993 (US Bureau of the Census 1975, 1996). Including the use of residues, consumption of wood for pulp exceeded that for lumber, which stayed nearly level. Fuelwood consumption nearly disappeared only to reemerge during the Depression and the oil shocks of the 1970s. Plywood and veneer consumption began to account for a little under 10 percent of the processed harvest in the early 1990s.
The annual percentage change of the national consumption of each of these products is approximately the sum of the small percentage changes in the first three components of equation 1. In the equation, consumers’ leverage the flow of forest products with their numbers (population), wealth (GDP per capita), and the amount of product consumed per dollar of GDP. Industrial ecologists call the amount of product consumed per dollar of GDP “intensity of use” (IOU). The difference between changes in population plus wealth on the one hand, and the national consumption on the other is the IOU. This factor gauges how large a part forest products played in national economic activity as represented by the GDP.
From 1900 to 1993, American population tripled, rising an average 1.3 percent per year. The annual growth of the GDP per person fluctuated, from -4 percent entering the Depression to more than +8 percent in the following decade; the annual average for the century was 1.7 percent. Combined, growing population and personal wealth raised GDP 16 times, an average of 3 percent per year. But the 70 percent rise in timber consumption from 1900 to 1993 corresponds to an annual increase of only 0.5 percent. The IOU, which represents the difference, thus fell an average of 2.5 percent per year.
What changes timber IOU? Constant IOU means that consumption rises in tandem with the rise of population and personal wealth. For example, 2 percent more people and 2 percent more GDP per person would raise consumption 2 + 2 + 0, or 4 percent. If paper use grows faster than the economy, however, and the IOU for paper goes up by 2 percent each year, then consumption rises 2 + 2 + 2, or 6 percent. If paper use slows relative to the economy and the IOU falls 2 percent per year, then consumption rises only 2 + 2 – 2, or 2 percent.
With rare exceptions, during the 20th century the IOU for solid wood products fell (fig. 1, p. 10). Steel, concrete, and plastic became substitutes for wood in certain structures, furniture, barrels, and cross ties. New preservatives for wood prevented fire and decay. Such changes helped lower the IOU for solid wood.
Early in the century US paper use grew dramatically, raising the IOU of pulp even during the Depression. Beginning in the late 1930s, the IOU for pulp fell sharply as the wartime economy lifted GDP faster than paper consumption. Following a burst after the war, the IOU for pulp fell and has been falling since. Because we calculated the IOU only from the industrial roundwood that millers used for solid wood products and paper, more efficient utilization by millers deserves some of the credit for lowering the IOU we calculated (see note in figure 1). By the early 1990s, the falling IOU of pulp actually overcame the growing population numbers and affluence to reduce pulpwood consumption.
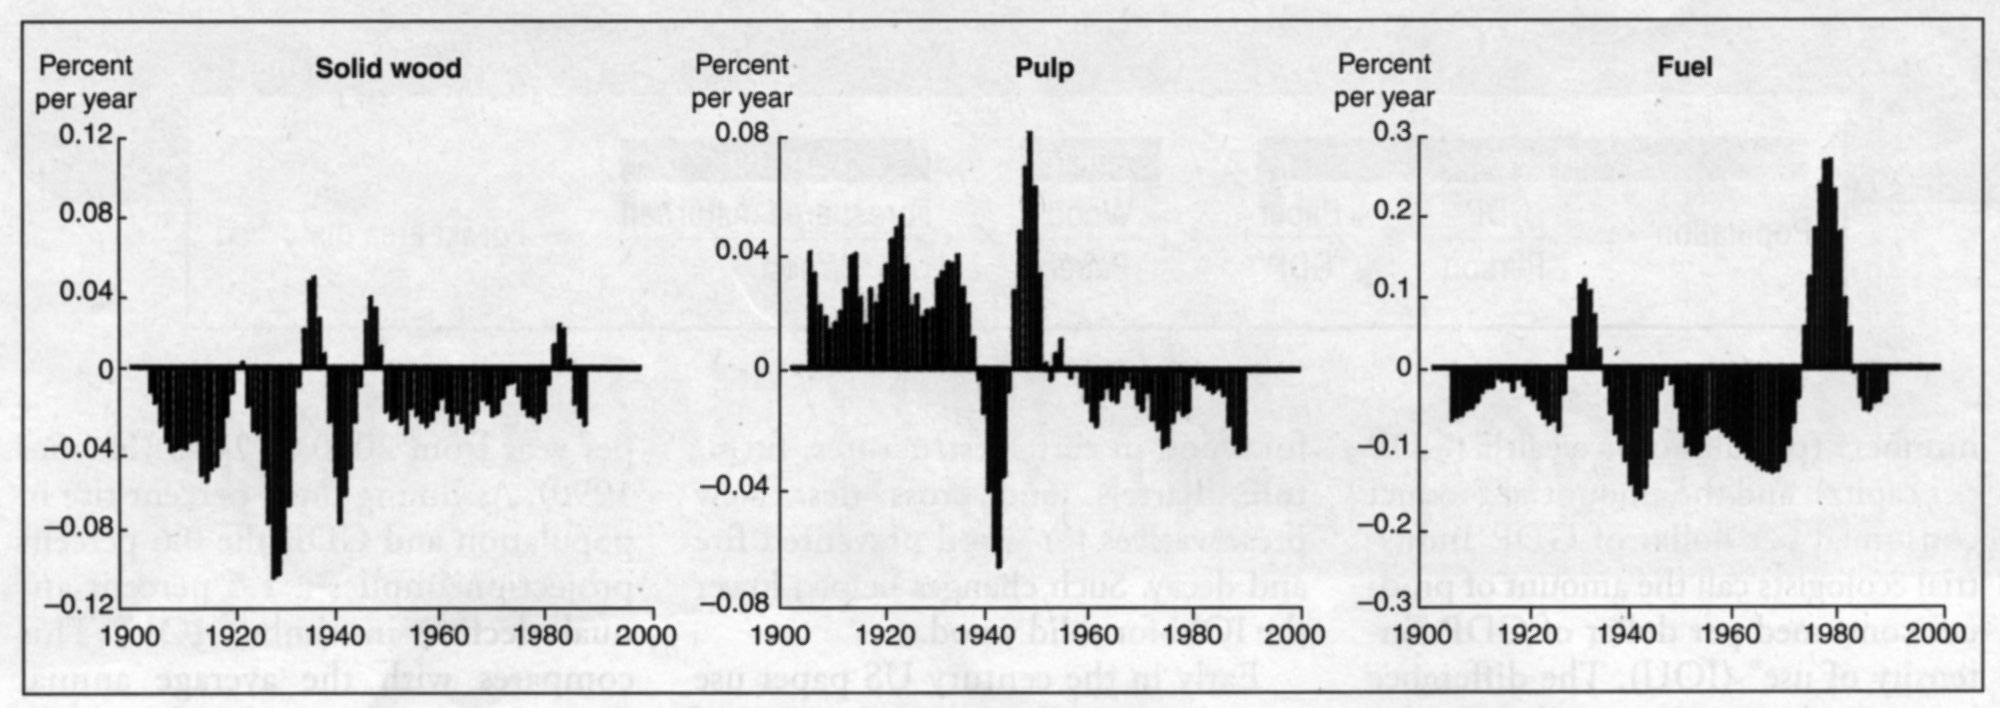
Figure 1. Relative annual percentage changes in intensity of use (IOU) of roundwood used for solid wood, pulp, and fuel. IOU is amount of product divided by GDP. Sources: US Bureau of the Census 1975, 1996; USDA 1993. Note: The data represent the industrial roundwood used for the product itself. Intensity of use goes up with consumer demand but is moderated by increases in efficient utilization; the graph incorporates both effects.
Use of fuelwood fluctuated dramatically over the century. Early in the 1900s, the growing use of coal and oil lowered fuelwood IOU. Then, during the Depression fuelwood IOU soared, only to fall steadily until the mid 1970s, when oil shocks again encouraged the burning of fuelwood.
This next century. Population projections for the next 5 0 to 100 years in the United States range from 0.3 to 0.7 percent per year (US Bureau of the Census 1996). From 1985 to 1995 annual per capita GDP grew an average of 1.3 percent per year-a bit slower than the 1.7 percent average since 1900. The combined growth of population and GDP per person can reasonably be projected to be about 2 percent per year.
After considering trends in industrial production and consumer demand, the USDA Forest Service projects national timber consumption for products to grow about 0.6 percent per year from 2000 to 2040 (Haynes 1990). Assuming the 2 percent rise in population and GDP, the 0.6 percent projection implies a 1.4 percent annual decline in timber IOU. This compares with the average annual drop of 1.8 percent in IOU from 1985 to 1995 and the 20th-century average of -2.5 percent. If consumers continue the long-term 2.5 percent drop in IOU, they could counter the 2 percent rise in population and wealth and reduce timber consumption 0.5 percent annually.
Millers
The past century. In equation 1, millers exert their leverage by changing wood per product in the flow volumes depicted in figure 2 (p. 11). In 1993, 646 million cubic meters of wood and fiber entered the US forest product sector. Trees furnished 78 percent, recycling 10 percent, and imports 12 percent. Other removals (i.e., timber from thinnings or land-clearing operations) and logging residues never entered the commercial flow. Mills consumed 26 percent for solid wood products, 26 percent for paper, and 36 percent for fuel 10 percent was exported. The dotted lines in the center column show the flow of residues in mills, primarily for paper and fuel. To transform logs into lumber efficiently, Millers took advantage of sophisticated new scanning and cutting technologies and sharper, more stable blades (Haynes 1990). They raised the ratio of lumber to roundwood from 33 percent in 1970 to 42 percent in 1993. The volume of unused residue has fallen about 30 million cubic meters since the 1950s. Since 1970, the residues lost in making lumber fell from over 25 percent to 2 percent. Stretching the value of each log and each hectare, Millers also developed composite products like oriented strand board that use irregular wood shapes as well as previously unused tree species.

Figure 2. Flow of forest products, in millions of cubic meters, in the United States in 1993. We use volume instead of mass to eliminate variables like changing moisture content, mineral fillers, and synthetics in products; I cubic meter of wood is considered equivalent to 0.5 metric ton of paper. The dotted rules show the flow of residues in mills. Notes: Timber removals are based on the ratio of logging residues (15.1 percent) and other removals (6.6 percent) to all removals for 1991. Dashed lines represent recycled paper. Construction includes millwork, such as cabinetry and moldings. Other paper and board includes industrial uses, such as materials handling, furniture, and transport. Fuel: The ratio of end uses relies on Btu data from the Energy Information Administration; fuel includes 100 million cubic meters burned by paper mills for energy. Residential and commercial fuel includes electric utilities. Sources: Ince 1994; Energy Information Administration 1994; USDA 1993; US Bureau of the Census 1996; American Forest & Paper Association 1995; Smith et al. 1994; and data from the Engineered Wood Products Association, Tacoma, Washington; and the Western Wood Products Association, Portland, Oregon.
Including fuelwood, residues, and pulping liquors, 47 percent of the US timber harvest in 1993 became useful energy. In fact, US lumber and plywood mills generated over 72 percent of their energy internally-by 1991 (Energy Information Administration 1994). Outright harvest for fuel has remained a relatively steady percentage of harvest since rising to about 15 percent in the early 1970s. Currently, about three-quarters of fuelwood harvest comes from non-growing stock.
In the forest products sector overall, had the log-to-lumber efficiency remained at -1970 levels, meeting 1993 market demand would have required 48 million cubic meters more timber. Without composites displacing lumber, an additional 32 million cubic meters of roundwood input would have been required. Finally, improved efficiency in papermaking spared 34 million cubic meters of material input in satisfying 1993 demand. Their virtual elimination of waste since 1970 leaves millers with the challenge of transforming the near half of wood that is burned into more valuable products.
This next century. On top of raising their efficiency, millers can use substitutes for pulp, such as wastepaper and crops. The recovery and use of wastepaper have increased, and the first facilities are now becoming operational to make newsprint from such crops as kenaf (Kafus Industries 1999). Furthermore, by incorporating organic .and mineral fillers into products, millers can also lower the input of timber. Other substitutions offered by manufacturers and accepted by consumers include polyethylene for paper bags, concrete for rail ties, and steel beams for wooden rafters.
Foresters
The past century. The foresters’ parameter in equation I is the hectares of forest disturbed per cubic meter of wood harvested. A forester can maximize timber yields and minimize area disturbed in three ways: (1) harvesting more of each tree, (2) harvesting more trees on each hectare, and (3) increasing annual tree growth.
1. The roughly two-thirds of the dry matter above the stump in sterns generally sets the limit on how much of each tree is harvested. From 1952 to 1991 logging residues as a percentage of timber removals from growing stock fell from 10 percent to 7.5 percent for softwoods and from 22 percent to 12 percent for hardwoods (Haynes et al. 1995). Because removing vegetation also removes nutrients and because stems are poor in nutrients, harvesting more than stems can deplete a site. Considering the already high harvest index and the nutrient depletion from x raising the index further, foresters have little opportunity to get more wood by harvesting more of each tree.
2. Harvesting more trees on each hectare means less partial cutting, more clearcutting. In the 1980s, partial cutting accounted for three-fifths and clearcutting for two-fifths of the 4 million hectares affected by harvest nationally (W. Brad Smith 1997, pers. commun.). Because 1991 roundwood removals were about 500 million cubic meters, loggers obtained an average of roughly 125 cubic meters of timber for roundwood products for every hectare of timberland harvested. Compared with clearcutting, partial cutting affects appearance less, but harvesting the same volume of timber requires more roads to reach a wider area and counters the objective of disturbing less area.
Concentrating harvest on fewer hectares by cutting more per hectare shrinks the area disturbed nationally. The result is tree plantations, and such concentrations of single species can encourage pests. The attack by fungi and insects in Connecticut plantations of red pine brought from Europe is an example. But the epidemics that removed native chestnut, elm, and hemlock from heterogeneous forests in the same state show that heterogeneity is no guarantee against disaster. The values of homogeneous plantations for wildlife habitat and aesthetic experiences are another concern, but in northeastern Minnesota 53 conifer plantations that were 30 years old, the overstory produced the intended timber, and the understory resembled that beneath naturally regenerated and mature forests (Ohmann 1984).
Plantations allow concentrated harvests. In the South, which contains more than half of the nation’s industrial forestdand, one-eighth of all timberland is now plantations, and that proportion is expected to double by 2030 (Environmental Defense Fund et al. 1995). This expansion of plantations and clearcutting should increase the harvest per hectare and I shrink the area annually disturbed by harvesting. Changing social preferences in recent decades, however, have made the lever of harvesting more trees per hectare more difficult to apply.
3. Increasing the annual tree growth is forestry’s third way to shrink the area disturbed by harvest. At the present average growth rate for growing stock of 3 cubic meters per hectare per year, almost the entire 200 million hectares of American timberland is required to supply the 500 million cubic meters harvested. If foresters achieved annual productivity of 5.9 cubic meters per hectare on appropriately productive sites, they could provide the needed 500 million cubic meters on just 23 percent of US timberland.
Yields can be raised. On industry-owned forests, yields exceed by half those on national forests and private nonindustrial land (Haynes 1990 Powell et al. 1993). Nationally, although the forest industry owns only about one-seventh of timberland, it produces a fifth of national timber growth, a quarter of softwood growth, and about a third of the annual harvest. Here are two other statistics that indicate industry’s disproportionate contribution: Industrial foresters did more than 40 percent of the planting and 70 percent of the stand improvement in 1995 (Moulton et al. 1996).
This next century. Although the forest industry actively manages its own lands, private owners, who control more than half of all American timber land, may lack incentives to do so. Millions of acres await even rudimentary management measures. In the late 1970s, Burwell (1978) argued that millions of acres of forest were underutilized:
In this context the term “underutilized” refers to the practice of minimum management of privately owned forest for many millions of acres. Some significant fraction of this area is never harvested, and mature trees, both merchantable and cull, topple and decay. For a larger fraction of the acreage, merchantable stemwood is periodically harvested but not replanted, the woody residues and dead stemwood arc not removed, and growing cull trees are left to expand their area of coverage.
Burwell’s observation remains apropos today and can also apply to acres released from crops by rising agricultural yields since the 1970s. Given sufficient resources, conventional management of neglected stands offers foresters a great opportunity to raise average yields.
Foresters already possess the means to increase yields. Improving drainage of Southern pines at planting time increased their height after 25 years. About one-tenth of the additional height was due to bedding and weed control, a third to water control, and half to phosphate fertilization (Allen et al. 1990). Foresters can plant species that grow faster than the average annual 3 cubic meters. To illustrate the potential for higher yields, we note that red alder grows biomass as fast as 26 tons per hectare per year, yellow poplar 24, and Western hemlock 38 (Grier et al. 1989). A national consensus would encourage corporations and state and federal agencies to improve average yields with best management methods. The first step toward reaching that consensus is for diverse stakeholders to recognize the unique leverage that higher yields offer to reduce overall forest disturbance.
The forester’s parameter in the flow of forest products is wood per hectare of forest and thus the area disturbed per cubic meter of wood harvested. Among the three levers-harvesting more of each tree, cutting more trees on each hectare, and increasing the annual growth of trees-the best opportunity for reducing the area harvested lies in growing more wood per hectare.
Conclusion
By the end of the 19th century, population growth, increasing wealth, the Industrial Revolution, and expanding agriculture had shrunk the expanse of US forests about 30 percent from the pre-European settlement condition. Although population and wealth continued to multiply, the conservation movement and technological developments beginning early in the 20th century combined to halt the clearing of forests and allowed forest regeneration. Former pastures in New England and the upper Great Lakes states are now mature forests. Expanding exurbs, contracting agriculture, and new logging will all affect future forest clearing (Waggoner et al. 1996). Will consumers, millers, and foresters use their leverage to lessen such disturbances and continue the rebirth of the American forest?
Consumers spare forests by recycling fiber to paper mills, and more importantly, lowering national intensity of use. Millers already use about 120 million fewer cubic meters of roundwood a year than they did three decades ago; further innovations may allow millers to profit more from each unit of timber and spare still more hectares by channeling residues burned as fuel to producing composites and paper. Foresters have the most dramatic opportunity to reduce the hectares harvested-not by harvesting more of a tree or even more trees per hectare, but by increasing the growth rate of trees per hectare. They can narrow the gap between the potential of American timberland and the current low growth rate through improved management of neglected stands and intensive silviculture to raise yields.
American history hints that reducing wood demand as the economy grows, utilizing wood more efficiently, and raising yields can decouple the need for land from timber demand. A plausible 2.5 percent per year drop in intensity of use coupled with an annual I percent rise in yield would shrink the forest area disturbed by logging by 1.5 percent annually. Compounded, that 1.5 percent would reduce the spatial extent of logging by half in 50 years. The benefits of such sustained diligence include preserving a national treasure, sparing land for undisturbed nature, and sequestering carbon from the atmosphere.
Literature Cited
ALLEN, H.L., P.M. DOUGHERTY, and R.G. CAMPBELL. 1990. Manipulation of water and nutrients: Practice and opportunity in southern US pine forests. Forest Ecology and Management 30:437-53.
AMERICAN FOREST & PAPER ASSOCIATION. 1995. 1995 statistics: Paper paperboard, & woodpulp. Washington, DC.
BURWELL, C.C. 1978. Solar biomass energy. An overview of US potential. Science 199:1041-48.
ENERGY INFORMATION ADMINISTRATION, 1994. Manufacturing consumption of energy. US Department of Energy Report DOE/EIA-0512(91). Washington, DC: US Government Printing Office.
ENVIRONMENTAL DEFENSE FUND ET AL. 1995. Economic considerations in forest management. White Paper No. 11. Washington, DC: Environmental Defense Fund.
GRIER, C.C., K.M. LEE, N.M. NADAKARNI, G.O. KLOCK, and P.J. EDGERTON. 1989. Productivity of forests of the United States and its relation to soil and site factors and management practices: A review. USDA Forest Service Report PNW-GTR-222.
HAYNES, R.W. 1990. An analysis of the timber situation in the United States: 1989–2040. USDA Forest Service General Technical Report RM-GTR-199.
HAYNES, R.W, D.M. ADAMS, and J.R. MILLS. 1995. The 1993 RPA timber assessment update. USDA Forest Service Report RM-GTR-259.
HYDE, WE 1997. Policies today and for the future. In Wood in our future. Washington, DC: National Academy Press and National Research Council.
INCE, P.J. 1994. Recycling of wood and paper products in the United States. Madison, WI: USDA Forest Products Laboratory.
KAFUS INDUSTRIES. 1999. Kafus options 147,000 acres in Arizona as proposed site for increased kenaf fibre production. News release. Available online at www. Kafus.com/pr/news.html.
MOULTON, R.J., F. LOCKHART, and J.D. SNELLGROVE. 1996. Tree planting in the United States 1995. Washington, DC: USDA Forest Service.
OHMANN, L.E 1984. Biomass in conifer plantations of northeastern Minnesota, USDA Forest Service Research Paper NC-247.
POWELL, D.S., J.L. FAULKNER, D.R. DARR, Z. ZHU, and D.W. MacCLEERY. 1993. Forest resources of the United States, 1992. USDA Forest Service Report RM-GTR234.
SMITH, W.B., J.L FAULKNER, and D.S. POWELL. 1994. Forest statistics of the United States, 1992. USDA Forest Service Report GTR-NC-168.
US BUREAU OF THE CENSUS. 1975. Historical statistics the United States, colonial times to 1970. Washington, DC: US Government Printing Office.
—–.1996. Statistical abstract of the United States. 116th ed. Washington, DC: US Government Printing Office.
US DEPARTMENT OF AGRICULTURE (USDA). 1993. Agricultural statistics 1993. Washington, DC: US Government Printing Office.
WAGGONER, PE., J.H. AUSUBEL, and I.K. WERNICK. 1996. Lightening the tread of population on the land: American examples. Population Development and Review 22(3):53145.
WERNICK, I.K., RE. WAGGONER, and J.H. AUSUBEL. 1998. Searching for leverage to conserve forests: The industrial ecology of wood products in the US Journal of Industrial Ecology 1(3):125-45.
Iddo K Wernick (e-mail: iw4@columbia.edu) is associate research scientist, Earth Institute, Columbia University New York, NY 10027; Paul E. Waggoner is scientist, Connecticut Agricultural Experiment Station, New Haven; and Jesse H. Ausubel is director, Program for the Human Environment, Rockefeller University, New York. A more detailed analysis, on which this article is based, is available online at https://phe.rockefeller.edu/forests.