DNA barcoding helps conserve biodiversity. In Ten Reasons for Barcoding Life we outlined benefits to biodiversity from barcoding. An earlier post highlighted one reason, namely how barcoding assists conservation by helping uncover cryptic species. I highlight two more with new examples, and discuss a recent worry piece on barcoding from Conservation Science. From Ten Reasons:
1. Identifying a species from bits and pieces. Conserving the many threatened fish species requires the ability to identify commercial and sport fishery harvests. The United States Food and Drug Administration online Regulatory Fish Encyclopedia was developed to help federal, state, and local officials and purchasers of seafood accurately identify species substitution and economic deception in the marketplace. The page for the Caribbean species Red Snapper Lutjanus campechanus includes high-resolution pictures of filets. However, it is not possible to accurately identify fish fillets and substitution appears common. Using mitochondrial DNA (cytochrome c rather than cytochrome oxidase I), Marko et al found that 77% of Red 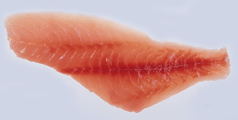 Snapper filets sold in eastern USA consumer markets were mislabelled. More than half of the analysed sequences grouped closely with species from other regions of the world. A reference library of DNA barcodes will help regulatory agencies enforce fish quotas and may enable new forms of certification that will be of great interest to the many concerned consumers of regulated products.
What fish is this?
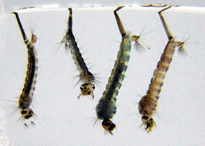
2. Makes expertise go further. Mosquito control programs depend on accurate species identification, a task requiring great expertise, particuarly for larval forms, which can provide early warning before adults hatch and can be treated with local measures. Once a reference library of DNA barcodes is established, DNA-based identification can be applied by many more personnel to more effectively target control measures and limit injury to non-harmful species.
To spray or not to spray?
Worried taxonomists (part 2). In April 2006 Conservation Biology, Daniel Rubinoff’s mildly-titled essay “The utility of mitochondrial DNA barcodes in species conservation” focuses on the potential consequences of relying on DNA barcodes IF they were to be used as the sole criterion for species discovery. Before commenting on this issue, I point out the essay leaves out the multiple practical benefits to biodiversity science which arise from allowing many more people to identify the species around them. As things stand at present, outside of a few well-known groups such as birds and butterflies, taxonomic identification of recognized species is the province of a few experts. Even an expert can identify only a small part of the plant and animal kingdoms, and often cannot identify all stages of life because they lack morphologic characters. A reference library of DNA barcodes will assist experts as well as users. The Rubinoff essay raises interesting and important issues, but they are NOT arguments against the aims of DNA barcoding as envisioned by most practitioners. As outlined on the Consortium for the Barcode of Life (CBOL) website, DNA barcoding is being developed as a tool for taxonomic science, not a replacement for it. The Rubinoff essay does allow that “for groups that are already relatively well known, especially birds and mammals, molecular studies based on barcode-sized sequences have revealed cryptic DNA lineages and may be helpful”. However, the essay states that “the use of DNA to survey already studied groups or test hypotheses…is not truly barcoding”. Rubinoff provides his own definition: “true barcoding consists of broad, essentially blind and random surveys of communities with little or no background information,” which certainly sounds like a scary idea! If analyzing known groups is not barcoding, this will be news to CBOL, as the current initatives include include All Fishes, All Birds, known commercially-important species of Canada, known pests and invasive species, moths of North America, and sphinx and saturnid moths of the world (see CBOL website). (For an idea of the range of activities sparked by the CBOL intiative, see the published symposium from the First International Conference on Barcoding Life held at the Natural History Museum, London, 7-9 February 2005.) It is likely that these large scale surveys of known groups will uncover cryptic lineages, as Rubinoff describes, but they are far from “essentially blind and random surveys of groups with little or no background information”.
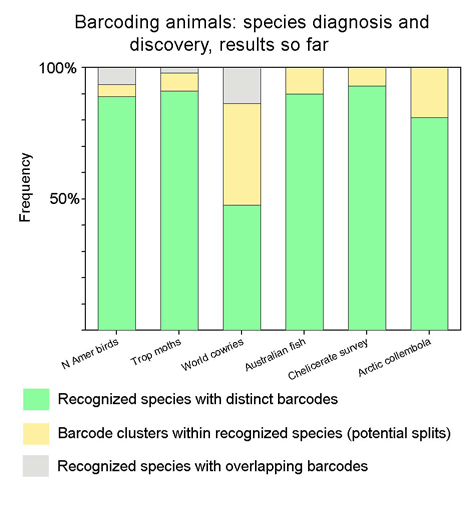
It is from large-scale analyses of recognized species in well-studied groups that we will be able to develop confidence in and understand the limitations to barcoding as a tool for species identification and discovery. That said, it is an unremarkable observation that high levels of mitochondrial divergence often signal new species. Ultimately it may be possible to apply confidence thresholds to various levels of mitochondrial sequence divergence, as Chris Meyer and Gustav Paulay’s work on cowries suggests, but this will require much more data gathering. The issue of what are the best quantatitives measures of biodiversity is contentious, and DNA sequences are certain to only be a part of that.
For the next critical essay on DNA barcoding, I offer the writer(s) the following observations:
1. DNA barcoding is a taxonomic tool for a) assigning specimens to known species and b) speeding discovery of new species. More work is needed to determine the best use of DNA barcodes in species discovery (for example, distance vs. character-based methods).
2. Barcode sequences may be of interest to those studying deep phylogeny, but barcoding does not aim to analyze evolutionary groupings above the species level.
3. In some cases a COI barcode narrows identification to a few closely-related species, but no further.
4. Divergent sequence clusters lacking biological co-variants (eg morphologic characters) signal a need for further taxonomic study.
I close with an inspiring quote from an in press Royal Proceedings article by Paul Barber and Sarah Boyce applying DNA barcoding to analyze diversity in stomatopod larvae. They call for an “iterative process of DNA barcoding…followed by taxonomic study…Such a synergy between molecular geneticists and taxonomists will greatly advance our understanding, description and cataloguing of our planet’s biodiversity, moving us closer to the goal of documenting the entirety of the world’s biodiversity in both marine and terresterial environments. However, this synergy will only be possible if funding is directed both towards barcoding efforts as well as traditional morphological-based taxonomy that successful barcoding efforts will require.”

 The All Birds Barcoding Initiative (ABBI) issued its
  The All Birds Barcoding Initiative’s inaugural workshop will be held at the Museum of Comparative Zoology, Harvard University on September 8-9, 2005. Mark Stoeckle has prepared an
  The conference, held on 10 Feb 2005, brought together over 200 participants from a wide range of disciplines. The Natural History Museum has