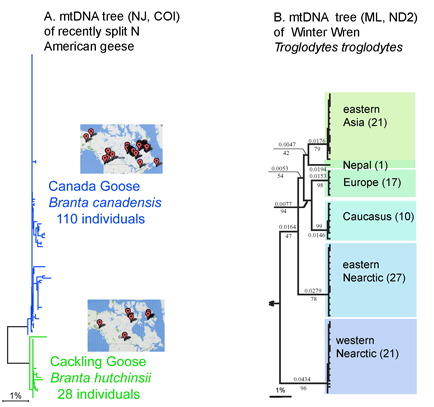
“Tag sequencing” reveals vast microbial diversity

A “tag sequencing” approach analogous to mtCOI sequencing for barcoding multicellular organisms reveals vast numbers of very rare, highly divergent, deep sea microbes.  In August 2006 PNAS (Sogin et al Proc Natl Acad Sci USA 32:12125), researchers from Marine Biological Laboratory at Woods Hole and Royal Netherlands Institute for Sea Research report on pooled bacterial samples collected at 550-1,710 meters in the Atlantic Ocean. To enable detection of rare populations, they focused on a short hypervariable region of 16s rRNA (only 79 bases) and analyzed a large number of PCR amplicons (118,000!) using 454 Life Sciences technology. This approach makes it economical to analyze enormous numbers of sequences from pooled environmental samples and avoids possible selection artifacts due to biases in amplifying longer PCR products and in cloning. Remarkably, the very short 79 base pair “tag” captured about 90% of the sequence differences in full-length 1500 base pair 16s rRNA sequences.


Sogin et al 2006 PNAS

The results were compared to a V6 hypervariable region database, which contains about 40,000 unique V6 sequences extracted from the nearly 120,000 published bacterial rRNA gene sequences. A small number of sequence tags similar to known bacteria made up most of the samples, including 25% that were identical to sequences in the database and 40% that were no more than 3% different. Overall 75% of “total tags” were less than 10% different from previously sequenced bacteria. The remaining 25% was comprised of thousands of low abundance, extraordinarily diverse populations. The authors conclude the “rare biosphere” is “an ancient and..nearly inexhautible source of genomic innovation..[that] at different times in earth’s history..may have had a profound impact on shaping planetary processes.”  There is a lot more we will learn through standardized genetic analysis using short sequences, including mtCOI barcodes and v6 rRNA tags, applied to vast numbers of organisms.

Barcode libraries grow on the web

The All Birds Barcoding Initiative (ABBI) website barcodingbirds.org provides a continuously updated progress report on barcoding world birds. A live feed matches barcodes deposited in the

Barcode of Life Data Systems (BOLD) to a checklist of world birds.  barcodingbirds.org visitors can view world and regional progress reports, progress by orders and families, and detailed results for individual species including zoomable Google world maps showing where barcodes were collected.  A link out to species pages in Integrated Taxonomic Information System (ITIS) is provided.

A sibling website fishbol.org provides live updates for the Fish Barcode of Life initiative (FishBOL) which aims to collect barcodes from all fishes, approximately 30,000 species.

In addition to assisting researchers scattered across the globe track progress and coordinate efforts, these sites will interest many other persons. They link an enormous amount of taxonomic information with growing genetic databases derived from museum collections. The instant Google maps provide a early glimpse of what these sites can do.  Future tools will overlay genetic differences in mitochondrial DNA barcodes on top of the geographic map. These “mashups” of traditional taxonomy, widely-accessible species identification through genetic barcode analysis, and user-friendly visualization will have many viewers.

Minimalist DNA barcodes to help with museum specimens

Analyzing shorter barcode sequences is an inexpensive way to link museum specimens with degraded DNA to the barcode database. In Molecular Ecology Notes July 2006, Hajibabaei et al first demonstrate in silico that COI sequences as short as 109 base pairs contain enough information to assign most specimens to known species, using simulated “minibarcodes” taken from two full-length barcode datasets. The researchers then analyzed the recovery and performance of various lengths of “minibarcodes” amplified from 33 dried and 91 ethanol-preserved insect specimens ranging in age from 1 to 21 years. As shown in the below, although full-length barcodes were recovered from only 24-39% of specimens, there was encouragingly high success amplifying shorter segments. 


As expected from the in silico analysis, in most cases species could be distinguished as well as with full-length barcodes, ie sequences formed distinct non-overlapping clusters in a NJ tree. Hajibabaei et al’s results indicate that analyzing shorter minibarcode sequences can link museum specimens with degraded DNA to the gold standard full-length barcode database. Rather than spend time and money optimizing primers and amplification conditions on individual specimens, instead apply a general method that recovers a 100-400 bp fragment. They point out this approach will be useful “when barcoding reveals several cryptic species within what had been viewed as one species, and it is not morphologically evident which of them matches the holotype” and as “a cost-effective way of building barcode libraries with broad geographical coverage”. They caution that “very short barcode sequences are..valuable for the identification of old specimens from SELECTED NARROW taxonomic arrays” (emphasis added)

I agree a mini-barcode approach can be useful in certain situations, and emphasize their caution that it is not a substitute for a standardized full-length barcode database. First, if widely used, a minimalist approach could easily devolve into a Tower of Babel, with a hodgepodge of non-overlapping minibarcodes that cannot be compared to each other. Second, even if the minibarcodes were standardized so they all overlapped, a simple calculation implies that they would lump together most species with less than 1% sequence difference (in birds, this is about 15% of species). Less than 1% sequence difference means less than 6.5 diagnostic differences with a full-length barcode, and assuming randomly distributed substitutions, a shorter barcode could easily fail to capture any diagnostic differences. 

Some taxonomists begin to worry less

In 21 June 2006 Heredity News and Commentary “DNA barcodes: recent successes and future prospects” Dasmahapatra and Mallet describe the DNA barcoding initiative as “plausible and worthwhile” and conclude that “recent studies convincingly demonstrate the efficacy of DNA barcoding to recover biologically significant groupings or species”. Their generally positive review stumbles near the end with a call “to supplement the mtDNA-based barcode with nuclear barcodes.” This is an impractical proposal of uncertain benefit. First of all, routinely adding a “nuclear barcode”, if one were to be found, would be solving a problem that does not exist, as there are few cases so far in which an mtDNA COI barcode does not distinguish closely-related species. Of course these exceptional cases need further taxonomic study “integrating DNA sequencing, morphology, and ecologic studies”. Secondly, although over 30 years of research demonstrate the broad utility of mtDNA in delimiting animal species, no one has yet identified a nuclear locus that can regularly distinguish closely-related species, as Dasmahapatra and Mallet acknowledge. 

 Most of the topics in their review are analyzed in our 2005 brochure “Barcoding Life, Illustrated” which outlines the benefits and limitations to DNA barcoding, including a section on “Why barcode animals with mitochondrial DNA?” . 

Establishing a DNA standard barcode for land plants

Kew Scientist April 2005Plant researchers from 11 world herbaria are investigating DNA regions for their potential as barcodes for land plant species. From the project rationale: “although the mitochondrial gene region, CO1 ( cox1 ), has already been used with considerable success across a range of animal groups and shows promise in at least some algal groups, it is characterized by relatively low rates of sequence divergence in land plants. Mitochondrial DNA in land plants also undergoes rearrangements, exhibits incorporation of foreign genes and frequent transfer of some genes to the nuclear genome. It is therefore desirable to find an alternative region or, if necessary, regions from one of the other genomes that would be suitable as a barcode.”

This project aims to establish a standard DNA barcode for land plants. Phase 1, completed in December 2005, was a survey of regions that have potential as land plant barcodes. Phase 2, to be completed by January 2007, is to “ground test” the most promising regions in a series of parallel case studies that incoporates representatives of all major land plant lineages.

If this competition is successful, it should be relatively straightforward (ie fast and inexpensive) to compile a comprehensive library of plant DNA barcodes, as there are only about 500,000 known plant species, the world catalog is thought to be essentially complete, and there are several herbaria with large specimen and DNA collections.

mtDNA sequences can define insect species

Grey Tiger Beetle photo by Alan Henderson, Museum VictoriaDNA-based species descriptions could enable a catalog of life on Earth. Without some sort of automated approach, I believe this goal is unattainable. Insects are a good place to start testing an automated sequence-based approach, as there are about 1 million insect species already described, and probably several million more to go. In upcoming August 2006 Systematic Biology Pons et al examine genus Rivacindela tiger beetles in Australia, providing an explicit test of a DNA sequence-based approach to defining species. They analyzed 468 individuals from 65 sites, using sequence data from 3 mitochondrial genes including DNA barcode region of COI, and found sequence variation was strongly partitioned between 46 or 47 putative species, using a novel tree-based, quantitative method of species recognition based on fixed unique diagnostic characters. Most (40 to 43) of the species entities were recovered by analyzing the three gene regions separately; COI alone produced the closest match to the full data set. The putative species defined by sequence data exhibited biological properties of species in terms of geographic ranges and known morphologic characters. Average divergence within species was .5%, much lower than average among species of 6.3% and between sister species of 2.2%. The sequence analysis took 3 days on a desktop computer, so if this approach proves useful, it can be a benchmark for testing faster methods.

Beginning to build a neotropical bird species index with DNA barcodes

Photo by Arthur Grosset: Planalto Slaty-Antshrike Thamnophilus pelzelniDNA barcodes index species. In most animal species studied so far, mtDNA differences within species are much smaller than those between species. As a result, species appear as distinct clusters in a simple neighbor-joining tree of COI barcodes. The uniformity of this patterning gives confidence that a DNA barcode library based on relatively few individuals per species will be a reliable index for assigning unknown specimens to known species.  Although we are just at the beginning of compiling barcodes, and although we need phylogenetically-informed mathematical analysis about how to define clusters particularly in groups not well-studied, I am struck by how obvious most species clusters are. There are of course exceptions and limits (hybridization, young species, slow mitochondrial DNA evolution) but it is likely that someone with no knowledge other than a neighbor-joining tree of DNA barcodes could reconstruct most species categories, although they wouldn’t know anything about the biology of the organisms. This suggests viewing DNA barcoding as a diagnostic tool that links to biological knowledge, just as a laboratory test is used to detect HIV for example, and thereby point to a large body of biological knowledge. 

                                                                                           There are more bird species in the Neotropics than anywhere else. Over 4,000 of the approximately 10,000 world bird species live in South and Central America and the Caribbean, including over 3000 endemics. The large number of speciose families and the fact that intraspecific genetic variation is generally thought to be greater in the tropics than in temperate regions (eg Balakrishnan 2005 Syst Biol 54:689) might challenge DNA barcoding. In what I believe is the first explicit application of DNA barcoding to Neotropical birds (Vilaca 2006 Revista Brasileira Ornitologia 14:7) researchers analyzed 16 species of antbirds in the Atlantic Forest region of southeastern Brazil, with half of specimens obtained as blood samples from birds in the field. All species form distinct clusters in a neighbor-joining tree with 99% bootstrap support, including the recently split pair Thamnophilus pelzelni (shown above) and T. ambiguus. Maximum intraspecific variation is less than 1% except in T. caerulescens which shows 2 distinct lineages, highlighting a good candidate for further study. 


Mitochondrial DNA analysis regularly reveals new species, supporting DNA to lead the way

There are so many examples of new animal species found through mitochondrial DNA analysis that I believe this should be a routine part of species descriptions. Using morphology alone, taxonomists have often overlooked species that are readily apparent on mitochondrial DNA analysis, including in what should be ideal circumstances using intact adult specimens of large, abundant, and/or economically important organisms. Morphologic characters have been found in some cases but only after DNA has led the way, indicating the discovery process would have been much faster if DNA were analyzed at the beginning. Speed is likely a good way to attract funding, as the public will want the fastest and therefore most economical approach. Mitochondrial DNA analysis can also help extinguish synonomies which have persisted in literature for decades (eg Siddall and Budinoff 2005. Conservation Genetics 6:467).

Under current practice, species recognition whether big or small can be slow (see also earlier post with timeline for discovery of New York Central Park centipede).

Wada et al 2003 Nature 426:278Do you see a new species anywhere? Baleen whale specimen collected in 1976, new species description 27 years later based in part on mitochondrial DNA characters (Wada et al. 2003. Nature 426:278)  


Varroa mite, BBC   

Does this look like 1904? Honeybee mite Varroa jacobsoni described in 1904. In 1970’s, worldwide epidemic infestation of honeybees presumed due to V. jacobsoni began in Asia. 30 years later, epidemic discovered to be due to a new species, V. destructor (Anderson and Trueman 2000. Exp Appl Acarology 24:165). Species description based on mitochondrial DNA divergence; no morphologic characters other than body size.


Grapefruit-sized DNA sequencer in development

With funding from the Gordon and Betty Moore Foundation, researchers at Reveo, Inc. and the University of Washington are collaborating on developing a grapefruit-sized sequencer. It uses electronic and photonic effects rather than liquid chemistry and could potentially sequence an entire genome for pennies.

In 2002, Godfray recognized that “in 10 or 20 years time it will be simpler to take an individual organism and get enough sequence data to assign it to a “sequence cluster” (equivalent to species) than to key it down using traditional methods” (Godfray 2002 Nature 417:17). That future is getting closer.

Here is your sequencer, sir

Undiscovered species lurking in museum drawers

Drs. Dalebout and Baker, University of AucklandFour whales stranded on the coast of California in the 1970s were identified as Hector’s beaked whale Mesoplodon hectori (Mead 1981 J Mammalogy 62:430). 20 years later mitochondrial DNA analysis revealed these 4 specimens, and a fifth stranded in 1997, to be a new species, designated Perrin’s beaked whale Mesoplodon perrini  (Dalebout et al 2002 Marine Mammal Sci 18:577). The presence of a new species was first recognized by researchers compiling a database of mitochondrial DNA to assist in species identification. The formal species description includes diagnostic molecular characters, helping integrate DNA sequence data with classical taxonomy. As emphasized by Rob DeSalle and others, there is a need to interweave phylogeny and classical taxonomy, which can be met by including DNA sequences routinely used for evolutionary analysis as diagnostic characters in species descriptions (DeSalle et al. 2005 Phil Trans Royal Soc B 360:1905). 

I find it remarkable that a species as large as a whale can languish unrecognized in a collection. How many new species lurk in museum drawers awaiting discovery?  A comprehensive DNA barcode survey of a tissue collection could be relatively inexpensive, as DNA isolation from tissues is generally simple and and sequencing costs are approaching a $1 a specimen. If whales can hide in museums for 20 years, there must be a multitude of new species already collected that will be uncovered by DNA analysis.