Bird in hand may need DNA reference library

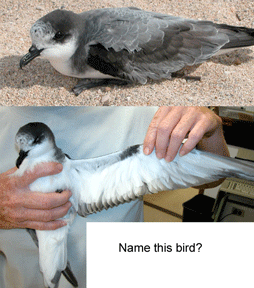
Even in well-studied groups such as birds, there are specimens that experts cannot identify. For example, the Pterodroma petrel shown at right was closely examined and photographed after it was captured on a cruise ship outside Maui in 2003, but not conclusively identified.  More generally, some closely-related bird species cannot be reliably distinguished morphologically, particularly juveniles and adults in non-breeding plumage, limiting the value of banding efforts in determining population size, mortality, and range, for example.

When morphologic identifications are routinely incomplete, it may be worthwhile to routinely analyze DNA. For birds this is usually simple as a single breast feather plucked from a live bird and stored dry at room temperature generally contains sufficient DNA for barcode analysis. 

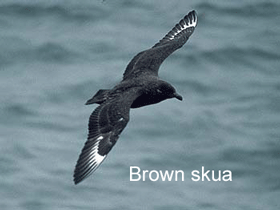
Of course, for reliable identifications, a comprehensive reference library of DNA sequences is essential. The need for a well-stocked library is highlighted by an article in April 2007 Ibis on skuas. Skuas are large, brown, gull-like predatory birds that nest in polar regions and migrate widely in open oceans, although their usual routes are not known. Young skuas do not reappear on breeding grounds until they are 3 years old, and any reports on non-breeding birds are of great interest.  In an earlier paper (Ibis 146:95, 2004) using mitochondrial DNA analysis (698 bp of 12s and cytochrome b), the researchers concluded that 2 birds found in England in 2001 and 2002 constituted the first records of Brown Skuas (Stercorarius antarctica) in Europe. In this year’s follow-up paper, they dropped that conclusion, as sampling of a larger number of individuals showed that the 3 south polar skua species, S. antarctica, S. chilensis, and S. maccormicki are not distinguished by 12s/cytb mitochondrial DNA sequences.  

All told, this is a lot of academic effort for an identification question that could have been answered quickly by a web inquiry if there were a comprehensive library of avian DNA barcodes. So far, researchers have contributed about 8,600 DNA barcode sequences from about 1,800 of the 10,000 known avian species (see www.barcodingbirds.org ), helping create an enduring reference work that will be of long-term use by a large community of scientists, regulatory personnel, and general public who are interested in birds. 

In closing, one interesting finding in the 2007 “retraction” paper is the general absence of mitochondrial genetic variation among south polar skua species. Two recent studies of southern polar skuas (Polar Biol 2006 29:153; J Ornithol 2006 147 (suppl):238 ) showed regular hybridization with normal reproductive success between C. antarctica and C. maccormicki, and analysis of mitochondrial hypervariable regions indicated “strong gene flow and little genetic differentiation among southern hemisphere taxa”, which is what population biologists usually say when they study single species. Biologists are generally loathe to “lump” species, but these findings suggest it may be more accurate to consider the south polar skuas as one species. 

Helping the public by incorporating DNA barcodes into species descriptions

A bewildering array of morphologic nuances are needed to identify species.  DNA sequences, aka DNA barcodes, can also be identifiers, with the advantage that anyone with the right device can name a specimen without having to consult an expert or search through taxonomic keys which are generally indecipherable to the non-specialist. As DNA barcode identifications become more common, will this mean a loss of biologically important knowledge? To my reading, the answer is no, as the subtle differences in specialized structures used to identify organisms generally provide little insight into how organisms live and what they do. Thus it is exciting that standardized COI DNA barcodes are being incorporated into species descriptions as this will help democratize access to species names and the biological knowledge they represent.
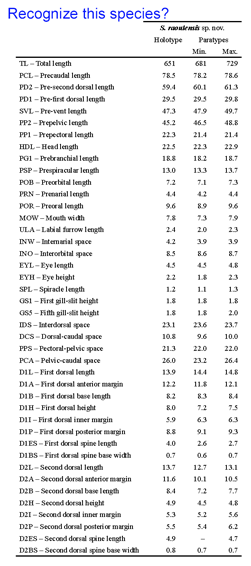
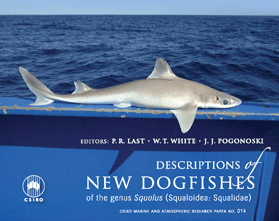
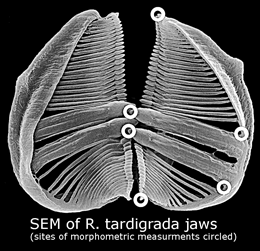
A 2007 monograph describes 11 new dogfish species in the genus Squalus from the Indo-West Pacific using “a rapid taxonomic approach” incorporating digital images, morphometric measurements, and DNA barcodes.  Even for something as recognizable as a shark, it would be difficult for most persons to apply the morphometric measurements (example shown at left) used to characterize these new species. DNA barcoding has the potential to expand the pool of persons able to name shark species, helping those trying to understand shark biology and those assigned to enforce regulations that protect shark species. Biologists might choose to adopt DNA barcoding as a routine identification tool, rather than measuring “labial furrow length” or “internarial space”, for example.  

For many organisms, even those of economic importance, the number of persons who can apply the relevant morphologic tools is often very small, and the value of DNA barcoding as a widely-accessible tool potentially greater. 

In Can Entomol 139:319 (2007) Jean-Francois Landry, Agriculture and Agri-Food, Canada, provides a taxonomic review of the leek moth genus Acrolepiopsis in North America which includes serious pests of onion and garlic crops.

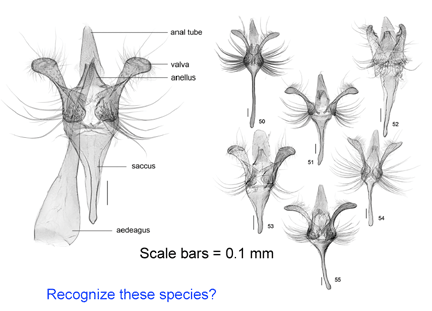
The monograph includes detailed morphologic illustrations of male and female specimens, cocoons, pupae, and crop damage, and for the non-specialist, DNA barcodes of 30 individuals from 5 of the 6 species, and these are also publicly available on the BOLD website https://www.barcodinglife.org under “Published Projects” tab, including maps showing collection locations and photographs of the individual specimens.

As shown below in the dissections of male Acrolepiopsis genitalia, the morphologic illustrations can be beautiful, but the distinctive characters are not necessarily informative about the biology of the species. 

Iterative cycle of taxonomic and DNA sequence re-assessment essential for reliable barcode databases

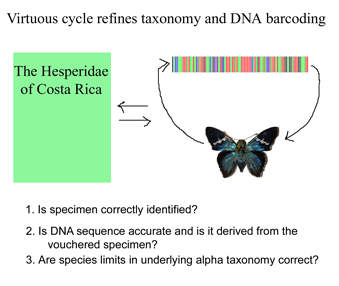
Like a map that is regularly updated, the reliability of DNA barcode databases will improve over time. To enable improvement, researchers have agreed to standardize on a particular region, to analyze multiple individuals from each species, and to revise DNA sequences and taxonomic labels as new information becomes available. By using specimens archived in museums, taxonomic identifications and DNA sequences can be re-checked. In March 2007 Med Vet Entomol 21:44, researchers from University of Wollongong, Australia, apply DNA barcoding to the identification of 9 species of forensically and medically important blowflies in family Calliphoridae. Calliphoridae blowflires cause disease in humans and domestic animals, and, in cases of murder or suspicious death, identification of blowfly species is a first step in determining the post-mortem interval.  Identifications of adult flies requires specialized taxonomic knowledge and even experts have difficulty identifying egg and larval stages and the fragments of decomposed insects that may be all that is available in forensics.  Nelson et al sequenced COI barcode region from legs of 52 adult flies representing 9 species in genus Chrysoma. The specimens were deposited in the Diptera collection at the School of Biological Sciences, University of Wollongong. NJ and Bayesisan analyses recovered each species as a distinct cluster, ie a well-supported reciprocally monophyletic group.
Early in the study, two complications were encountered. First, four specimens preliminarily identified as Ch. latifrons grouped with Ch. semimetallica. Second, a specimen identified as Ch. saffranea grouped with its closest relative Ch. megacephala. The adult voucher specimens were re-examined and the nuclear ITS gene was sequenced for these individuals. This confirmed that the first four specimens had been misidentified, in retrospect unsurprising given the close morphological similarity of the two species. The fifth anomalous individual was diagnosed as a hybrid based on comparison of nuclear and mitochondrial sequences. The authors conclude “the need for re-examination of misplaced specimens…highlights the importance of a voucher collection for all members of a barcode database.” I would add that the researchers’ willingness to re-examine taxonomic identifications and sequence data is just as important as the availability of voucher specimens.

Two other recent papers on blowfly identification with mitochondrial DNA showed incomplete resolution at species level, but in these the authors did not close the taxonomy-DNA circle, either by re-examining specimens or repeating sequence analysis.  In Int J Legal Med 2007, Wells et al examined Lucilia sp blowflies, using published GenBank sequences and newly sequenced adult flies, and found overlap between all sister species of Lucilia for which 2 or more specimens were examined. It is unclear from this short note how many specimens were examined, their geographic origin, and whether they are stored as vouchers (online supplementary material is not available on publisher’s website at the time of this writing). There is no mention of re-examining their own specimens or analyzing other loci and of course it is not possible in most cases to confirm that taxonomic identifications and sequences in GenBank data are correct. 

In July 2007 Proc R Soc B Whitworth et al examine 31 Protocalliphora individuals belonging to 12 species. Protocalliphora are Holoarctic species whose larva parasitize newly-hatched nestling birds. Blowfly larvae or pupae were collected from nests, and emergent flies were identified based on fly and pupal case morphology. As “the lower half of the abdomen of each fly was used for DNA sequencing” I assume this would not leave enough tissue for voucher specimens.  They first attempted to construct a phylogeny using nuclear ITS, but found a very low level of substitutions between species and those found were all autoapomorphies, both of which suggest this is a very recently derived species complex. They were able to construct a phylogeny using amplified fragment length polymorphism (AFLP) mapping, with each species forming a reciprocally monophyletic group. This was then compared to mitochondrial sequence data. 

Given that the title of the paper is “DNA barcoding cannot reliably identify….” it is inexplicable and also scientically inaccurate that they did NOT analyze the standard 648 bp COI barcode region, instead using a 374 bp fragment of COI and a 579 fragment of COII!  It is likely that the results would be similar in any case, but their mitochondrial data cannot be combined with or directly compared to results with the growing DNA barcode libraries, which now contain about 260,000 barcode records from about 29,000 species. The mitochondrial sequences showed distinct clusters for 6 of the 12 species, and there were 2 other clusters comprising 2 and 4 species respectively.  A separate analysis suggests these multi-species clusters reflect horizontal transfer of mitochondrial DNA among closely-related species as a result of Wolbachia infection, and the authors speculate that, since Wolbachia are found in “15-75% of insect species”, there may difficulty using DNA barcoding to resolve many insect species. To my reading, their data suggest this is a very recently derived species complex and hybridization among species is common.  One of the utilities of DNA barcoding is to highlight exceptional groups, such as this one appears to be, deserving of further study. For the next studies on DNA barcoding in Lucilia and Protocalliphora, I hope the researchers retain voucher specimens and sequence the standard barcode fragment!

DNA barcodes suggest fractal nature of genome

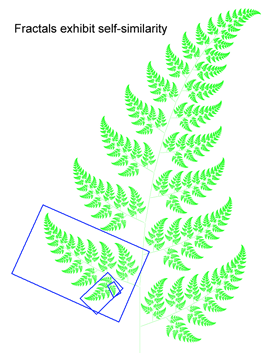
Growing data sets demonstrate DNA barcoding usually works, but why? Why does a very short stretch of DNA, such as a DNA barcode which usually represents less than one one-millionth of the genome, enable identification of most animal species? In computer language, Rod Page describes a DNA barcode as “embedded metadata“. Here I suggest an analogy to fractals, which might help convey what DNA barcodes reveal about how genomes are constructed.
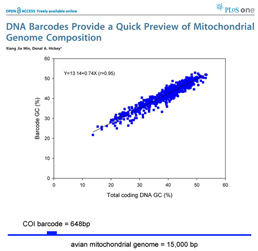
DNA barcoding usually works because patterns seen in very short DNA sequences usually reflect patterns seen in longer sequences. In this way, DNA barcodes demonstrate “self-similarity”, a fundamental property of fractals. In March 28, 2007 PLoS One, researchers from Concordia University, Quebec, analyze 849 complete animal mitochondrial genomes, comparing GC composition in 648 bp COI barcode region to GC composition in the mitochondrial genome as a whole. Min and Hickey found “such short sequences can yield important, and surprisingly accurate, information about the [mitochondrial] genome as a whole. In other words, for unsequenced genomes, the DNA barcodes can provide a quick preview of the whole genome.” It will be of great interest to extend this analysis to compare mitochondrial barcodes to nuclear genomes; the general success of barcoding approach suggests there will be similarly close correlation.
Overall, the patterning of barcode differences supports the emerging view that selective sweeps prune mitochondrial diversity within species and mitochondrial and nuclear co-evolution are tightly linked.

.

.

.

.

Avian genetic data legacy relatively modest, jumbled

Birds have been the subject of intense genetic study for over 20 years. How large is the legacy of avian genetic data? Researchers studying species-level differences in birds and other vertebrates have most often used cytochrome b (cyt b). Some have worried that analyzing COI in birds is redundant as there are already cyt b sequences for many avian species. Of course, even if there were a complete set of cyt b sequences for the approximately 10,000 species of world birds, it would still be beneficial to collect COI barcodes to enable wide comparisons across the diversity of life.  Here I look briefly at what is in GenBank for birds. To do so, I prepared a spreadsheet “avian name look-up.xls”, which recognizes 2,347 synonyms, alternate and mis-spellings, and extinct species, producing an output list of extant bird names harmonized to Clements.

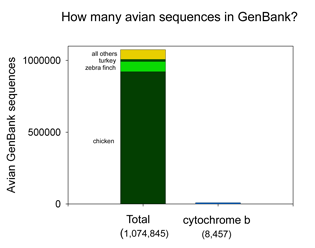
There are more than 1 million sequences in GenBank, but over 900,000 are from the Jungle Fowl (ie chicken, Gallus gallus), and another 85,000 from Zebra finch (Taeniopyga guttata) and Wild turkey (Meleagris gallopavo).  That leaves about 67,000 sequences in total representing the rest of the approximately 10,000 species of world birds. According to Clements’ Birds of the World (including updates through 2006), there are 9,919 recognized species. The other world lists are very similar, and differ primarily in whether certain forms are recognized as species or subspecies and in assignment of generic names. I find it surprising there is not a single global taxonomic authority for bird species status, names, spelling, generic and family classification.  As a comparison, medicine would be in great difficulty if there were not a single standard nomenclature for pathogenic bacteria

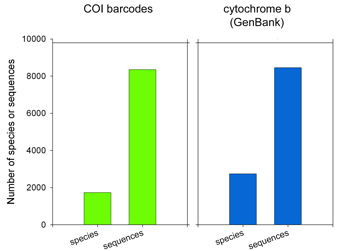
62,571 of the remaining 66,969 sequences are in the “CoreNucleotide” database (the others are unnamed genetic loci, either Expressed Sequence Tag (EST) or Genome Survey Sequence (GSS) records, and these will not be considered further here).  Only 4,951 bird species are represented by any sequence (50% of world birds), and there are cytochrome b sequences for only 2,751 species (28% of world birds). Of species with cyt b sequences, 60% are represented by single sequences.
How does this compare to COI barcode data so far? As tracked on the All Birds Barcoding Initiative website, researchers have collected 8,353 COI barcode records from 1,730 species, including 2 or more sequences from approximately 80% of species analyzed to date.

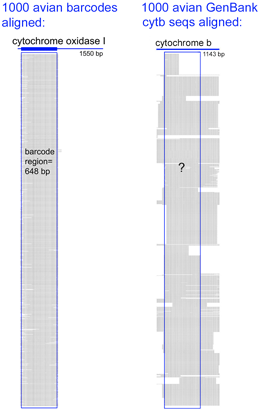
Virtues of the DNA barcode data set include that sequences are linked to vouchered museum specimens and their associated collecting data, sequence records include trace files to confirm sequencing accuracy, and most important all sequences can be directly compared because they derive from a standardized region. GenBank cyt b files include sequences of varying length and position along the gene. An alignment of 1000 avian COI barcodes and 1000 avian cyt b sequences hints at the power of a standardized approach.

.

.

.

.

.

.

.

.

.

Encyclopedia of Life dream comes true

A dream of many came to life this week with launch of Encyclopedia of Life. In the words of E.O. Wilson, “imagine an electronic page for each species of organism on Earth available everywhere by single access on command”.  Encyclopedia of Life is a global effort to document all 1.8 million named species of plants and animals on Earth in a free online resource. With support from the John D. and Catherine T. MacArthur Foundation and the Alfred P. Sloan Foundation, scientists from many institutions including Field Museum of Natural History, Harvard University, Marine Biological Laboratory, Smithsonian Institution, and Biodiversity Heritage Library have joined together to initiate the project. Like Wikipedia, the Encyclopedia of Life aims to draw on the global pool of expertise, allowing users to add information and details, such as species sightings and photos, with the content authenticated by scientists. From EOL’s home page: 
“Comprehensive, collaborative, ever-growing, and personalized, the Encyclopedia of Life is an ecosystem of websites that makes all key information about life on Earth accessible to anyone, anywhere in the world. Our goal is to create a constantly evolving encyclopedia that lives on the Internet, with contributions from scientists and amateurs alike. To transform the science of biology, and inspire a new generation of scientists, by aggregating all known data about every living species. And ultimately, to increase our collective understanding of life on Earth, and safeguard the richest possible spectrum of biodiversity.”

To highlight just one component of the project, the Scanning and Digitization Group is addressing the critical need for wider access to published literature, including older works. At present, “to identify a rare specimen, a biologist may need to consult a 100 year-old text because that was the last time the species was found, described, and recorded. This essential historical reference gives exceptional value to the libraries encompassed by the partners of the Biodiversity Heritage Library [a colloboration of ten natural history museums, herbaria, and research institutions]. Today, mainly those few who can enter their library doors can read the wealth of the world’s publications held within. This effectively hides this storehouse of knowledge about biodiversity from a range of applications, including research, education, taxonomy, disease control, and the maintenance and protection of ecosystems.”

The Scanning and Digitization Group will accelerate the work of the Biodiversity Heritage Library, an ongoing effort which has already digitized 1.25 million pages, enabling “citizens unaffiliated with major institutions to search, read, and download articles previously unavailable to them. Educators can guide students’ biological research with a wealth of examples incorporated in lesson plans and assignments. Illustrations in rare taxonomic works can inspire artists. The openly available Biodiversity Heritage Library will link the great biodiversity in tropical and developing countries to literature about biodiversity primarily held in a few North American and European libraries, a significant intellectual repatriation.”
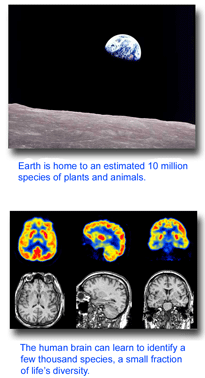
I believe DNA barcode libraries will provide an essential genetic “index” for locating species pages in the Encylopedia of Life. The best-trained human mind can identify a few thousand species. Comprehensive DNA barcode libraries and inexpensive, portable sequence devices will enable anyone to find EOL’s home page for multimillions of species, regardless of life stage, gender, or whether the specimen is in bits and pieces.

 There is a thrilling launch video–do not miss it!

100 million years without sex: COI clustering in bdelloid rotifers challenges theories of how species are formed and maintained

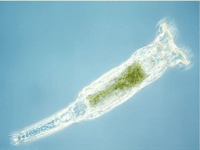
Philodina roseola, 400 um, Meselson LaboratoryWhy are there species? The usual answer is sex: reproductive isolation maintains differences between species and reproductive mixing maintains similarity within species.  According to recent work with bdelloid (the “b” is silent) rotifers, a group of microscopic invertebrates thought to have adopted asexuality 100 million years ago, sex is not necessary! In September 2005 Hydrobiologia 546:29, researchers at the University of Arizona analyzed mitochondrial COI of 102 females of 21 morphologically defined species of bdelloid rotifers, including many sympatric morphospecies. Contrary to predictions of evolutionary theory for asexual organisms, Birky et al show that these are 21 independently evolving clades, with small differences within and large differences among lineages, the same patterning seen in COI analyses of sexual reproducing species. Also contrary to predictions, the Ka/Ks ratio  (expressed/silent mutations) indicates that COI is subject to strong selection. [In asexual organisms, there is less need for sampling multiple genes because the entire genome is a single linkage unit. Thus genetic differences in COI are expected to reflect evolutionary history of the organism, i.e. the “gene tree” is expected to be the same as the “species tree.”] (For fun see Birky lab bdelloid video!)

Fontaneto et al PLoS Biol April 2007In April 2007 PloS Biology researchers from University of Milan, Italy, Imperial College London, University of Cambridge, and Royal Botanic Gardens, Kew analyze morphometric and molecular data of a comprehensive international sampling of Rotaria sp. bdelloid rotifers. All 9 morphologically defined taxonomic species form monophyletic clades in genetic analysis. Multiple clusters in several morphospecies show distinct morphometric measurements of mouth parts, suggesting these represent cryptic species with ecological specialization. Fontaneto et al observe “bdelloids display the same qualitative pattern of genetic and morphological clusters, indicative of diversification into independently evolving and distinct entities, as found in sexual clades” and conclude “this refutes the idea that sex is necessary for diversification into evolutionary species.”  

In these studies, COI sequences accurately identify bdelloid rotifer species, further demonstrating the robustness of DNA barcoding. What is scientifically exciting is how broad application of standardized, minimalist genetic analysis (aka DNA barcoding), combined with traditional morphologic and ecologic study, is providing radical new insights into biology.

Fungal database a Tower of Babel, needs rebuilding

Early in Michael Crichton’s 1990 novel Jurassic Park, Dr. Henry Wu, chief scientist at Jurassic Park Research Insitute, showing visitors around his facility, displays “the actual structure of a small fragment of dinosaur DNA“. Astute readers pointed out Dr. Wu’s dinsosaur genetic resuscitation project was unlikely to succeed, as the sequence in Crichton’s novel was a fragment of the bacterial plasmid pBR322. They discovered this by feeding the “dinosaur sequence” into the online BLAST software engine, which searches the billions of base pairs of nucleotide sequences deposited in the amazing public resource of GenBank and the other international genetic databases, EMBL and DDBJ.

The power of genetic databases as identification tools rests on the quality of sequences and their annotations.  Just as we need regularly updated maps for safe navigation, we need regularly updated genetic databases for accurate identifications.

One of the strengths of GenBank is that it serves as a permanent repository for genetic sequence data. As a result, GenBank is sometimes a permanent repository for faulty data.  In a recent PLoS One paper, researchers from Goteborg University and Chalmers University of Technology, Sweden, and University of Tartu, Estonia, examined the taxonomic reliability of the 51,534 fungal internal transcribed spacer (ITS) sequences in the International Nucleotide Sequence Database (ie GenBank, EMBL, DDBJ). ITS is the most widely used locus for species identification in fungi. The Tower of Babel, Bruegel, Pieter the Elder, 1563The results show a “variegated picture of the taxonomic status of publicly indexed fungal sequences“.  Taxonomic coverage is sparse: of the estimated 1.5 million fungi, less than 1% (9,684 species) are represented. Taxonomic data is lacking for many sequences (27% are not identified to species level), and most of the species-level identifications are unverifiable (82% are not linked to voucher specimens, 63% are not tagged with specimen country of origin, and 42% are marked as unpublished). Sequence comparisions suggest mislabeling is common (11% show best matches to congeneric but heterospecific sequences, and another 7% match among species of a different genus. Overall 10-21% of the INSD sequences have incorrect or unsatisfactory annotations. 

It seems better to start over than to try to revise this Tower of Babel.  Nilsson et al conclude “the large body of insufficiently identified fungi in INSD constitutes a silent plea for a wide and generalized sequencing effort of well-identified and -annotated [type] specimens residing in herbaria worldwide.” Toward this end, an All-Fungi Barcoding Initiative Workshop will be held 14-15 May 2007 at the Smithsonian Center for Research and Conservation, Fort Royal, Virginia. An international collection of researchers aim to hammer out how to build a reliable database, including which gene(s) should be adopted as standard barcode targets.  

So far, DNA-based fungal identifications have primarily used ITS. Other nuclear genes have been used in some studies including the nuclear large ribosomal subunit, beta-tubulin, and elongation factor 1-alpha. It would be excellent if the fungal barcode database could link directly with those being built around the mitchondrial gene COI, which is effective for resolving most protozoan and metazoan (multicellular animal) species examined so far. In this regard it is exciting that a report by Seifert et al in 6 March 2007 Proc Natl Acad Sci USA shows COI provides species-level resolution similar to that for ITS, amplification was generally straightforward, and introns in the COI gene were found in only 2 of 370 Penicillium strains. 

Resolving leaves and branches?

COI barcoding is a standardized approach to identifying species by DNA, helping resolve the “leaves” on the tree of life.  Will the growing arrays of COI sequences also help provide insight into evolutionary history, the “branches” of the tree? I am struck that in some cases, simple genetic arithmetic with COI sequences creates trees very similar to modern phylogenies painstakingly created from multiple nuclear and mitochondrial genes, multiple morphologic characters, and exhaustive computerized analysis. Shown at right, a neighbor-joining analysis of COI barcodes of 264 species of North American birds creates a tree that is quite similar to the most recent understanding of relationships among modern birds, with anseriformes (ducks and geese) next to galliformes (grouse and quail) at the top, passeriformes (perching birds) at the bottom, and most of the other established orders appearing as single lineages in between. Most of the families and groupings of families within these orders also match current understanding, including for example, that flycatchers appear as the basal lineage within passeriformes, and a group of New World passerines called nine-primaried oscines appear together at the bottom of the tree. Of course, a systematist would immediately note that the statistical support for these higher-order branches is weak or absent. I should tread lightly here or not at all, since phylogenetics is the province of mathematical experts, but I will plunge ahead anyway and suggest that, if the single gene neighbor-joining distance tree is “right” say 8 times out of 10, then the apparent lack of statistical support for higher order branches is misleading. There are cases where the COI gene tree is incorrect (eg Hajibabaei et al Genome 49:851 2006).

I close with a picture inspired by the data. If single gene trees usually correspond to evolutionary history, this implies strong barriers to gene flow arise concurrent with differences in the single gene and are continuously maintained.

Seeing in color

A raft of recent articles show the strength and versatility of a standardized genetic approach to identifying species, ie DNA barcoding. Just as color vision helps us rapidly sort objects into unambiguous categories, DNA analysis usually reveals distinct differences among species, including those whose biological differences lie outside the range of our perception, ie cryptic species. I highlight two of the recent articles below.


In March 20, 2007 Proc Natl Acad Sci USA, researchers at University of Guelph, Canadian Agricultural Department, and University of Pennsylvania apply DNA barcoding to 16 species of apparently generalist parasitoid tachnid flies. Smith et al found 73 distinct mitochondrial DNA lineages among 2,134 flies from the 16 morphospecies. The mitochondrial lineages were supported by collateral ecological differences and, where tested, by independent nuclear gene markers. In an accompanying commentary, Scott Miller, Smithsonian Institution, looks at how DNA barcoding is contributing to the “renaissance of taxonomy” and is “emerging as a cost-effective standard for rapid species identification”.

In 26 March 2007 Mol Ecol Notes, scientists from the University of Auckland apply DNA to identifying rat species in Southeast Asia. Geographic variation in mitochondrial DNA of commensal rats provides a window into patterns of human dispersal and migration, but studies are complicated by the presence of multiple rat species in Southeast Asia, and the difficulty of distinguishing among species in subfossil remains at archeological sites.  Robins et al found DNA barcoding with COI mtDNA barcodes distinguished most species, even when short DNA fragments of COI were used (such as might be recoverable from sub-fossil material), and was similarly effective as tree-based methods using COI, cytochrome b, and D-loop sequences.  The genetic methods revealed some polytypic and paraphyletic species, suggesting a need for taxonomic revisions in this group.