What limits mitochondrial variation within species? In January 2008 PLoS Biology researchers from Karolinksa Institute, Sweden, and University of Newcastle upon Tyne, United Kingdom, report on an ingenious mouse model that shows strong purifying selection acting within a single generation, or even earlier, during embryogenesis. Stewart and colleagues employed “mtDNA mutator” mice which are homozygous defective for a nuclear gene which encodes a proof-reading subunit of mtDNA polymerase. These mice have increased levels of mtDNA mutations in all tissues, with mutations evenly distributed along all codon positions in mtDNA protein genes, accelerated senescence and “a number of phenotypes associated with mitochondrial diseases.” mtDNA mutator mice were backcrossed to wild-type mice to produce offspring that inherited defective mitochondria but whose nuclear genome is homozygous normal at the mtDNA polymerase locus. 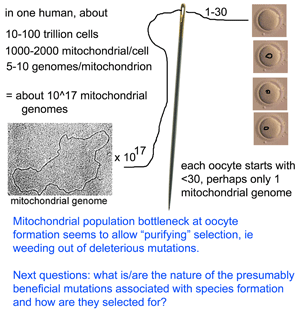 They then sequenced entire mitochondrial genomes from 190 of these progeny individuals in N2 to N6 generations (N2 is the first backcross that is homozygous normal at mtDNA mutator locus). To skip to the conclusion, most of the non-synonomous mitochondrial mutations were eliminated, leaving a pattern of excess synonymous mutations similar to that seen in human populations (which are the largest dataset so far for mitochondrial variation). The authors conclude that the mitochondrial population bottleneck known to occur at oogenesis, which deposits just one or few mitochondrial genomes per oocyte, means each mitochondrial genome must stand on its own so to speak, with the result that those eggs, embryos, or offspring harboring defective mitochondria will fail to survive. My figure at right tries to illustrate part of this process.
In the same issue, David Rand, Brown University, provides a lucid commentary on Stewart et al’s research putting it in the context of mitochondrial and evolutionary biology, and suggesting next steps. Among others, he notes “the new mouse study also begs new questions about positive selection on mtDNA. …it is interesting that no signature of a selective sweep leading to fixation of a novel mtDNA variant was evident in the data”.
Purifying selection against deleterious mutations enabled by an embryonic bottleneck may save mtDNA from “mutational meltdown”. Now we need to understand more about the positive selection on mtDNA that presumably occurs when species adapt to new environments or diverge. I believe that growing mtDNA databases in the form of COI barcodes from a diversity of organisms with varying size, lifespan, population size, and reproductive strategy, in a diversity of environments including marine, terrestrial, temperature, and tropical regions will help solve this puzzle.
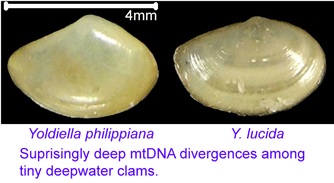 mtDNA differences among these bivalves are remarkably large, even among species in the same genus. The differences among congeneric species in this sample (average 22%, range 12-42%) are larger than differences among entire class Aves (according to my analysis with BOLD software, COI differences among birds in different orders, such as penguins and hummingbirds for example, average 20%, with range 14-28%).
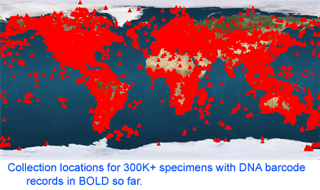 As of 28 january 2008, there are 341,825 barcode records from 35,798 species in the Barcode of Life Database (BOLD)
 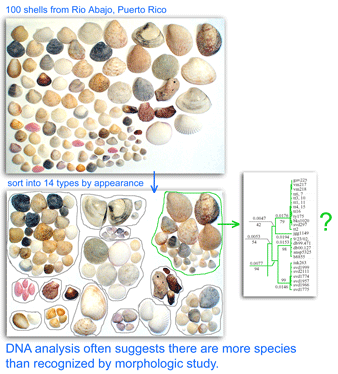 One result is that it has been difficult to compare patterns of diversification between different branches in the Tree. One might ask, how finely and how evenly divided is biodiversity? Are the differences among and within mosquito species (3,400 species), for example, similar to the differences among and within fruit flies (6,200 species) or birds (10,000 species)? Broad application of DNA analysis is beginning to provide some insights. To enable these sorts of comparisons, a standardized locus is needed, as unique genes can solve local branching patterns, but do not allow easy comparisons between branches.
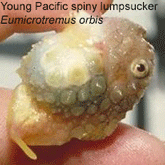 Lumpsuckers are globular, scaleless marine fish with bony tubercles on head and body, and a ventral sucking disc, derived from specialized pelvic fins, which allows them to adhere to environmental substrates. The genus Eumicrotremus comprises 16 species distributed in the Arctic and northern Atlantic and Pacific oceans; the commonest and most widespread in the north Atlantic is the Spiny lumpsucker E. spinosus, which was first described by Fabricius in 1776. A new subspecies E. s. eggvinii was described in 1956, based on a single specimen, and this was later elevated to species level “on the basis of wrinkled skin, numerous dermal warts and a large sucking disk, in addition to the low number of bony tubercles.”
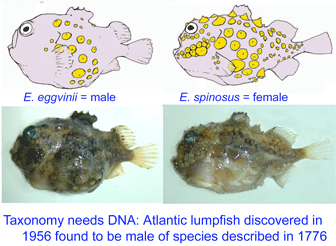 In August 2007
  In 17 September 2007 Zootaxa (
 Sponges are difficult to identify and classify. Many sponges “have a depauperate suite of morphologic characters and/or are plagued by morphological homoplasies” and vary according to environmental conditions, challenging identification at species level and stymying attempts to reconstruct evolutionary lineages. In
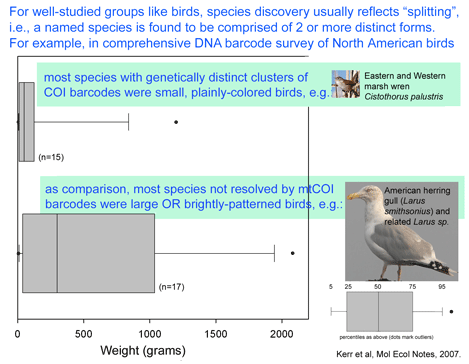
 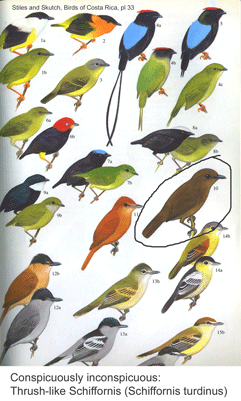 Birds are relatively large, conspicuous, vocal, and mostly diurnal creatures, making it relatively easy for humans to tell apart. Even so, new species continue to be discovered; these usually represent distinct forms within what were thought to be single species. In