In Cladistics 25 Sept 2007, Steven Trewick from Massey University, New Zealand applies mtDNA to help sort out endemic flightless grasshoppers in genus Sigaus, which are restricted to mountainous alpine habitat on New Zealand’s South Island. Here we might expect a complex pattern of diversification. These are small, terrestrial, flightless, presumably non-vagile (ie don’t travel far) animals in a deeply fragmented habitat. Their habitat lies in New Zealand’s central mountains, the Southern Alps, formed by a geologically recent uplift 5 to 2 million years ago. Like other organisms restricted to elevated mountain terrain, they are effectively living on “sky islands.” In this setting, we might expect a plethora of relatively young species with very narrow ranges, with difficulty determining which forms merit species-level status.
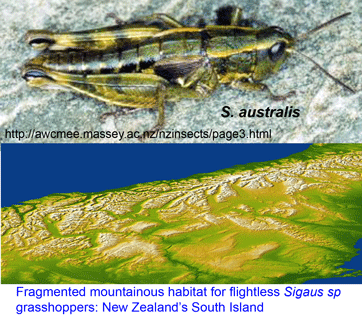 Trewick focused on Sigaus australis species complex, which includes the apparently widely-distributed S. australis, and 5 sympatric or parapatric species with much narrower ranges (S. childi, S. obelisci, S. homerensis, and 2 undescribed species). Within this complex he analyzed 160 individuals collected at 26 locations (mostly S. australis (136 individuals) and 1-13 individuals for the more restricted species). For mtDNA analysis, an approximately 600 bp region of 12-16S and about 500 bp of 3′ COI (ie not overlapping COI barcode region!) were examined.
Although the 3′ COI fragment analyzed in this grasshopper paper has been utilized in a number of invertebrate mtDNA studies, it is just one of many mtDNA targets that give essentially equivalent phylogenetic information (eg, in this study COI and 12S-16S gave same results). The hodgepodge of mtDNA regions analyzed in species-level animal work means that most data cannot be compared or combined. In my view, ALL animal mtDNA studies should include the standard COI barcode (defined relative to the mouse mitochondrial genome as the 648 bp region that starts at position 58 and stops at position 705; https://barcoding.si.edu/PDF/DWG_data_standards-Final.pdf), plus of course any other regions of interest. Standardization on the barcode region ensures long-term usefulness, both as a reference for identification and for comparisons across the diversity of animals. In addition to a defined genic target region, DNA barcode standards have other advantages, including that records are linked to voucher specimens and list primer sequences and include bidirectional trace files and quality scores.
In the present study single-strand conformation polymorphism (SSCP) of a 380 bp 12S fragment was used to screen for differences, and then individuals with different SSCP results were subjected to sequencing, so in the end just 40 of 160 Sigaus sp grasshoppers were sequenced for COI. This also means that there is voucher data in GenBank for just these 40 individuals. Continuing down the DNA barcode standard checklist, primer sequences are not easily accessible (there is a published reference for the primers, but access requires article purchase), it is not stated if bidirectional sequencing was done, and trace files and quality scores are not provided. I hope that future studies on New Zealand orthopterans will include the 5′ COI region and the remaining information, as I believe this will increase their long-term utility both as an identification reference and for comparisons across diversity of animal life (>520,00K individuals representing >50,000 species in BOLD so far). There is a big opportunity for grasshopper specialists to contribute–the BOLD taxonomy browser contains records for only 191 of the approximately 10,000 species in family Acrididae!
To skip to the conclusion, the sequence analysis gave an entirely different picture than existing morphologic taxonomy. 12S-16S and COI gave identical results: four well-supported geographically-structured clades within the widespread S. australis morphospecies, 3 of which had partly overlapping ranges. The 5 described or proposed species in the complex nested within these clusters, with shared or similar mtDNA haplotypes to S. australis from the same region.
The author concludes that the results show that “haplotype sharing and paraphyly essentially invalidate the DNA barcoding approach.” I disagree. To my reading, the most parsimonious explanation is that 1) morphologic taxonomy has overlooked deeply divergent genetic lineages, which likely represent different species, in S. australis for over 100 years, and 2) a number of morphologically distinctive forms have arisen very recently.
In support of the first point I note that in April 2008 report “Diversity and taxonomic status of some New Zealand grasshoppers” by the same author and Simon Morris, “Attention needs to be given to the spatial distribution of diversity within [S. australis complex]…Further morphological study may support the splitting of one or more of the groups indicated by phylogenetic analysis of mtDNA sequences.”
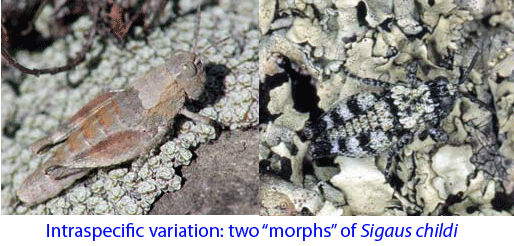 Regarding point 2, genetic methods including DNA barcoding may not resolve very young species. For Sigaus sp. grasshoppers, nuclear sequence data will help sort out whether these are young species or the products of recent hybridization or introgression.
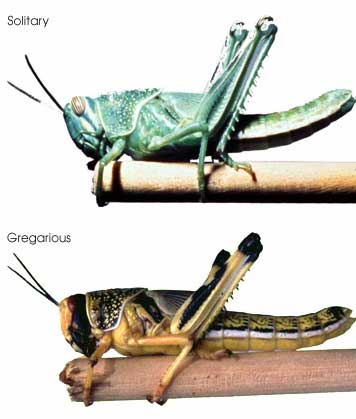 In this regard, I am struck by the apparent variability in some grasshopper species, as in the color morphs of S. childi shown above. It brings to my mind the extraordinary transformations from solitary grasshoppers to swarming locusts (these are members of the same Acrididae family as Sigaus). Perhaps grasshopper genetics include analogous latent “switches” that might enable relatively rapid evolutionary transformations.
.
.
.
.
.
.
.
.
.
.
.
.
.
.
.
.
.
.
.
.
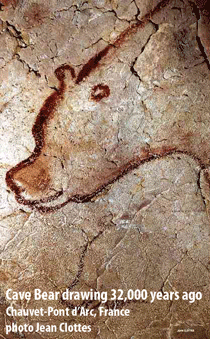 In another seeming step towards Jurassic Park, two groups of researchers recovered full-length mitochondrial DNA sequences from 22,000 to 44,000 year-old bones of extinct European and North American bears. Full-length mtDNA has been recovered from similarly ancient specimens, but in those cases frozen tissues preserved in permafrost were used. Both groups used specialized PCR protocols employing several hundred primer pairs designed to recover short fragments, rather than one of the newer sequencing technologies, demonstrating the continued power of DNA amplification.
 sister to Tremarctos ornatus (Spectacled bear). Of course it would be difficult to recover a full-length sequence–what about the 130 base pair “mini barcode” proposed for broad-scale biodiversity analysis? This is within the size range(ie < 180 bp) that Elalouf and colleagues report best for recovery of ancient DNA. Remarkably, A. simus mini-barcode submitted to BOLD ID engine gives NJ tree correctly showing T. ornatus as its sister species and U. spelaeus mini-barcode correctly picks out U. arctos and U. maritimus as most closely-related species.
 Trewick focused on Sigaus australis species complex, which includes the apparently widely-distributed S. australis, and 5 sympatric or parapatric species with much narrower ranges (S. childi, S. obelisci, S. homerensis, and 2 undescribed species). Within this complex he analyzed 160 individuals collected at 26 locations (mostly S. australis (136 individuals) and 1-13 individuals for the more restricted species). For mtDNA analysis, an approximately 600 bp region of 12-16S and about 500 bp of 3′ COI (ie not overlapping COI barcode region!) were examined.
 Regarding point 2, genetic methods including DNA barcoding may not resolve very young species. For Sigaus sp. grasshoppers, nuclear sequence data will help sort out whether these are young species or the products of recent hybridization or introgression.
  In this regard, I am struck by the apparent variability in some grasshopper species, as in the color morphs of S. childi shown above. It brings to my mind the extraordinary transformations from solitary grasshoppers to swarming locusts (these are members of the same Acrididae family as Sigaus). Perhaps grasshopper genetics include analogous latent “switches” that might enable relatively rapid evolutionary transformations.
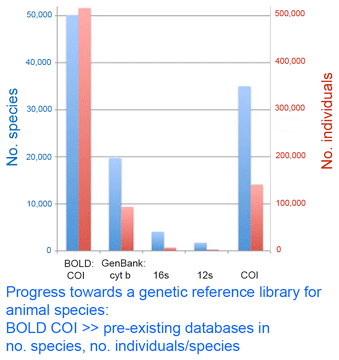 The DNA barcode initiative aims to establish a universal identification system for plant and animal species by analyzing a standardized genetic locus (or for plants, a small set of loci). In addition to making analysis cheaper, standardizing on one or a few loci enables a diverse assemblage of researchers to work together to build an interoperative library.
 GPS devices for civilian use were first introduced 1982. The TI 4100 from Texas Instrument Company cost $150,000, weighed 50 lbs, and had heavy demand from land surveyors (
 The GPS history suggests viewing the current drive to establish a DNA reference library for millions of plant and animal species as infrastructure investment, analogous to the GPS satellite system. It is relatively expensive but once established will enable diverse new applications for society and science. What uses will improvements in DNA sequencing married to a robust DNA barcode library bring?
 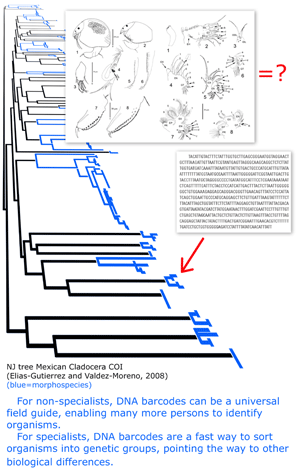 In
In 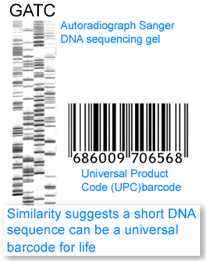 Although new methods of sequencing and visualization have displaced the one that produced autoradiographs that show blurry gray stripes of a gel indicating presence or absence of particular bits of DNA, the analogy between the commercial barcode and the barcode of life may be traced to it. However, the power of the analogy comes from other similarities: large capacities to differentiate mind-boggling diversity, ability of digits to distinguish unambiguously, rapidity and economy of identification, ability of parts of the code to distinguish categories, and avoidance of a Tower of Babel by uniformity. We elaborate briefly.
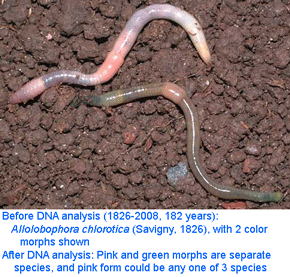
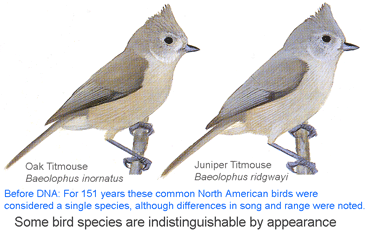 I conclude that genetics is equally essential for eukaryotic taxonomy as for microbiology. I believe there is no getting around the need to genetically reexamine most or all of the species named in the past 200 years to see if what we recognize as single and distinct species are really so. If there can be cryptic species in large visible animals such as birds, and
  As of October 11, 2008 researchers have deposited 14,594 DNA barcodes in BOLD representing 2,586 avian species, 26% of world’s 9,933 birds. You can browse taxonomic coverage to date at
 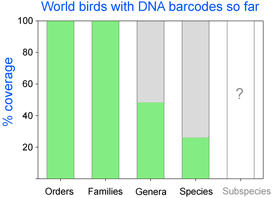 How far along are researchers toward mapping COI barcode resolution of avian species? Birds are of particular interest because species limits are generally well-defined, supported by a wealth of morphologic, ecological, behavioral, and other genetic data. Looked at regionally, there is good coverage in northern North America, parts of Central and South America, western Europe, Korea, and New Zealand, so it should be possible to see how well COI barcodes distinguish among local species in these areas. Published studies so far show >95% resolution of named species and have identified genetically divergent clusters which may represent unrecognized cryptic or “hidden” species (
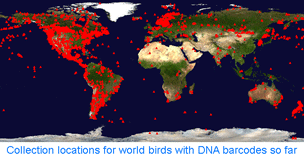 Looked at globally, there is 100% coverage of 104 polytypic genera (having 2 or more species) representing 324 birds, so this should include the sister species and/or “nearest neighbors” for these, plus there are 853 monotypic genera (having only 1 species) in world birds, which are likely or known to be genetically divergent from birds in other genera. In addition, there are likely many other sister species or “nearest neighbors” within the remaining 1,982 birds with DNA barcodes so far (for example, BOLD includes 28 of 29 Dendroica sp wood warblers). It would be interesting to look at the nearest neighbor differences within the global data set. To my knowledge, comparisons among regions with COI barcode data have been not been published. My impression based on other avian genetic work is that named taxa in different biogeographic regions are genetically distinct, plus there are many unrecognized genetic divisions within species that range across biogeographic regions. I look forward to trans-regional and global comparisons!
 In
In  In
In