Neotropical explorers map avian diversity

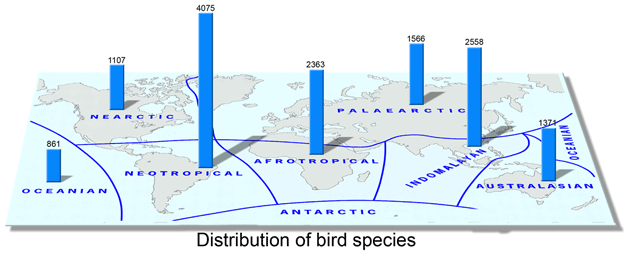
There are more bird species in the Neotropics than in any other biogeographic region (including many more as yet undescribed; see for example application of COI barcoding to cryptic diversity in Brazilian tyrant flycatchers Chaves et al Nov 2008 Mol Ecol Resources). Mapping this diversity with COI is both exciting and perhaps challenging. Some have wondered if the plethora of neotropical avian species might overwhelm the ability of a single mtDNA gene to resolve differences among species.

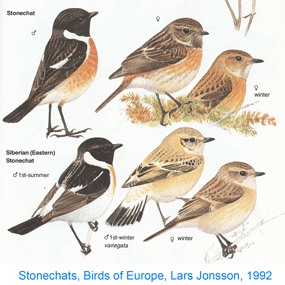
There is apparently no need to worry. In February 2009 PLoS ONE researchers from University of Guelph, Canada, and Museo Argentino de Ciencias Naturales, Argentina report on 1,594 COI barcode sequences from 500 species, which represents 51% of of Argentine birds. Kerr and colleagues find COI barcodes work here as elsewhere, ie most species show deep divergences from their “nearest neighbor” in the data set. Overall, 491 of 500 (98%) of species had distinct barcode(s). Of the nine species not resolved, six were Sporophila spp (common name “seedeaters”); these comprised a single cluster of shared barcodes. Although morphologically distinct, I wonder if these might be analogous to North America juncos, which have regional plumage variants without genetic differentiation. As recently as 1973 they were considered to be a complex of 5 species; these are now lumped into one, Junco hyemalis.  

21 Argentine birds showed 2 or more distinct clusters (maximum intraspecific distance 1.52-5.41%). Do these represent different species? The authors genuflect to taxonomic tradition, ie “levels of genetic differentiation do not dictate taxonomic status” and gently suggest “barcode analysis illuminates those taxa and those segments of their ranges where further research is justified.”

I am impressed with the ease of analyzing combined data sets; in this case the scientists merged their Neotropical COI data with that of Nearctic birds (2,615 sequences/659 species). With a click of a button so to speak, Kerr and colleagues were able to determine that 10 of 42 (24%) species shared between the 2 regions showed large genetic differences, which common sense tells us indicate long-standing reproductive isolation (ie species status).  Most of these North-South divergences were in plain-colored passerines or nocturnal species, and often with disjunct ranges consisting of a northern migratory and southern resident population. The former suggests why these might have been overlooked and the latter suggests how they arose. This work highlights how merging data sets amplifies the power of regional studies–one of the benefits of standardizing on a defined barcode mtDNA region, one that will grow with increasing size of barcode library.

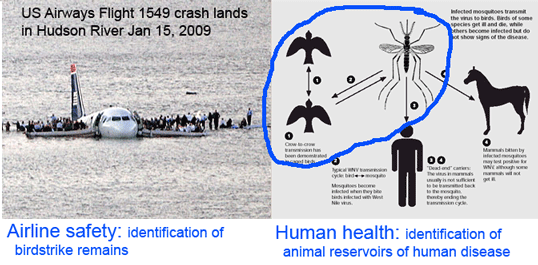
In addition to enabling rapid and low-cost mapping of avian diversity including discovery of divergent lineages, which in most cases are indicators of new species, avian DNA barcoding establishes a genetic reference library with practical benefits to society, as in examples illustrated above. The DNA barcoding effort including All Birds Barcoding Initiative (ABBI) draws interest from many persons who live outside of museum walls.

DNA barcoding re-tested in Madagascar butterflies

In addition to their regular classes, most US high school students take and re-take a multitude of national standardized tests (and tests to practice for the tests) starting with the PSAT in 10th grade, then various SAT subject tests, AP tests, and the SAT or ACT achievement test (sometimes taken two or more times). Fortunately for students and their parents, this process usually comes to an end once they actually apply to college or university. For DNA barcoding, after six years and 500,000 sequences from 50,000 species, it seems it is still in midst of exams! 

In Nov 2008 Mol Phylogenet Evol, in “a test of the DNA barcoding approach,” researchers from University of New Orleans, USA; University of Antioquia, Colombia; and Natural History Museum, London; analyze barcode region COI sequences in a “hyperdiverse” genus (includes about 70 species) of butterflies endemic to Madagascar. They collected 109 specimens of 6 Heteropsis species, including 2 “undescribed species” and 1 species from a related genus. To confuse biological databases, Heteropsis is also a genus of flowering plant in family Aracaea. 

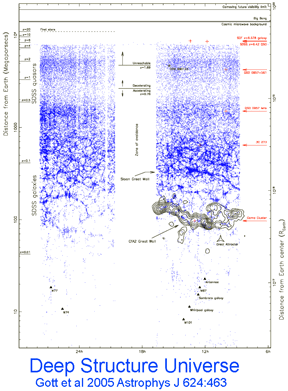
As an aside, and I know this is a commonplace observation, there needs to be a way of mapping biodiversity that gets around having “described” and “undescribed” species. For one, many of the “undescribed” species that are the focus of biological study, including perhaps those in this paper, will never be formally described. As an analogy of an alternate approach, in astronomical science, a first step is creating detailed sky maps based on particular wavelengths of the electromagnetic spectrum. Such sky maps are “just data,” in this case recordings of radiation-emitting stellar objects. Then, based on study, astronomers label certain objects as quasars, for example. Of course, this “annotation” does not change the underlying data, and astronomers may later change the labels on some objects based on new information or new understanding.

Following the suggestions of others, I believe some sort of sequence-based map of species-level biodiversity is a necessary way forward. Like the sky map, sequences are “just data” (the “just data” also include collection location, date, voucher specimen, and photographs).  Taxonomists would then annotate the “data map” with taxonomic interpretations, assigning species names to particular clusters for example. Species-level taxonomic revisions or conflicting taxonomies are easily accomodated–this simply involves re-labeling a cluster in the former case, or adding alternate names in the latter case. This sequence data map approach explicitly recognizes that species names are hypotheses. 

The present system is the inverse of the above: a taxonomic map (ie species names) is “annotated” with sequences. Under this system, there is no easy way to register biological information about organisms unless they have been already formally described as a species. Without a name or description of diagnostic characters, how does the next researcher know if they are studying the same “undescribed” species unless they examine the original specimens (in this case, stored in Natural History Museum, London)? On the other hand, one could easily report biological findings (eg coloration, larval morphology, food plants) associated with a specimen and its barcode sequence. 

Going back to the astronomical analogy, barcode-region COI is the appropriate “wavelength” for the species-level map of animals. This map will not be perfect. Just as gravitational lensing distorts the positions of some stellar objects, and others are obscured by intergalactic dust, the COI wavelength map will mislead in some areas and be obscured in others, not enabling one to “see” the existence of certain species–e.g. corals with slow mtDNA sequence evolution.

Would this be “DNA taxonomy?” No. First, community standards would ensure that the sequence map is not the arbiter of species status. Just as there are morphologically cryptic species and others that are phenotypically diverse, what we recognize as distinct species might be “hidden” within a single sequence cluster, and on the other hand, some named species might comprise a set of more distantly related sequences. Thus there would not be a fixed numerical determinant (eg distance, characters) of what constitutes a species cluster. Second, the COI-wavelength map would not establish higher-level relationships. Of course the shape and distinctness (or lack thereof) of clusters will change as new sequence data becomes available, as well as the taxonomic annotation, but that is the nature of biological diversity–we just don’t know everything yet! 

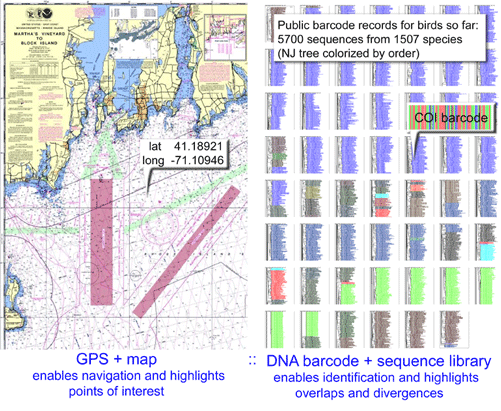
Why bother? Taking a sequence-mapping approach, I believe one can accelerate exploration of biodiversity and harness efforts of those outside the taxonomic priesthood. For example, one can predict much of the next ten years of species- and genus-level revisions in avian taxonomy simply on the basis of currently available COI and other mitochondrial DNA data (sequence plus specimen data). I suggest to collate and disseminate the available data in a publicly accessible form. This might even help harness “citizen science” by encouraging submission of birds that died of natural causes, or feathers naturally shed or collected in banding/ringing operations (or barcodes of feathers for those with resources and access to sequencing facilities), along with date, gps coordinates, and digital photo. If so, then legions of devoted birders could help with creating the genetic map, as they are already doing with observational records (see eBird). Because collecting sequence (and specimen-associated data) that establish the map is separate from the taxonomic process of “naming” this would not devolve into taxonomic chaos, rather, like astronomy amateurs, citizens could contribute to the observational database on which the sequence map is built. One utility that is needed is an easy graphical interface that collates available mtDNA on birds for example and highlights areas where information is missing either taxonomically or geographically; this sort of display would likely be of interest both to scientists and scientifically-minded amateurs.

Finally, going further out on this limb, depending on community standards, there might be agreement to consider a sufficiently divergent cluster a new species, until proven otherwise by more biological data. So a specimen plus a sequence could potentially be a “described species.” I prefer keeping the everyday designation of “species” rather than for example molecular operational taxonomic units (MOTU) or (evolutionarily significant units (ESU), but that is a discussion for another time!

Back to the paper. Linares and colleagues found that all 6 Heteropsis spp (including the 2 “undescribed” species) were evolutionarily distinct (ie formed reciprocally monophyletic lineages in Maximum Likelihood and Bayesian analysis of barcode-region COI), and that the mtDNA phylogeny was corroborated by nuclear DNA sequences. Given the large distances among and small within species, a neighbor-joining tree would likely have shown the same species clusters (although not necessarily the same branching pattern; the COI sequences do not appear to be public on GenBank yet, so I could not try NJ analysis). Unsurprisingly, one species pair showed less than “10X distance” (ie interspecies distance less than 10 times the average intra-species distance). Most barcode studies that include multiple congeneric species have sister species pairs that fall below this threshold. The results were initially confounded by amplification of Wolbachia (an intracellular parasitic bacteria of insects) DNA, leading them to design alternate primers. Wolbachia is unevenly distributed in tissues and often concentrated in reproductive tract, so perhaps the use of abdominal segments for DNA extraction is part of the reason this was a problem.

Distances and characters

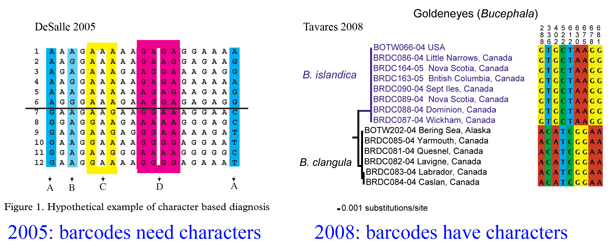
Almost 4 years ago, in October 2005 Philos Trans R Soc Lond B Biol Sci researchers from American Museum of Natural History examined the then nascent DNA barcoding effort, looking at what methods were best for integrating the growing pool of DNA barcode data into systematics, the science of classifying organisms based on evolutionary history. Using real-world examples, authors DeSalle, Egan, and Siddall argued strongly for “characters” and against “distances” when using DNA barcode data to identify species, ie assigning specimens to known species and discovering new species. Of course, sequence data was already the backbone of modern systematics but it had primarily been applied to reconstructing evolutionary branching patterns (eg what pattern of divergences led to the various orders of birds) and less so to the definition of species. For example, most phylogenetic work included single examplars of each species.  Analyzing sequence differences among and within closely-related species was more the domain of phylogeography which generally did not explicitly aim to define new species. 

Here a brief aside. In analyzing sequences, “characters” refer to specific nucleotides (eg guanine (G) at position 138 in COI gene) and “distances” refer to per cent differences between sequences. So right away you can see that “characters” are intrinsic to the specimen’s DNA, whereas distances are defined only in relation to sequences from other specimens. Systematists like characters; for one, this enables integrating sequence and morphologic data. Characters are the grist for the computational workhorses of systematics, Parsimony and Maximum Likelihood. Meanwhile, beginning with the first paper published in 2003, distances displayed in neighbor-joining trees have been the usual heuristic approach for analyzing DNA barcode differences among and within species. A crucial advantage of neighbor-joining distance analysis is speed. Creating a NJ distance tree from 1000 648 bp barcode sequences might take a minute on a desktop computer whereas Maximum Likelihood reconstruction might take several weeks. Unlike reconstructing the Tree of Life, DNA barcoding is a recurrent exercise that repeatedly involves submitting new data from multiple known and unknown specimens, so a fast analytic method is essential. 
Four years later, where are we? Most DNA barcoding analyses continue to rely on NJ distance trees, and this approach has proven to be a durable heuristic, enabling one to distinguish among most species analyzed so far. Regarding species discovery, NJ distance trees demonstrate continued value as a first step in flagging divergent lineages that may represent new species. Here there is something of a roadblock, in that defining new species is a human judgement, sort of like a medical diagnosis, while sequences differences are like medical laboratory results. Community standards do not accept divergent mtDNA sequences as sufficient evidence to define a new species, although at the same time it is generally acknowledged that such sequences do indicate it is new, albeit one that hasn’t been officially defined yet. For example, in Nov 2008 news item researchers confidently assert “DNA tests identify new dolphin species,” (based on published article in Nov 2008 Mol Phylogenet Evol), yet include statement “it is awaiting a scientific name after a formal description.” I expect the researchers knew they had a new species with the first mtDNA sequence from a single individual! For DNA barcoding effort it should not be necessary to wait for final taxonomic decisions; we can proceed with publicly-disseminating a broad-range, fine-scale map of biodiversity, which can then be annotated with taxonomic information as it arrives. Like sky surveys and the human genome project, we should aim to make the “barcode biodiversity map” public as quickly as possible.  

On the other side, it is now a commonplace observation that a 10X threshold (10 times the average intraspecific variation) is NOT a universal dividing line between intra- and inter-specific variation. To get technical, this was originally proposed as a screen for new species, but it has been taken as a dividing line between intra- and inter-specific distances, which it certainly is not; in the original 2004 paper (I am co-author) there are many sister species separated by distances less than the threshold. It has been a useful rhetorical target so maybe this issue won’t disappear just yet.

On the character front, there are more publications defining discriminatory DNA barcodes characters (eg Tavares and Baker 9 march 2008 BMC Evol Biol). It seems obvious to me that if, as is usually the case, sister species show large differences among and small differences within, then there must be diagnostic characters that distinguish them. The process of “translating” distances into characters should perhaps be a standard practice for nearest neighbor taxa in NJ trees; this would certainly give confidence (or not) as to whether one can reliably distinguish those species with less than 1% sequence difference. There is exciting development in character-based software tools (eg Ahrens et al 2007, Rosenberg 2007, Abdo and Golding 2007Munch et al 2008) aimed at distinguishing the leaves (ie species) in addition to those already available for reconstructing the branches on the Tree of Life. I look forward to one that is friendly for non-specialists and works speedily on desktops!

“A reliable, consistent, and democratic tool for species discrimination”

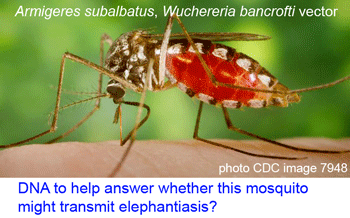
Human filariasis, caused by various species of insect-transmitted parasitic nematodes, affects more than 120 million persons in Africa, South America, and Southeast Asia, and includes elephantiasis and river blindness. In 7 january 2009 Frontiers Zool, 10 researchers from 5 institutions in Italy, France, Japan, and Venezuela apply DNA barcoding and traditional morphologic taxonomy to identification of parasitic filarioid worms. According to the authors, a molecular tool for identification of filiaria is a “desirable goal for many reasons” including “parasites conferred to diagnostic laboratories are often of poor quality due to the difficult[y] of sampling adults and undamaged organisms,” as a “method for the identification of filarioid nematodes in vectors,” and “nematode biodiversity is still highly underestimated both at the morphological and molecular level.”
Ferri and colleagues analyze diagnostic utility of 12S and barcode-region COI sequences and morphologic examination by experts to an assemblage of data from 165 individual specimens (73 newly analyzed for this study) representing about 60 species. Their data set encompasses most of the important human and animal filarioid parasites, including Wuchereria bancrofti and Brugia malayi, agents of human tropical elephantiasis, Loa loa (human ocular filariasis), Onchocerca volvulus (human river blindness), and Dirofilaria immitis (dog and cat heartworm), plus specimens recovered from wild animals ranging from bats to toads.

The authors applied a medical test approach to the sequence data, looking at which distance cutoffs produced “minimum cumulative error,” in which they include type I false positive (failure to assign to correct species, analogous to oversplitting) and type II false negative (failure to distinguish between species; analogous to lumping). I find their approach refreshing in that it recognizes the uncertainty inherent in any identification method. Even “gold standard” tests have error rates. Just as a medical laboratory considers a range of factors when adopting a new test method–cost, speed, sensitivity, accuracy, replicability, and training requirements, for example, we might usefully look at methods for species identification, including traditional morphologic techniques, in a similar way. In taking such an approach, we can recognize there are often marked differences between the methods we use to detect something and the methods used to define it.

As a medical testing example, automated systems for rapid detection of bacteria in blood cultures rely on monitoring pressure changes in headspace gas in liquid culture bottles, as growing bacteria consume or produce gases. At the same time we do not define bacteria as “organisms that produce pressure changes in laboratory culture bottles,” for example. Similarly, percent differences between nucleotide sequences of the test specimen and those in a reference library might be a rapid way to “detect” a species, but this does not mean these are a defining characteristic of a species. We recognize species conceptually as independent evolutionary lineages, and practically on the basis of discriminatory characters (eg morphologic, behavioral, or nucleotide substitutions at specific sites). In the day-to-day work of specimen identification and detection of new species however, sequence distances may work just fine as diagnostic signatures. 

Back to the article. Ferri and colleagues report COI worked better than 12S as a diagnostic, primarily due to difficulty in finding a consistent algorithm for aligning 12S sequences. With COI, the minimum cumulative error was 0.62% at a K2P distance threshold of 4.8%. The errors were due to low interspecific distances between 2 congeneric pairs [Onchocerca volvulus (human host) and O. ochengi (cattle); Cercopithifilaria longa (Japanese serow, a goat-antelope) and C. bulboidea (Sika deer); might some of the morphologic differences between these species pairs represent phenotypic changes induced by the different hosts?]. More sampling within species will help determine if it is possible to molecularly discriminate among these species using a character- rather than distance-based method.

The authors call for an integrated taxonomic approach to solve discrepancies between morphologic and molecular methods, and conclude “we propose DNA barcoding as a reliable, consistent, and democratic tool for species discrimination in routine identification of parasitic nematodes.”

DNA speeds discovery of overlooked species

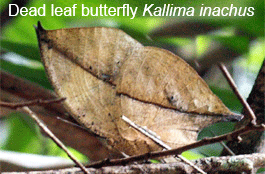
Just as new telescopes reveal previously hidden details of the universe, genetic surveys regularly reveal previously hidden (aka cryptic) species. Of course these species are cryptic only in the sense that morphological analysis is not the right tool to “see” them with. To my ear the word “cryptic” suggests camouflaged organisms that blend in with the environment, such as the Dead leaf butterfly Kallima inachus. Unlike camouflage, which is presumably a protection adaption, it is my impression there is nothing biologically special about morphologic crypsis except for the difficulty we have in recognizing it; that is, what we call cryptic species exhibit the same sorts of distinct ecological and behavioral adaptations found in those whose differences are more visible to the human eye.
To restate the above, when multiple individuals are examined for gene(s) that reflect species-level differences (this is the essence of DNA barcoding), many animal and at least some plant species are discovered to be comprised of two or more genetic clusters, each carrying diagnostic nucleotide substitutions. When appropriate analytic tools are applied, these within-species clusters are often found to be reciprocally monophyletic lineages that have been reproductively isolated for hundreds of thousands to millions of years. In studies where the painstaking work of natural history observation has been carried out, these genetic clusters usually show ecological and behavioral differences and sometimes previously overlooked morphological distinctions, consistent with species-level status. In short, DNA analysis speeds discovery of new species. In many cases, it reveals species that would otherwise probably remain unrecognized indefinitely.

The premise of DNA barcoding is that a very short segment (ie for animals 648 bp COI barcode region) is usually sufficient to screen for new species and to assign specimens to known species. Of course, more sequencing is always of interest, but the added discriminatory value for detecting species-level differences is small compared to the added cost. Moving backwards in evolutionary time, a neighbor joining tree constructed with 648 bp barcode sequences often groups genera and families correctly; however it generally does not contain enough information to establish branching order or uncover deeper-level associations that are the heart of phylogenetic study, so there is plenty for systematists to do.

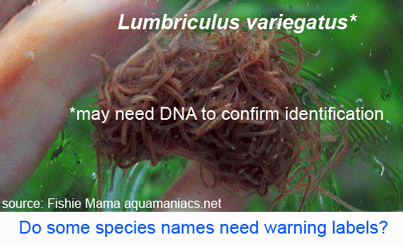
Now for some data. In 25 december 2008 Mol Phylo Evol researchers from University of Gothenburg and University of Florida report on Lumbriculus variegatus Muller, 1774, a segmented freshwater worm widely distributed in Europe and North America, commonly used as a model laboratory organism, in environmental toxicology, and sold as pet food for fish and amphibians under name “blackworm.” Part of the laboratory interest in L. variegatus lies in its remarkable ability to re-generate after fragmentation; any of the approximately 200 segments can re-form a complete adult worm; most populations reproduce through auto-fragmentation. Given that L. variegatus is a common, widely-distributed organism described over 200 years ago and is regularly used in scientific study, one might not expect any taxonomic surprises.

Gustafsson and colleagues were initially studying a neuropeptide gene FMRFamide using L. variegatus purchased from a commercial supplier in California, with puzzling results suggesting polyploidy with multiple gene copies.  This lead them to further characterize approximately 50 individuals collected at multiple sites in Europe and North America.  Sequencing of COI, 16S, and ITS sorted the specimens into 2 phylogenetically distinct (maximum parsimony and Bayesian analysis) clades with 17% mean difference in COI, with the same genetic structure in mitochondrial COI/16S as nuclear ITS. Both clades were found in North America and Europe, sometimes at the same site. The authors conclude “it thus seems reasonable to regard these two main lineages within the L. variegatus complex as different species, regardless of which species concept one adheres to.”  Of course, it may be they have rediscovered a named species; they caution that more study needs to be done including sampling the other named species in genus Lumbriculus (see EOL page). 

DNA barcoding is an efficient instrument for revealing species-level differences. Routine application of DNA barcoding can enhance quality control in work with model organisms, cell lines, and collected specimens, and the long-term value of species descriptions.

Plant specialists work towards standardization

In 26 November 2008 Mol Ecol researchers from University of British Columbia report on a meeting of 1200 plant specialists, entitled “Botany without Borders”, held on the campus in July 2008, which brought together the annual meetings of Botanical Society of America, the Canadian Botanical Association/L’Association Botanique du Canada, American Fern Society, and American Society of Plant Taxonomists. According to authors Kane and Cronk, DNA barcoding was a recurring theme of presentations and posters.

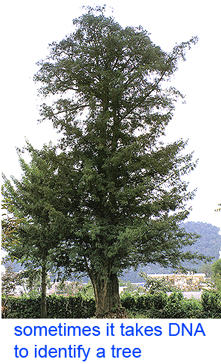
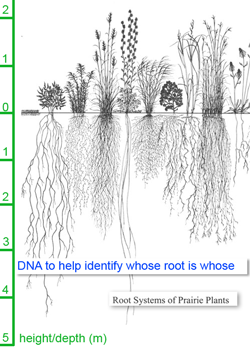
Plants continue to challenge a standardized approach to species identification using short DNA sequences from a uniform location on the genome, aka DNA barcoding. Genetic divergences among lineages make it difficult to design broad-range primers that amplify a desired target region across the diversity of plants and, at the same time, sequence differences among closely-related plant species are generally an order of magnitude fewer than those among animals, with the result that short sequences are often inadequate to assign specimens to species. Looking beyond these difficulties, the potential societal and scientific value of a standardized genetic identification method for plants is enormous. For one example cited in the meeting report, wild nutmeg trees of the genus Compsoneura can be identified by examining the tiny flowers on male trees, but trees are usually not in flower and female trees always lack these distinguishing characters. (It is remarkable that something as large as a tree can sometimes not be identified even by specialists!) In one study (Newmaster, Mol Ecol Notes 2007), a DNA barcoding approach using 2 short plastid sequences enabled identification of 94.7% of samples to species, compared to 40% using field characters. A standardized DNA-based approach should be a big boost to soil science by enabling the underground parts of plants, ie roots, to be readily named (Ridgway, BMC Ecol 2003). 

The authors conclude “DNA barcoding in plants is clearly here to stay and there is consequently an urgent need to rise to the scientific challenges it presents.” Some of those scientific challenges are explored in November 2008 Taxon by researchers from National Museum of Natural History, Washington, D.C., and National Center for Biotechnology Information, Bethesda, Maryland. Erickson and colleagues lay out a set of standard approaches to quantifying DNA barcoding success in plants.

The authors state “PCR amplification must be the primary criterion for selecting a DNA barcode,” i.e. the chosen region should have the best rate of successful amplification across the diversity of plants. They suggest 90% or greater rate of recovery as a guideline. Second, they suggest each or any additional markers should improve PCR success by reducing the number of non-recovered PCRs by 50% and improve identification by at least 10%, using a parameter they call “probability of correct identification (PCI),” which is defined pretty much as it sounds. Applying this statistic to existing plant studies indicates the best results are with 2 plastid barcodes in which case PCI approaches an average of 90%, which of course includes much lower rates among some groups. Nonetheless, in local flora successful identification to species level may often approach 100%, because closely-related congeneric species are not present. The effort to establish a standardized genetic library of DNA barcodes for world’s plants is moving ahead.

mtDNA recovery from old bones hints at DNA durability, ubiquity

In another seeming step towards Jurassic Park, two groups of researchers recovered full-length mitochondrial DNA sequences from 22,000 to 44,000 year-old bones of extinct European and North American bears. Full-length mtDNA has been recovered from similarly ancient specimens, but in those cases frozen tissues preserved in permafrost were used. Both groups used specialized PCR protocols employing several hundred primer pairs designed to recover short fragments, rather than one of the newer sequencing technologies, demonstrating the continued power of DNA amplification.

In 28 july 2008 BMC Evol Biol Proc a group of 18 researchers led by Johannes Krause, Max Planck Institute, Germany, recovered full-length mtDNA from a 44,000 year old Ursus spelaeus (European cave bear) bone found in an Austrian cave, and from a 22,000 year-old skull of Arcdotus simus (American giant short-faced bear) from Eldorado Creek, Canada. In 11 november 2008 Proc Natl Acad Sci USA, 14 researchers led by Jean-Marc Elalouf, Institute de Biologie et Technologies de Saclay, France, report full-length U. spelaeus mitochondrial genome from a 32,000 year-old bone from the legendary Chauvet-Pont d’Arc Cave, home to the oldest rock art pictures ever found.  

If we found a bone from one of these extinct bears in our backyard, could it be identified by its COI barcode? Submitting the long-ago bears’ COI barcode region sequences (positions 48 to 705) to BOLD ID engine flags both species as not in database, with a NJ tree similar to that created by full-length genomes (ie the extinct U. spelaeus is sister to U. arctos (Brown bear) and U. maritimus (Polar bear), and extinct Arcdotus simus is sister to Tremarctos ornatus (Spectacled bear). Of course it would be difficult to recover a full-length sequence–what about the 130 base pair “mini barcode” proposed for broad-scale biodiversity analysis? This is within the size range(ie < 180 bp) that Elalouf and colleagues report best for recovery of ancient DNA. Remarkably, A. simus mini-barcode submitted to BOLD ID engine gives NJ tree correctly showing T. ornatus as its sister species and U. spelaeus mini-barcode correctly picks out U. arctos and U. maritimus as most closely-related species.

Recovering DNA from ancient bones leads to CSI-like thoughts of where else we might usefully recover DNA for species identification. DNA has been recovered from naturally shed feathers, flakes of seal skin at breathing holes in polar ice, hair and saliva left by predators of sheep, bird faeces, and, turning to world of commerce, ancient and modern processed leather goods (Long 2007). I look forward to analyses of the many processed foods with what is currently an unverifiable “list of ingredients.”

Some taxonomists worry when DNA barcodes highlight unfinished taxonomy

In Cladistics 25 Sept 2007, Steven Trewick from Massey University, New Zealand applies mtDNA to help sort out endemic flightless grasshoppers in genus Sigaus, which are restricted to mountainous alpine habitat on New Zealand’s South Island. Here we might expect a complex pattern of diversification. These are small, terrestrial, flightless, presumably non-vagile (ie don’t travel far) animals in a deeply fragmented habitat. Their habitat lies in New Zealand’s central mountains, the Southern Alps, formed by a geologically recent uplift 5 to 2 million years ago. Like other organisms restricted to elevated mountain terrain, they are effectively living on “sky islands.” In this setting, we might expect a plethora of relatively young species with very narrow ranges, with difficulty determining which forms merit species-level status.

Trewick focused on Sigaus australis species complex, which includes the apparently widely-distributed S. australis, and 5 sympatric or parapatric species with much narrower ranges (S. childi, S. obelisci, S. homerensis, and 2 undescribed species). Within this complex he analyzed 160 individuals collected at 26 locations (mostly S. australis (136 individuals) and 1-13 individuals for the more restricted species). For mtDNA analysis, an approximately 600 bp region of 12-16S and about 500 bp of 3′ COI (ie not overlapping COI barcode region!) were examined.

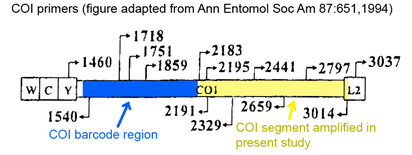
Although the 3′ COI fragment analyzed in this grasshopper paper has been utilized in a number of invertebrate mtDNA studies, it is just one of many mtDNA targets that give essentially equivalent phylogenetic information (eg, in this study COI and 12S-16S gave same results). The hodgepodge of mtDNA regions analyzed in species-level animal work means that most data cannot be compared or combined. In my view, ALL animal mtDNA studies should include the standard COI barcode (defined relative to the mouse mitochondrial genome as the 648 bp region that starts at position 58 and stops at position 705; https://barcoding.si.edu/PDF/DWG_data_standards-Final.pdf), plus of course any other regions of interest. Standardization on the barcode region ensures long-term usefulness, both as a reference for identification and for comparisons across the diversity of animals. In addition to a defined genic target region, DNA barcode standards have other advantages, including that records are linked to voucher specimens and list primer sequences and include bidirectional trace files and quality scores.

In the present study single-strand conformation polymorphism (SSCP) of a 380 bp 12S fragment was used to screen for differences, and then individuals with different SSCP results were subjected to sequencing, so in the end just 40 of 160 Sigaus sp grasshoppers were sequenced for COI. This also means that there is voucher data in GenBank for just these 40 individuals. Continuing down the DNA barcode standard checklist, primer sequences are not easily accessible (there is a published reference for the primers, but access requires article purchase), it is not stated if bidirectional sequencing was done, and trace files and quality scores are not provided. I hope that future studies on New Zealand orthopterans will include the 5′ COI region and the remaining information, as I believe this will increase their long-term utility both as an identification reference and for comparisons across diversity of animal life (>520,00K individuals representing >50,000 species in BOLD so far). There is a big opportunity for grasshopper specialists to contribute–the BOLD taxonomy browser contains records for only 191 of the approximately 10,000 species in family Acrididae! 

To skip to the conclusion, the sequence analysis gave an entirely different picture than existing morphologic taxonomy. 12S-16S and COI gave identical results: four well-supported geographically-structured clades within the widespread S. australis morphospecies, 3 of which had partly overlapping ranges. The 5 described or proposed species in the complex nested within these clusters, with shared or similar mtDNA haplotypes to S. australis from the same region.

The author concludes that the results show that “haplotype sharing and paraphyly essentially invalidate the DNA barcoding approach.” I disagree. To my reading, the most parsimonious explanation is that 1) morphologic taxonomy has overlooked deeply divergent genetic lineages, which likely represent different species, in S. australis for over 100 years, and 2) a number of morphologically distinctive forms have arisen very recently.

In support of the first point I note that in April 2008 report “Diversity and taxonomic status of some New Zealand grasshoppers” by the same author and Simon Morris, “Attention needs to be given to the spatial distribution of diversity within [S. australis complex]…Further morphological study may support the splitting of one or more of the groups indicated by phylogenetic analysis of mtDNA sequences.” 

Regarding point 2, genetic methods including DNA barcoding may not resolve very young species. For Sigaus sp. grasshoppers, nuclear sequence data will help sort out whether these are young species or the products of recent hybridization or introgression. 

In this regard, I am struck by the apparent variability in some grasshopper species, as in the color morphs of S. childi shown above. It brings to my mind the extraordinary transformations from solitary grasshoppers to swarming locusts (these are members of the same Acrididae family as Sigaus). Perhaps grasshopper genetics include analogous latent “switches” that might enable relatively rapid evolutionary transformations.
.
.
.
.
.
.
.
.
.
.
.
.
.
.
.
.
.
.
.
.

Growing DNA barcode database leaps past 50,000 species

The DNA barcode initiative aims to establish a universal identification system for plant and animal species by analyzing a standardized genetic locus (or for plants, a small set of loci). In addition to making analysis cheaper, standardizing on one or a few loci enables a diverse assemblage of researchers to work together to build an interoperative library.

If there were no Human Genome Project, researchers working gene by gene might eventually have decoded the human genome sometime during this century, albeit at much slower pace using more expensive and less accurate technology. For a genetic library of biodiversity, a concerted effort is essential. The various taxon-specific genetic initiatives, which are typically aimed at reconstructing deep evolutionary history, are too limited in scope (ie number of species and individuals per species analyzed) and too expensive in terms of cost per species to completely catalog animal and plant life. In addition, because different groups analyze different gene regions, it is impossible to stitch together the results into single database, for instance one that could be used to identify an unknown specimen without knowing beforehand what group it belongs to. The DNA barcoding initiative offers the necessary framework for constructing a genetic reference database for species. In addition as a large-scale project it should help drive technological improvements analogous to those spawned by the Human Genome Project which enabled its completion for a fraction of the originally projected cost. 

As of today, researchers have deposited 516,134 barcode records from 50,138 species in Barcode of Life Database (BOLD) www.barcodinglife.org. According to my analysis of GenBank shown in figure, this puts COI BOLD records far above the totals for any other single gene for animals. Thus five years of a concerted, standardized approach has leapt ahead of 30 years of incremental analysis. If the proof is in the pudding, this to me is a pudding that proves the value of the DNA barcoding initiative. Comparison of the totals indicates that most BOLD COI records are not yet in GenBank, although some aspects are visible through ID engine and Taxonomy Browser, so there is work to help move these fully into the public domain and at the same time ensure appropriate academic credit. Congratulations to all those moving this effort forward.