DNA helps reveal bat diets

What do carnivorous animals eat? Predation drives evolution and underlies ecology, yet except for a few easily observed species, it is surprisingly hard to determine what eats what. In June 2009 Mol Ecol, researchers from University of Guelph and University of Western Ontario, Canada, apply DNA testing to help solve diet of Eastern red bat Laiurus borealisL. borealis is the commonest tree-roosting bat in North America, ranging from Canada and United States east of the Rocky Mountains into Central and northern South America. Like other insectivorous bats, L. borealis uses echolocation to detect night-flying insects. Many moth species have evolved “ears” that detect the ultrasonic sounds emitted by bats and exhibit defensive behaviors in response to echolocation signals, making bats and moths an interesting study in predator-prey co-evolution. 

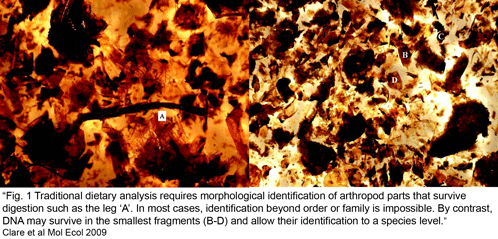
Clare and co-workers applied standardized DNA testing to insect parts in faecal samples collected from 56 mist-net trapped bats. Guano samples were frozen for up to 2 y then soaked in 95% ethanol for 12 h and examined with a dissecting microscope. Prey items including “legs, wings, antennae, eye cases, exoskeletal fragments, eggs” were isolated and stored separately in 96 well-plates. DNA extraction, amplification, and sequencing were performed using standard techniques and broad-range insect primers (LepF1/LepR1). COI sequences were compared to the 127,000 reference sequences of North American arthropods in BOLD database www.barcodinglife.org at the time of the study. Test sequences with >/=99% identity to reference sequence(s) and without equivalent similarity to other species in the database were given species-level identifications; those with less than 99% identity to reference sequence(s) were assigned to higher-level taxonomic categories. 

bat-dietsClare et al obtained sequence data from 89% of 896 arthropod fragments; 78% of these were identified to species or genus level (the remaining 22% showed sequence similarity to bacteria, fungi, or were unidentifiable or chimeric), with a total of 127 prey species identified (125 insects, mainly lepidoptera including a number of economically important pest species, and 2 spiders). The “molecular scatology” approach documented greater diversity in prey species than prior studies based on morphologic analysis. Most prey were identified only once, with an average of 3.5 species per guano sample. Surprisingly, “more than 60% [of recovered insects] appear to have ears capable of hearing the echolocation hunting calls of L. borealis.” The authors speculate the abundance of eared moths might reflect bats hunting around streetlights, as moths in such brightly-lit environments are thought to use daytime predator-avoidance strategies rather than nocturnal responses to echolocation. There was a notable absence of actiid and tortricid moths, given their local abundance, suggesting these moths may have alternative predator-avoidance strategies. 

This study documents the diversity of L. borealis prey, and hints at how much more we will learn from broad application of standardized DNA analysis to food chains, including such unexpected findings as possible disruptive effects of man-made lighting on local ecosystems.

Biggest tree so far

Phylogenetic tree-building programs are the workhorses of evolutionary analysis. Thus it might be surprising that, given there are at least 1.7 million named species of plants and animals, output trees with over 1000 taxa are exceptional. The primary reason is computational–the number of possible arrangements rises logarithmically with input taxa (eg for 1000 taxa, ~10^2500 possible trees; Tamura et al 2004), such that standard algorithms, even those that sample a fraction of “tree space,” are too slow. As a result, so far the Tree of Life has been constructed by concatenating multitudes of trees each built with relatively small numbers of taxa. This is unsatisfying and possibly unreliable.

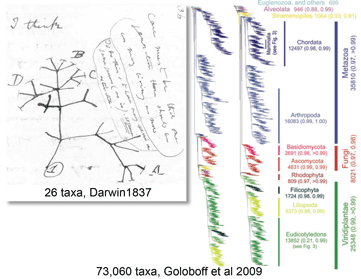
In May 2009 Cladistics researchers from Argentina and Sweden report on the largest tree to date–73,060 eukaryotic taxa, essentially everything Goloboff and colleagues could find in GenBank, ranging from algae and protozoans to flowering plants and vertebrates. In addition to size, there were several remarkable features. The tree was constructed from just 13 genes, each of which was sequenced for a subset of the total (750 to ~20,000 taxa), plus 604 morphologic characters that applied across most of the data set. Nearly all (92%) of the cells in the resulting data matrix (73,060 taxa x 9535 characters) were empty due to lack of data. Nonetheless, the parsimony analysis recovered most eukaryotic groups down to the level of order as monophyletic taxa. The analysis utilized TNT software previously developed (and made publicly available) by Goloboff and colleagues and took 2.5 months on 3 desktop computers (total 96 GB RAM, 16 x 3 Ghz processors). To manage the flow of data, nearly all steps were automated from extracting, labeling, and aligning GenBank sequences to analyzing monophyly of groups at various taxonomic levels.

Looking ahead, the authors see biggest challenges not in tree-building, but in alignment software and “that the sequence information required is simply non-existent, and the morphological information is scanty and fragmentary.” I know that a short segment of a single mitochondrial gene is considered insufficient for phylogeny, but it would be interesting to see what TNT could do with 40,777 COI sequences from 6,506 fish species (FishBOL), for example. I imagine that even TNT might have trouble analyzing all 603,002 COI sequences of the 57,159 species represented in BOLD (with many more to come). Phylogenetic trees are established as the goal of evolutionary analysis, but we may need alternate methods for analyzing differences and similarities in very large data sets.

Potatoes challenge taxonomists

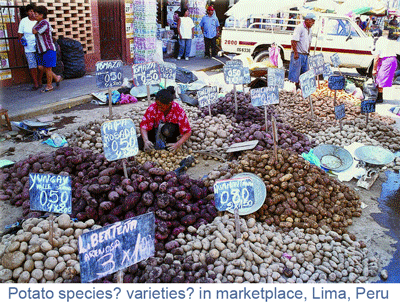
In 7 May 2009 Amer J Botany, David Spooner, scientist at USDA and University of Wisconsin, applies DNA barcoding to wild potatoes. According to the author, “the taxonomy of sect. Petota [section Petota is a subdivision within genus Solanum which comprises wild and domesticated potatoes] is complicated by interspecific hybridization, introgression, allopolyploidy, a mixture of sexual and asexual reproduction and possible recent species divergences.” As an aside, this one genus Solanum contains over 1500 species, including such seemingly diverse plants such as nightshades, horsenettles, tomatoes, and eggplants. While the most speciose bird genera, for example, have fewer than 100 species, Solanum is one of at least 50 plant genera with over 500 species (Pelser et al 2002 Am J Botany). Such large genera are unwieldy for constructing phylogenies and testing DNA-based identification methods–do they reflect biological differences in rates of speciation among genera, or a lack of phylogenetic knowledge? 

The above summary of Petota taxonomy is an understatement of the confusion regarding species boundaries in wild potatoes. For one, the apparent number of taxa seems to be shrinking rapidly: “an account of post-1990 taxonomic decisions of many workers published in Spooner and Salas (2006) reduced the 232 species of Hawkes (1990) to 190, but a taxonomic decision in my laboratory is converging on about 110 species.” Second, experts can be perplexed: “members of the complex are so similar that even experienced potato taxonomists…provided different identifications for identical collections numbers of the Solanum brevicaule complex in fully 38% of cases.” Third, genetic analysis (including multiple studies in the author’s laboratory) has been little help so far: “single- to low-copy nuclear restriction fragment length polymorphism (nRFLPs) and random amplified fragment length (RAPD) data…and amplified fragment length polymorphism (AFLP) data failed to clearly differentiate many wild species in the complex.” Independent work by researchers in the Netherlands (Jacobs et al 2008) similarly documents a challenging lack of concordance between genetics and taxonomy in Petota sp. Jacobs and colleagues performed AFLP analysis (this screens the entire nuclear genome) on 951 accessions representing 196 Petota species. Of the 196 taxa, multiple accessions of species clustered together in 58 cases, 38 formed multiple clusters, and 48 were mixed with accessions of other species. Regarding higher-level groupings, these researchers found absence of support for 4 Petota clades proposed by Spooner and colleagues, and conclude that recent speciation and high levels of hybridization will likely challenge attempts to create a genetic taxonomy of wild potatoes. 

Given the above background, one might guess that a minimalist approach (ie DNA barcoding) using 2 or 3 plastid genes might not distinguish among Petota species whose underlying taxonomy and genetics are so jumbled. Thus I am puzzled why the author went to the trouble of performing this study, and why, having set out to do so, he analyzed only a single plastid gene (trnH-psbA spacer) when all recent plant barcoding studies I am aware of are based on a combined analysis of 2 or 3 plastid genes. The author also analyzed ITS nuclear gene segment (approximately 800 nucleotide segment containing ITS 1, 5.8S rRNA, and ITS2). This is interesting, although for some reason the phylogenetic analysis looked at ITS segment and trnH-psbA individually. I believe there is general understanding that a single barcode region will not suffice for distinguishing land plants. Lastly, I am puzzled why only 23 of 63 species analyzed were represented by multiple accessions. The author asserts “many barcoding studies lack robust assessments of intraspecific polymorphism or assessments of all species within a genus that are needed to assess the species-specific nature of barcodes;” as a general criticism I believe this comment is incorrect, but it does apply to the present study.  

To summarize the study, 104 accessions of 63 Petota species plus 10 accessions of 9 outgroup species were analyzed (the author does not comment as to whether the selections are drawn from the revised total of 110 Petota species as defined in his laboratory). Regarding ITS, 23 species were represented by more than one accession; of these 10 species formed monophyletic lineages, which seems surprisingly good species-level resolution for a single marker in plants. With trnH-psbA, 17 species were represented by more than one accession; of these only 2 formed separate clades (1 of which did not form a distinct clade with ITS); as above, combined analysis was not done. The author dismisses matK on the basis of two previously published sequences for Petota sp. Finally, the trees used parsimony not neighbor-joining, the latter being the usual first-pass method of looking at barcode data. I find this paper a haphazard assessment of DNA barcoding in a taxonomically intensively-studied but poorly understood group. 

High rates of horizontal gene transfer in archaea and eubacteria mean that it is not possible to draw clear species boundaries. It may be that relationships among potato species are similarly complex, and that species boundaries are fuzzier than the current taxonomy of morphologically-defined species would suggest.  It seems to me that more taxonomic and genetic work is needed on this important group, including better tests of barcoding with combined analysis of 2 or 3 of the standard plastid regions in multiple accessions from a larger number of species. The goal of a standardized minimalist approach to identifying species, including wild potatoes, is important to help move beyond having only experts being able to identify plant species.

A diversity of open access DNA barcoding articles

The entire May 2009 Mol Ecol Res “Special Issue on Barcoding Life” is open access, thanks to support from Genome Canada and NSERC. As an aside, Mol Ecol Res publisher Wiley-Blackwell, which puts out over 1400 journals, charges $3000 US per article for open access, as compared to, for example, $1300 in PLoS ONE (all articles open access), and $1200 (plus $70/page) for open access option in Proc Natl Acad Sci USA. If funders mandate open access for publications based on research they support, then either this differential will disappear, or many manuscripts will migrate to lower cost journals. The special barcoding issue is based on Canadian Barcode of Life Network Scientific Symposium held at the Royal Ontario Museum in April 2008 and includes 27 articles on topics ranging from methodology to applications in creatures great and small including fungi and plants.

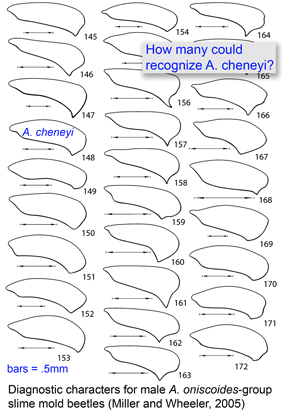
Most DNA barcoding analyses look at DNA identification through the lens of established taxonomy, ie how well does sequence data capture the species-level taxonomic categories established by morphologic analysis? In the special issue article “DNA barcoding and the mediocrity of morphology” researchers from York University and University of Guelph look at the comparison the other way around–how well does morphology identify the sorts of specimens that can be distinguished by DNA-based methods, barcoding in particular? In Packer and colleagues’ analysis, morphology comes up short “in numerous important situtations such as the association of larvae with adults and discrimination among cryptic species.” Taking an example not entirely at random, the authors analyze a key to Agathidium genus slime mold beetles co-authored by a sometime skeptic of barcoding (Miller and Wheeler, 2005) (this key made popular news as 3 of newly described beetles were named in tribute to then current US government officials–A. bushi, A. cheneyi, A. rumsfeldi). As is common in keys to insect identification, the reliance on adult male characters, usually genitalia, means that females and immature forms often cannot be identified to species (for the 3 USG namesakes, the key states “female not examined” and there is no description of immature forms). Again typical of insect keys, there is no documentation of intraspecific variation in diagnostic characters (for A. cheneyi, “the holotype is the only specimen examined of this species”). As a result, Packer and colleagues note “the morphological equivalent of the barcode gap that enables molecular identification of species cannot be calculated using traditional approaches, and the sample size of illustrations upon which measures of intraspecific variation might be estimated usually averages one per species with zero variance.”

I hope that future keys for slime mold beetles will include DNA barcode sequences. This will enable anyone, scientists and public alike, with access to a DNA sequencer to identify A. cheneyi adults of both sexes, larvae, fragments in the guts of predators, and perhaps eggs in random leaf litter samples.

Coaxing DNA out of ancient insects and sediments

Deep space telescopes gather light from the early universe, providing pictures of the unimaginably remote past. What about the biological universe–can we peer back in time? Geochemical evidence suggests life on Earth arose about 3.5 billion years ago and fossils reveal what life looked like as far back as 3.0 billion years, and important fossil discoveries across that whole span of time continue to be made. What about DNA?  As Carl Woese first realized, DNA sequences of living organisms contain signatures of their evolutionary relationships, and enable reconstructing history as far back as the origin of replication, even before cells and DNA. At the near end of the time scale, recovery of DNA from historical samples can help identify organisms that lived hundreds, thousands, tens of thousands, or even, in a few cases so far, hundreds of thousands years ago.

In April 2009 PLoS ONE ten researchers from university centers in Denmark, United Kingdom, United States, Canada, Russia, and New Zealand report on non-destructive recovery of diagnostic DNA from ancient insect specimens. As an aside, PLoS ONE is an important sea change in scientific publishing. First of all, as described on their website, the journal “features reports of original research from all disciplines within science and medicine. By not excluding papers on the basis of subject area, PLoS ONE facilitates the discovery of the connections between papers whether within or between disciplines.” Second, it puts the judgement of importance in the hands the scientific community where it belongs: 
“Too often a journal’s decision to publish a paper is dominated by what the Editor/s think is interesting and will gain greater readership — both of which are subjective judgments and lead to decisions which are frustrating and delay the publication of your work. PLoS ONE will rigorously peer-review your submissions and publish all papers that are judged to be technically sound. Judgments about the importance of any particular paper are then made after publication by the readership (who are the most qualified to determine what is of interest to them).”

This is so sensible it is surprising it has not happened earlier! There is of course a place for journals like Nature and Science, but I expect that a great deal of scientific publishing will migrate to PLoS ONE, with benefits to the authors and the scientific community.  

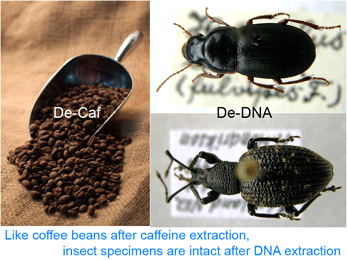
Back to the paper. Thomsen and colleagues first tested a non-destructive extraction method (Gilbert et al 2007 PLoS ONE 2:e272) on museum beetle specimens. This involves overnight incubation with gentle agitation in a digestion buffer at 55^o C. Remarkably, the specimens emerged none the worse for the wear. The researchers recovered 77-204 bp segments of mtCOI from all of 20 beetles, which were collected as early as 1825 (1/3 were over 100 years old). Using a Bayesian approach that generates taxonomic assignments with probability estimates, these short fragments were sufficient for identification to species in most cases; the remainder could be assigned to family or genus level. The researchers then applied this same technique to insect chitin (exoskeleton) fragments preserved in permafrost dating from about 7,000 to over 47,000 years before present (BP). Here only 3 of the 14 (21%) samples (10,000-26,000 y BP) yielded amplifiable DNA, with Bayesian assignments to family or order level. Although the authors appear to have hoped for higher success, this seems pretty remarkable to me. They speculate that destructive sampling might have produced higher yields.

Saving what might be the best for last, Thomsen and colleagues tested non-frozen sediment samples that lacked visible insect parts collected in New Zealand caves and dated 1800 to 3280 years BP. Using a more or less standard extraction protocol developed by some of the authors (Willerslev et al 2003 Science 300:791), 96 bp fragments of COI (1 beetle, 1 butterfly) were recovered from 2 of 3 samples tested. The authors drily note “although the non-frozen sediment DNA approach involves destructive sampling, it has the advantage that the material is the sediment itself, which is usually abundant, and normally not too valuable to process.”

I conclude that if bits of DNA are preserved in ancient dirt then DNA from the past and present must be all around us. Perhaps single molecule sequencing methods will reveal an even greater abundance and diversity of DNA in environmental samples.
Dinoflagellate diversity revealed by DNA

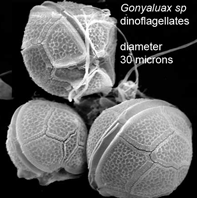
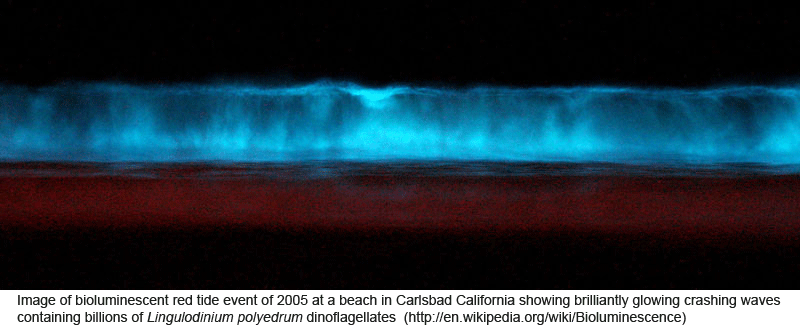
Peering into the vast diversity of life beyond multicellular eukaryotes (animals, plants, and fungi) is dizzying. In March 2009 Applied Environ Microbiol researchers from University of Connecticut assess dinoflagellate diversity with mitochondrial DNA sequencing. Dinoflagellates are unicellular, often photosynthetic, mostly marine plankton characteristically having two flagella and encased in a segmented hardened exterior. Dinoflagellate blooms are the cause of red tides, and dinoflagellate toxins ingested by fish and shellfish are the cause of ciguatera and paralytic shellfish poisoning. For unknown reasons, some species are bioluminescent when mechanically stimulated, producing glowing displays when perturbed by waves, fish, or kayakers, for example.

As a first step toward creating a reference library, Lin and colleagues compiled mtDNA sequences from 49 dinoflagellate species representing six orders (this included 20 COI and 60 cytochrome b sequences; 12 of the latter were newly obtained in this study). As there are about 2500 named dinoflagellate species, this is a sparsely-populated reference library so far. In addition, there were multiple samples from just 5 species, so intraspecific variation is not yet well-studied. As an aside, I note that most of the published and new sequences were derived from strains maintained at Pravasoli-Guillard National Center for Culture of Marine Phytoplankton (CCMP). There is no explicit mention of CCMP in the paper or GenBank depositions, although a plankton specialist would probably recognize the source from sample designations. More generally, there is no formal documentation of taxonomic identifications (eg collection sources for cultures or photographs for environmental samples and/or individual who performed identifications). Although this is not unusual in taxonomic papers, it seems to me that identifications should be as well documented as for example PCR conditions. 

In preparing the reference library, the researchers were unable to develop primers that amplified the barcode region of COI efficiently (ie the primers worked with some species and not others) and instead focused on cytochrome b using a primer pair that amplified a 385 bp segment. The primer difficulty is surprising given that COI is usually more conserved than cyt b (including in dinoflagellates), which should make it easier to design broad-range primers.  

The researchers then analyzed pooled environmental DNA samples prepared by filtering water specimens collected during different months at 3 marine stations in Long Island Sound and at a freshwater retention pond (Mirror Lake) on the University of Connecticut campus. While PCR products from monospecific cultures were sequenced directly, those from environmental samples were first cloned, and then 20 to 50 clones from each water sample were sequenced (total clones analyzed 450). 

Lin and co-workers obtained a large number of distinct haplotypes from the environmental samples; by my inspection of their phylogram nearly all of the clones (>420) were unique. Only a small minority could be assigned to known species or genera. On the technical side, the authors used a complex model of nucleotide substitution (TVM+G) to calculate differences among haplotypes and UPGMA to create trees, so their distance results and trees are not directly comparable to those in most DNA barcoding papers, which use K2P- or p-distances to calculate differences and neighbor-joining to create trees. In any case, according to the authors, the sequence results consistently showed greater diversity than was detected through microscopic analysis, “likely caused by the much higher detection sensitivity of PCR than of microscopic counting and by some genotypes that could not be discriminated morphologically.” The authors conclude “[w]hen a broader cob [cyt b] database becomes available, the taxon-resolving power of this gene would certainly increase.” I hope they or others will also develop efficient primer sets for amplifying COI in addition to cyt b

Looking ahead, the reference library can be augmented relatively inexpensively by analyzing mtDNA sequences of the 2400 strains at CCMP. However, the mtDNA diversity in this study suggests dozens of new species from just 4 sampling sites around Connecticut, implying the global total of undescribed species is very large. This suggests a need for some sort of “automated species identifier”: a machine approach that would sort samples into individual cells, then photograph, sequence, apply MOTU-type analysis, for example. In the meantime, it may be necessary to work with pooled sequences from environmental samples, as is done for bacterial communities, without attempting to delineate species.

DNA sorts out bewildering morphology

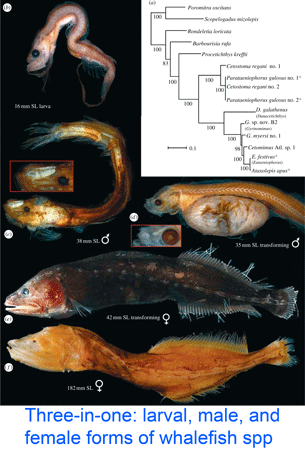
DNA helps flag genetically divergent forms that may represent cryptic species and is equally valuable the other way around: in linking morphologically diverse forms that occur within species. In 20 jan 2009 Biol Lett, researchers from National Museum of Natural History, Washington, DC; Australian Museum, Sydney; Virginia Institute of Marine Science; University of Tokyo; and Natural History Museum, Tokyo, solve the mystery of “the most extreme example of ontogenetic morphoses and sexual dimorphism in vertebrates.”

Johnson and colleagues examined specimens of small (body size 4-408 mm) deep water (1000-4000m) fishes thought to represent 3 families in the order Stephanoberyciformes (whalefish and relatives). The authors analyzed morphology and whole mitochondrial genomes from 34 individuals of 16 species including representatives of all 5 whalefish families. They found three whalefish “families” are one: “Mirapinnidae (tapetails), Megalomycteridae (bignose fishes), and Cetomimidae (whalefishes), are larvae, males and females, respectively of a single family Cetomimidae.” These are strange-looking fish–the males, which do not feed as adults, are sustained by enormous livers, and the minute larvae have streamers up to 75 cm. For fun, see deep ocean video of live female whalefish swimming (and narration of the amazed icthyologists) in supplementary material. Next up is to link the three life stages of each species; here DNA will help along with meristic data (quantitative features such as number of fins or scales).

Why do mitochondria differ among species?

Mitochondria are the power plants of the cell, consuming oxygen and breakdown products of sugars, amino acids, and fatty acids to produce energy as ATP and heat.  As originally proposed by Lynn Margulis in 1967, mitochondria, which have their own circular genome and replicate independently of the cell, are derived from an ancient symbiosis of an an alpha-proteobacterium related to gram-negative bacteria. 

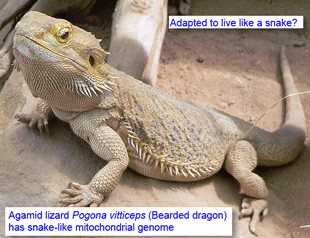
In multicellular animals, most of the 100+ proteins in mitochondria are encoded by nuclear genes. The mitochondrial genome is only about 16 kb (vs about 2000 kb for nearest bacterial relatives Rickettsia sp) and encodes just 13 proteins, all of which function in the electron transport chain, plus 2 ribosomal RNAs and approximately 20 tRNAs.  Multiple protein-protein interactions (for example, complex I comprises 34 nuclear-encoded and 7 mitochondrial-encoded proteins) suggest there must be close co-evolution between nuclear and mitochondrial genomes; this might be one of the constraints on mitochondrial variation. Although an enormous amount of information on mitochondrial sequence differences among and within species has been been compiled (through DNA barcoding initiative and other efforts), there is surprisingly little study so far on whether mitochondrial differences among species reflect functional adaptation (although see Ruiz-Pesini et al 2004 Science 303:223, Bayona-Balfaluy et al 2004 Mol Biol Evol 22:716).  

In 25 February 2009 Proc R Soc B researchers from University of Groningen, The Netherlands; Max Planck Institute for Ornithology, Germany; and Ohio State University investigate whether mitochondrial differences modulate energy metabolism in birds. As mitochondria consume 90% of respired oxygen, mitochondrial activity presumably determines basal metabolism. Tieleman and colleagues performed crosses among 3 captive bred populations of stonechats (Saxicola torquata spp.) that differ in basal metabolic rate, which presumably reflects adaptation to different climates: Africa (Kenya, Saxicola torquata axillaris), Asia (Kazakhstan, Saxicola torquata maura), and Europe (Austria, Saxicola torquata rubicola). As an aside, I note that these three taxa are elevated to species status in current world checklists (Clements 2007, IOC Checklist; even 1992 edition of Birds of Europe notes “Siberian race may be a full species.”) This does not change the interpretation of the findings, but it does reflect the confused nature of taxonomic science that even for a group as well studied as birds, publication standards accept this laxity in taxonomic classification. Naming of bacteria in medical studies is more uniformly up to date than for multicellular animals; it seems that animal taxonomists have not found a way to establish a regularly updated consensus. In this regard the IOC Checklist suggests a way forward: “in this global world of wiki-style sharing of knowledge, we invite world birders and ornithologsts alike to help us keep the IOC list accurate, vital, and accessible.” 

Back to the paper. Tieleman and colleagues “tested for a genetic effect on BMR based on mitochondrial-nuclear coadaptation using hybrids between ancestral populations with high and low BMR (Europe-Africa and Asia-Europe), with different parental configurations (female-high x male-low or female-low x male-high). Hybrids with different parental configurations have on average identical mixtures of nuclear DNA, but differ in mitochondrial DNA because it is inherited only from the mother.”  The researchers found that metabolic rate differed between hybrids with contrasting parental configurations, “providing evidence for the importance of a match between mitochondrial and nuclear genomes to regulate metabolic rate.” So far so good. However, contrary to expectations, in both sets of crosses, metabolic rates in hybrids were more similar to that of the father than the mother! (see adapted figure). This result is a puzzler; it suggests there might be another factor such as genomic imprinting at work. 

Looking at the bigger picture, for those interested in mitochondrial evolution, there is a lot of opportunity: a large and growing database of COI sequences (>500,000 individuals, >50,000 species so far) that is waiting to be analyzed for evidence of purifying or positive selection, for example, or for limits to plasticity in COI amino acid sequence. I wonder if there might be convergent evolution of COI, such that diverse organisms in very cold or very hot environments environments, for example, might exhibit similar amino acid substitutions.

DNA analysis helps unravel food webs

What do leaf beetles (Chrysomelidae) eat? In 11 Nov 2008 Proc R Soc B researchers from Spain, London, and Australia, apply DNA analysis to 76 species (1 individual/species) of Australian leaf beetles. Jurado-Rivera and colleagues extracted DNA from whole beetles using DNAeasy kit. To identify plant DNA in beetle extracts, they amplified chloroplast trnL intron (313 to 581 bp in analyzed samples). 70 (92%) of samples gave high quality reads after direct sequencing of the PCR products, consistent with ingestion of a single plant species; the remaining samples were sequenced from cloned PCR products; these gave 2 divergent clones in 3 of seven cases, for a total of 81 different trnL intron sequences. Why use trnL intron? The authors cite the large number of sequences in GenBank and favorable experience (ie successful amplification and good taxonomic resolution) in their prior work and that of others (eg Taberlet et al 2007 Nucleic Acids Res 35:e14). This certainly makes sense, but I hope a general agreement for plant barcode standards will be published shortly, otherwise the field will continue to be hobbled by having multiple incomplete and non-overlapping databases for the various markers. For example, according to the authors “only 14 and 15 of approximately 1000 and 800 described Australian species of Acacia and Eucalyptus, respectively, are represented in GenBank by trnL intron sequences. As to what resolution is possible with current trnL database, the authors found “reliable identification to plant family in every case and very frequently the inference is possible at lower taxonomic levels.” 

There also needs to be an agreement to have a curated plant barcode database. As the authors report, “in the course of this study, we found several examples of erroneous taxonomic assignments (e.g. Sapindaceae identified as Cypripedium, Cypripedioideae; Apocynaceae labelled as Sesamum, Pedaliaceae; one case of names switched between Pittosporum and Cheiranthera, both Pittosporaceae; suspicious generic assignment for Aesculus x carnea), and of sequencing artefacts (e.g. Tragopogon spp., Acacia usumatensis) and chimeras (e.g.Pentaphylax euryoides). Problems introduced by these sequences were only apparent after careful inspection of trees revealing suspicious relationships, and required phylogenetic re-evaluation after removing problematic sequence data.” 

This is helpful for the present study, but the problematic sequences remain in the reference databases, ready to trip up the next set of researchers who might not be so careful. To fix this problem, Jurado-Rivera and colleagues make what I think is the wrong suggestion, namely “all of the above would argue for the use of additional markers”. Adding markers may improve the ability to make species-level identifications in plants, but if the goal is to construct an error-free database, adding markers is an expensive and likely ineffective way to ferret out mislabeled or otherwise inaccurate sequences. What is needed is a stand-alone database, closely-linked to GenBank, in which problematic sequences can be weeded out or re-labeled (ie Barcode of Life Database (BOLD) www.barcodinglife.org).

To construct a beetle phylogeny, the authors amplified COI and EF1a from their specimens. They found strong concordance between the evolutionary histories of Australian Chrysomelinae beetles and their host plants, indicating long-term co-evolution. They conclude “our analysis not only shows the details of ecological associations for a dominant herbivore group but also offers the basis for their evolutionary interpretation.”

I am puzzled that the authors amplified a segment in the 3′ half of COI that does not overlap with the standard animal barcode region, making it impossible to combine their data with the 500,000+ COI sequences analyzed to date (www.barcodinglife.org). This important caveat aside, I look forward to many more studies that utilize DNA barcoding to join ecology and phylogenetics.

Why we make maps

In 1 Oct 2008 Syst Entomol researchers from University of Alberta report on “Widespread decoupling of mtDNA variation and species integrity in Grammia tiger moths.” Authors Schmidt and Sperling analyzed COI sequences from 274 specimens representing 28 of 36 known Grammia species, collected across Canada and US. An NJ tree showed 13 haplogroups (loose clusters); 11 of these “largely or exclusively corresponded to nominal species,” while the other two, “designated the Western and Eastern haplogroups, contained polyphyletic asemblages of 13 and 10 species, respectively.” The researchers conclude that these two tangles of sequences and species represent historical or ongoing mating between species and “research on factors governing hybridization would be particularly informative in gaining an understanding of the role of isolating mechanisms in speciation” (ie DNA barcoding highlights an interesting group for further study). 

Like explorers mapping new territory, Schmidt and Sperling’s study creates a map that can be used by the next investigators studying these moths, whether as eggs, larva (according to Caterpillars of Eastern North America by David Wagner, Princeton University Press, 2005 “there are no keys that can be used to identify the [Grammia] caterpillars with reliability”), intact adults, or as fragments retrieved from droppings of predator species such as bats. Specimens with COI barcodes in the two polyphyletic tangles will at least be identifiable to a subset of species within the genus.       

This study brings to mind an analogy between GPS and DNA barcodes. Handheld GPS devices enable us to pinpoint our location on the earth’s surface within a few meters. We then use a map to translate the numerical coordinates into useful information. In areas where the mapping is incomplete or out of date, GPS coordinates are less informative and may be misleading. 

A DNA sequencer (handheld version soon perhaps) is a “biodiversity GPS” device, a DNA barcode is a set of biodiversity GPS coordinates, and a barcode reference library is a biodiversity map on which the specimen’s taxonomic identity can be located. In areas that have been mapped in detail (ie records from multiple specimens across the species range and from closely-related species), a barcode sequence will usually enable precise species-level identification with a high degree of certainty. In groups less-well surveyed or in which the taxonomy is unknown, there will be more uncertainty. Nonetheless, the general coherence of genera, families, and even orders in simple COI NJ trees (see figure below) suggests a DNA barcode will usually provide useful taxonomic information even in the absence of comprehensive taxonomic coverage.

I expect that in the future there will be good methods for defining species based on sequence data, including COI barcode records. While the importance of genetic data as an indicator of species status is informally recognized in science reporting (eg “DNA analysis confirmed it was a new species”), it is generally relegated to an ancillary role in species descriptions. It is remarkable to me that of all the mathematical tools of phylogeography, population genetics and phylogenetic reconstruction, none are designed to diagnose species. Just as a node in a ML tree may have 90% bootstrap support, why not apply the same rigor to species-level genetic data and say, for example, 90% confidence that this particular cluster represents a distinct species. I understand this would involve adopting a particular species concept, but at least it would be a place to start. If the data were only COI or other mtDNA sequences, then there might need be a warning about possible introgression as the above study demonstrates. I believe the flood of data from the barcode initiative, with multiple sequences from tens or hundreds of thousands of species, will help push development of such tools.